Air Pollution in Xunyangqu: Real-time Air Quality Index and smog alert.
Pollution and air quality forecast for Xunyangqu. Today is Tuesday, June 2, 2026. The following air pollution values have been recorded for Xunyangqu:- particulate matter (PM10) suspended dust - 179 (Very bad Hazardous)
- particulate matter (PM2.5) dust - 35 (Unhealthy for Sensitive Groups)
- ozone (O3) - 0 (Good)
- nitrogen dioxide (NO2) - 0 (Good)
- sulfur dioxide (SO2) - 0 (Good)

What is the air quality in Xunyangqu today? Is the air polluted in Xunyangqu?. Is there smog?
What is the level of PM10 today in Xunyangqu? (particulate matter (PM10) suspended dust)
The current level of particulate matter PM10 in Xunyangqu is:
179 (Very bad Hazardous)
The highest PM10 values usually occur in month: 126 (January 2019).
The lowest value of particulate matter PM10 pollution in Xunyangqu is usually recorded in: February (46).
What is the current level of PM2.5 in Xunyangqu? (particulate matter (PM2.5) dust)
Today's PM2.5 level is:
35 (Unhealthy for Sensitive Groups)
For comparison, the highest level of PM2.5 in Xunyangqu in the last 7 days was: 56 (Friday, May 27, 2022) and the lowest: 56 (Friday, May 27, 2022).
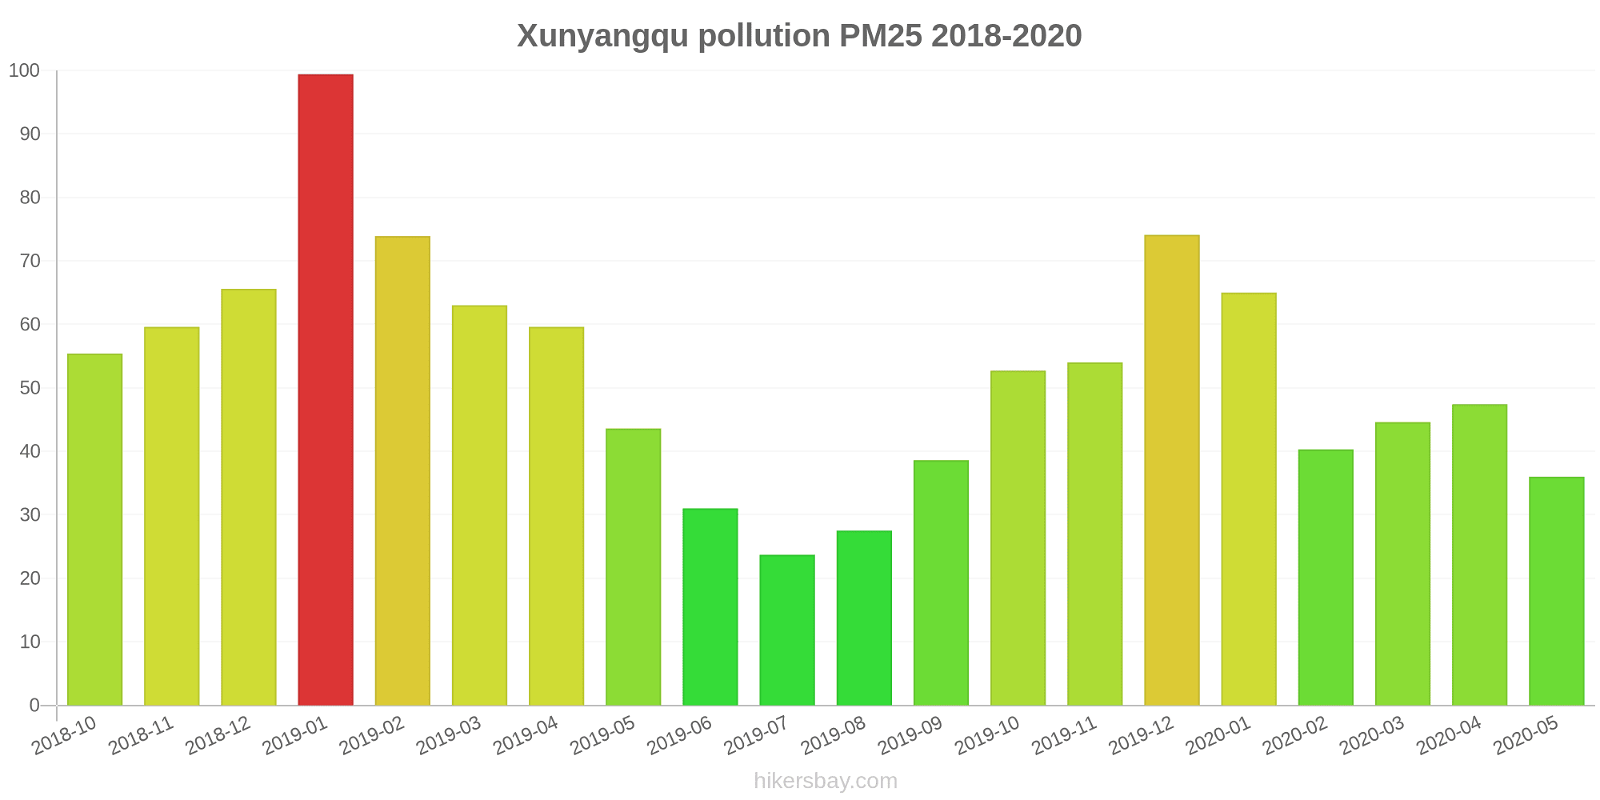
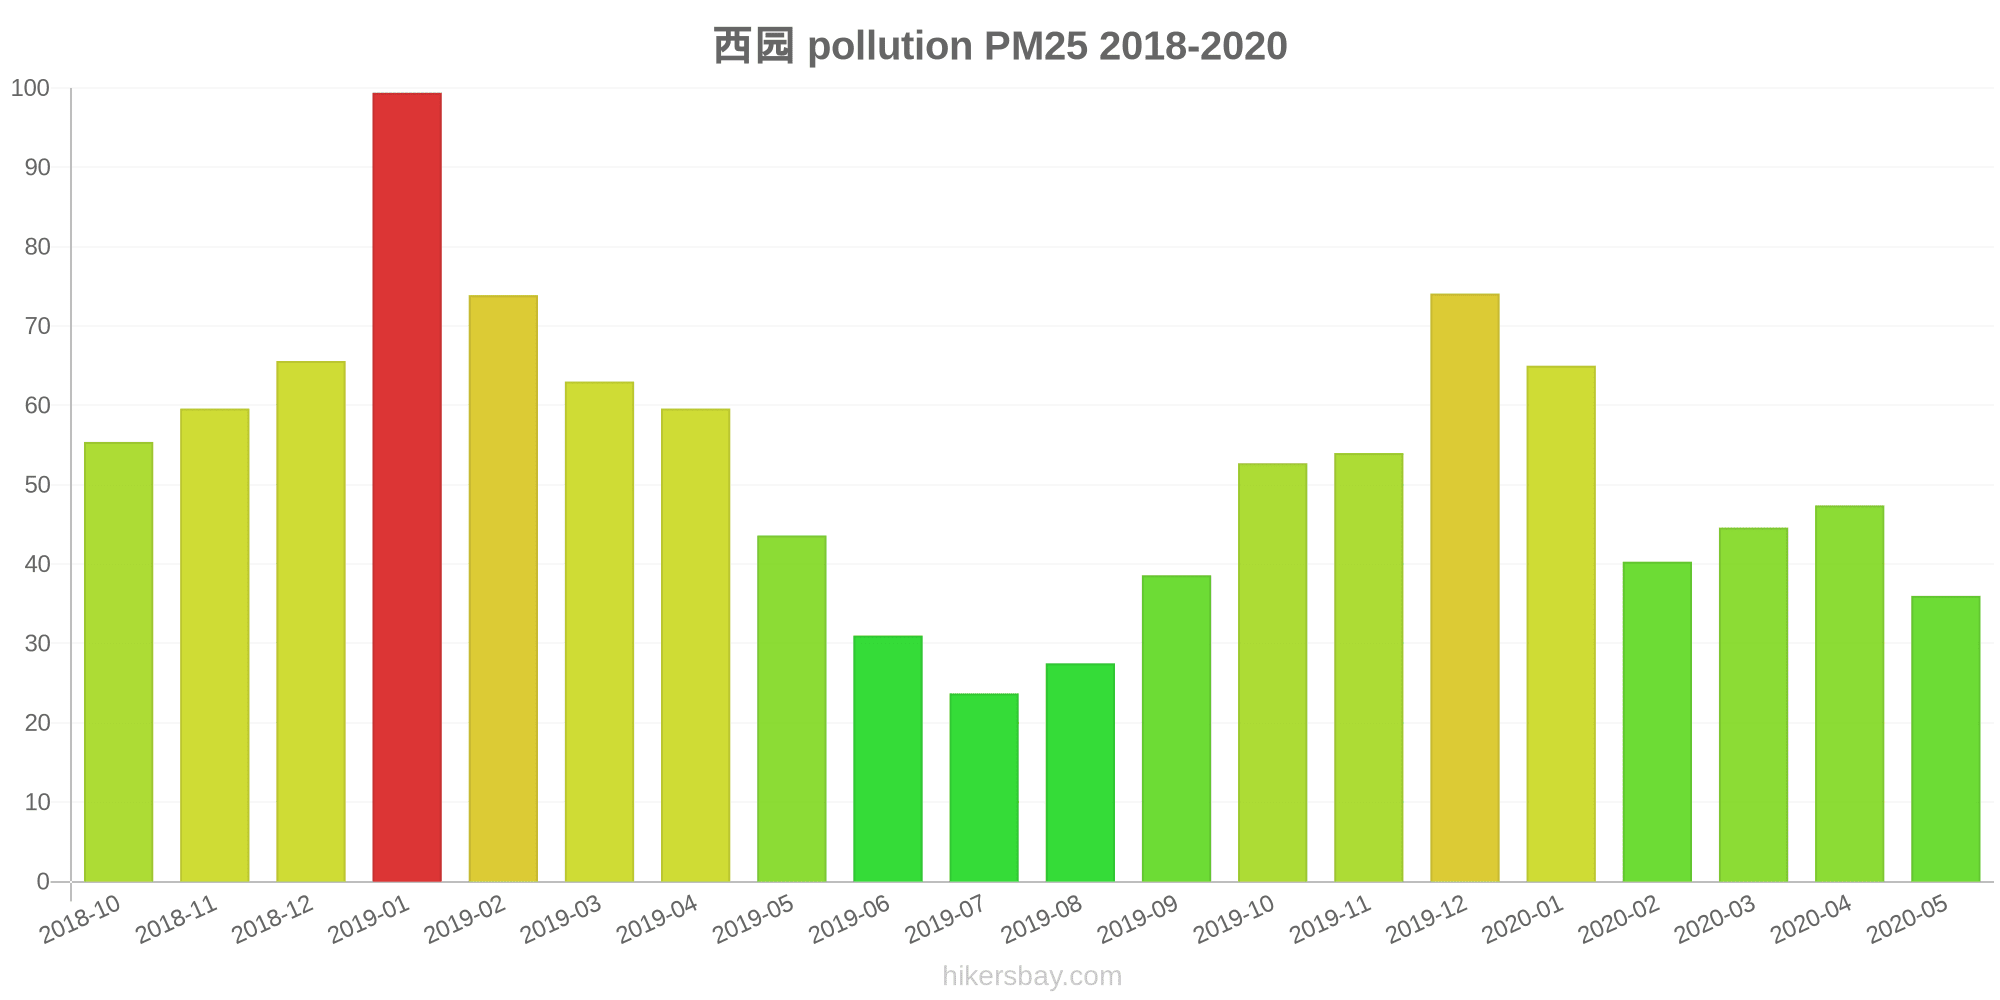
The highest PM2.5 values were recorded: 99 (January 2019).
The lowest level of particulate matter PM2.5 pollution occurs in month: July (24).
How is the O3 level today in Xunyangqu? (ozone (O3))
0 (Good)
How high is the level of NO2? (nitrogen dioxide (NO2))
0 (Good)
What is the level of SO2 pollution? (sulfur dioxide (SO2))
0 (Good)
Current data Friday, May 27, 2022, 12:00 PM
PM10 179 (Very bad Hazardous)
PM2,5 35 (Unhealthy for Sensitive Groups)
O3 0 (Good)
NO2 0 (Good)
SO2 0 (Good)
Data on air pollution from recent days in Xunyangqu
index
2022-05-27
pm10
56
Unhealthy for Sensitive Groups
pm25
56
Unhealthy
o3
0
Good
no2
0
Good
so2
0
Good
data source »
Air pollution in Xunyangqu from October 2018 to May 2020
index
2020-05
2020-04
2020-03
2020-02
2020-01
2019-12
2019-11
2019-10
2019-09
2019-08
2019-07
2019-06
2019-05
2019-04
2019-03
2019-02
2019-01
2018-12
2018-11
2018-10
pm25
36 (Unhealthy for Sensitive Groups)
47 (Unhealthy for Sensitive Groups)
45 (Unhealthy for Sensitive Groups)
40 (Unhealthy for Sensitive Groups)
65 (Unhealthy)
74 (Unhealthy)
54 (Unhealthy for Sensitive Groups)
53 (Unhealthy for Sensitive Groups)
39 (Unhealthy for Sensitive Groups)
28 (Moderate)
24 (Moderate)
31 (Moderate)
44 (Unhealthy for Sensitive Groups)
60 (Unhealthy)
63 (Unhealthy)
74 (Unhealthy)
99 (Very Unhealthy)
66 (Unhealthy)
60 (Unhealthy)
55 (Unhealthy)
co
718 (Good)
465 (Good)
493 (Good)
574 (Good)
556 (Good)
610 (Good)
656 (Good)
540 (Good)
560 (Good)
609 (Good)
555 (Good)
588 (Good)
606 (Good)
681 (Good)
548 (Good)
795 (Good)
760 (Good)
892 (Good)
601 (Good)
880 (Good)
no2
24 (Good)
36 (Good)
26 (Good)
18 (Good)
28 (Good)
45 (Moderate)
42 (Moderate)
34 (Good)
22 (Good)
18 (Good)
21 (Good)
28 (Good)
42 (Moderate)
39 (Good)
41 (Moderate)
29 (Good)
39 (Good)
33 (Good)
39 (Good)
46 (Moderate)
o3
134 (Unhealthy for Sensitive Groups)
143 (Unhealthy for Sensitive Groups)
93 (Moderate)
81 (Moderate)
54 (Good)
60 (Good)
99 (Moderate)
126 (Unhealthy for Sensitive Groups)
173 (Unhealthy)
158 (Unhealthy)
118 (Moderate)
136 (Unhealthy for Sensitive Groups)
133 (Unhealthy for Sensitive Groups)
108 (Moderate)
95 (Moderate)
56 (Good)
54 (Good)
52 (Good)
73 (Moderate)
104 (Moderate)
pm10
63 (Unhealthy for Sensitive Groups)
73 (Unhealthy for Sensitive Groups)
62 (Unhealthy for Sensitive Groups)
46 (Moderate)
66 (Unhealthy for Sensitive Groups)
77 (Unhealthy for Sensitive Groups)
82 (Unhealthy)
76 (Unhealthy for Sensitive Groups)
70 (Unhealthy for Sensitive Groups)
60 (Unhealthy for Sensitive Groups)
52 (Unhealthy for Sensitive Groups)
57 (Unhealthy for Sensitive Groups)
95 (Unhealthy)
81 (Unhealthy)
90 (Unhealthy)
80 (Unhealthy)
126 (Very Unhealthy)
87 (Unhealthy)
81 (Unhealthy)
97 (Unhealthy)
so2
15 (Good)
13 (Good)
11 (Good)
8.1 (Good)
8.6 (Good)
12 (Good)
12 (Good)
12 (Good)
11 (Good)
9.5 (Good)
9.3 (Good)
10 (Good)
15 (Good)
13 (Good)
11 (Good)
9.9 (Good)
15 (Good)
12 (Good)
14 (Good)
17 (Good)
data source »
西园
Friday, May 27, 2022, 12:00 PM
PM10 179 (Very bad Hazardous)
particulate matter (PM10) suspended dust
PM2,5 35 (Unhealthy for Sensitive Groups)
particulate matter (PM2.5) dust
O3 0.04 (Good)
ozone (O3)
NO2 0 (Good)
nitrogen dioxide (NO2)
SO2 0 (Good)
sulfur dioxide (SO2)
西园
index
2022-05-27
pm10
56
pm25
56
o3
0.03
no2
0
so2
0
西园
2018-10 2020-05

index
2020-05
2020-04
2020-03
2020-02
2020-01
2019-12
2019-11
2019-10
2019-09
2019-08
2019-07
2019-06
2019-05
2019-04
2019-03
2019-02
2019-01
2018-12
2018-11
2018-10
pm25
36
47
45
40
65
74
54
53
39
28
24
31
44
60
63
74
99
66
60
55
co
718
465
493
574
556
610
656
540
560
609
555
588
606
681
548
795
760
892
601
880
no2
24
36
26
18
28
45
42
34
22
18
21
28
42
39
41
29
39
33
39
46
o3
134
143
93
81
54
60
99
126
173
158
118
136
133
108
95
56
54
52
73
104
pm10
63
73
62
46
66
77
82
76
70
60
52
57
95
81
90
80
126
87
81
97
so2
15
13
11
8.1
8.6
12
12
12
11
9.5
9.3
10
15
13
11
9.9
15
12
14
17
* Pollution data source:
https://openaq.org
(ChinaAQIData)
The data is licensed under CC-By 4.0
PM10 179 (Very bad Hazardous)
PM2,5 35 (Unhealthy for Sensitive Groups)
O3 0 (Good)
NO2 0 (Good)
SO2 0 (Good)
Data on air pollution from recent days in Xunyangqu
| index | 2022-05-27 |
|---|---|
| pm10 | 56 Unhealthy for Sensitive Groups |
| pm25 | 56 Unhealthy |
| o3 | 0 Good |
| no2 | 0 Good |
| so2 | 0 Good |

| index | 2020-05 | 2020-04 | 2020-03 | 2020-02 | 2020-01 | 2019-12 | 2019-11 | 2019-10 | 2019-09 | 2019-08 | 2019-07 | 2019-06 | 2019-05 | 2019-04 | 2019-03 | 2019-02 | 2019-01 | 2018-12 | 2018-11 | 2018-10 |
|---|---|---|---|---|---|---|---|---|---|---|---|---|---|---|---|---|---|---|---|---|
| pm25 | 36 (Unhealthy for Sensitive Groups) | 47 (Unhealthy for Sensitive Groups) | 45 (Unhealthy for Sensitive Groups) | 40 (Unhealthy for Sensitive Groups) | 65 (Unhealthy) | 74 (Unhealthy) | 54 (Unhealthy for Sensitive Groups) | 53 (Unhealthy for Sensitive Groups) | 39 (Unhealthy for Sensitive Groups) | 28 (Moderate) | 24 (Moderate) | 31 (Moderate) | 44 (Unhealthy for Sensitive Groups) | 60 (Unhealthy) | 63 (Unhealthy) | 74 (Unhealthy) | 99 (Very Unhealthy) | 66 (Unhealthy) | 60 (Unhealthy) | 55 (Unhealthy) |
| co | 718 (Good) | 465 (Good) | 493 (Good) | 574 (Good) | 556 (Good) | 610 (Good) | 656 (Good) | 540 (Good) | 560 (Good) | 609 (Good) | 555 (Good) | 588 (Good) | 606 (Good) | 681 (Good) | 548 (Good) | 795 (Good) | 760 (Good) | 892 (Good) | 601 (Good) | 880 (Good) |
| no2 | 24 (Good) | 36 (Good) | 26 (Good) | 18 (Good) | 28 (Good) | 45 (Moderate) | 42 (Moderate) | 34 (Good) | 22 (Good) | 18 (Good) | 21 (Good) | 28 (Good) | 42 (Moderate) | 39 (Good) | 41 (Moderate) | 29 (Good) | 39 (Good) | 33 (Good) | 39 (Good) | 46 (Moderate) |
| o3 | 134 (Unhealthy for Sensitive Groups) | 143 (Unhealthy for Sensitive Groups) | 93 (Moderate) | 81 (Moderate) | 54 (Good) | 60 (Good) | 99 (Moderate) | 126 (Unhealthy for Sensitive Groups) | 173 (Unhealthy) | 158 (Unhealthy) | 118 (Moderate) | 136 (Unhealthy for Sensitive Groups) | 133 (Unhealthy for Sensitive Groups) | 108 (Moderate) | 95 (Moderate) | 56 (Good) | 54 (Good) | 52 (Good) | 73 (Moderate) | 104 (Moderate) |
| pm10 | 63 (Unhealthy for Sensitive Groups) | 73 (Unhealthy for Sensitive Groups) | 62 (Unhealthy for Sensitive Groups) | 46 (Moderate) | 66 (Unhealthy for Sensitive Groups) | 77 (Unhealthy for Sensitive Groups) | 82 (Unhealthy) | 76 (Unhealthy for Sensitive Groups) | 70 (Unhealthy for Sensitive Groups) | 60 (Unhealthy for Sensitive Groups) | 52 (Unhealthy for Sensitive Groups) | 57 (Unhealthy for Sensitive Groups) | 95 (Unhealthy) | 81 (Unhealthy) | 90 (Unhealthy) | 80 (Unhealthy) | 126 (Very Unhealthy) | 87 (Unhealthy) | 81 (Unhealthy) | 97 (Unhealthy) |
| so2 | 15 (Good) | 13 (Good) | 11 (Good) | 8.1 (Good) | 8.6 (Good) | 12 (Good) | 12 (Good) | 12 (Good) | 11 (Good) | 9.5 (Good) | 9.3 (Good) | 10 (Good) | 15 (Good) | 13 (Good) | 11 (Good) | 9.9 (Good) | 15 (Good) | 12 (Good) | 14 (Good) | 17 (Good) |
PM10 179 (Very bad Hazardous)
particulate matter (PM10) suspended dustPM2,5 35 (Unhealthy for Sensitive Groups)
particulate matter (PM2.5) dustO3 0.04 (Good)
ozone (O3)NO2 0 (Good)
nitrogen dioxide (NO2)SO2 0 (Good)
sulfur dioxide (SO2)西园
| index | 2022-05-27 |
|---|---|
| pm10 | 56 |
| pm25 | 56 |
| o3 | 0.03 |
| no2 | 0 |
| so2 | 0 |
西园
| index | 2020-05 | 2020-04 | 2020-03 | 2020-02 | 2020-01 | 2019-12 | 2019-11 | 2019-10 | 2019-09 | 2019-08 | 2019-07 | 2019-06 | 2019-05 | 2019-04 | 2019-03 | 2019-02 | 2019-01 | 2018-12 | 2018-11 | 2018-10 |
|---|---|---|---|---|---|---|---|---|---|---|---|---|---|---|---|---|---|---|---|---|
| pm25 | 36 | 47 | 45 | 40 | 65 | 74 | 54 | 53 | 39 | 28 | 24 | 31 | 44 | 60 | 63 | 74 | 99 | 66 | 60 | 55 |
| co | 718 | 465 | 493 | 574 | 556 | 610 | 656 | 540 | 560 | 609 | 555 | 588 | 606 | 681 | 548 | 795 | 760 | 892 | 601 | 880 |
| no2 | 24 | 36 | 26 | 18 | 28 | 45 | 42 | 34 | 22 | 18 | 21 | 28 | 42 | 39 | 41 | 29 | 39 | 33 | 39 | 46 |
| o3 | 134 | 143 | 93 | 81 | 54 | 60 | 99 | 126 | 173 | 158 | 118 | 136 | 133 | 108 | 95 | 56 | 54 | 52 | 73 | 104 |
| pm10 | 63 | 73 | 62 | 46 | 66 | 77 | 82 | 76 | 70 | 60 | 52 | 57 | 95 | 81 | 90 | 80 | 126 | 87 | 81 | 97 |
| so2 | 15 | 13 | 11 | 8.1 | 8.6 | 12 | 12 | 12 | 11 | 9.5 | 9.3 | 10 | 15 | 13 | 11 | 9.9 | 15 | 12 | 14 | 17 |