Air Pollution in Lushanqu: Real-time Air Quality Index and smog alert.
Pollution and air quality forecast for Lushanqu. Today is Tuesday, June 2, 2026. The following air pollution values have been recorded for Lushanqu:- particulate matter (PM10) suspended dust - 179 (Very bad Hazardous)
- particulate matter (PM2.5) dust - 35 (Unhealthy for Sensitive Groups)
- ozone (O3) - 0 (Good)
- nitrogen dioxide (NO2) - 0 (Good)
- sulfur dioxide (SO2) - 0 (Good)

What is the air quality in Lushanqu today? Is the air polluted in Lushanqu?. Is there smog?
What is the level of PM10 today in Lushanqu? (particulate matter (PM10) suspended dust)
The current level of particulate matter PM10 in Lushanqu is:
179 (Very bad Hazardous)
The highest PM10 values usually occur in month: 104 (January 2019).
The lowest value of particulate matter PM10 pollution in Lushanqu is usually recorded in: February (46).
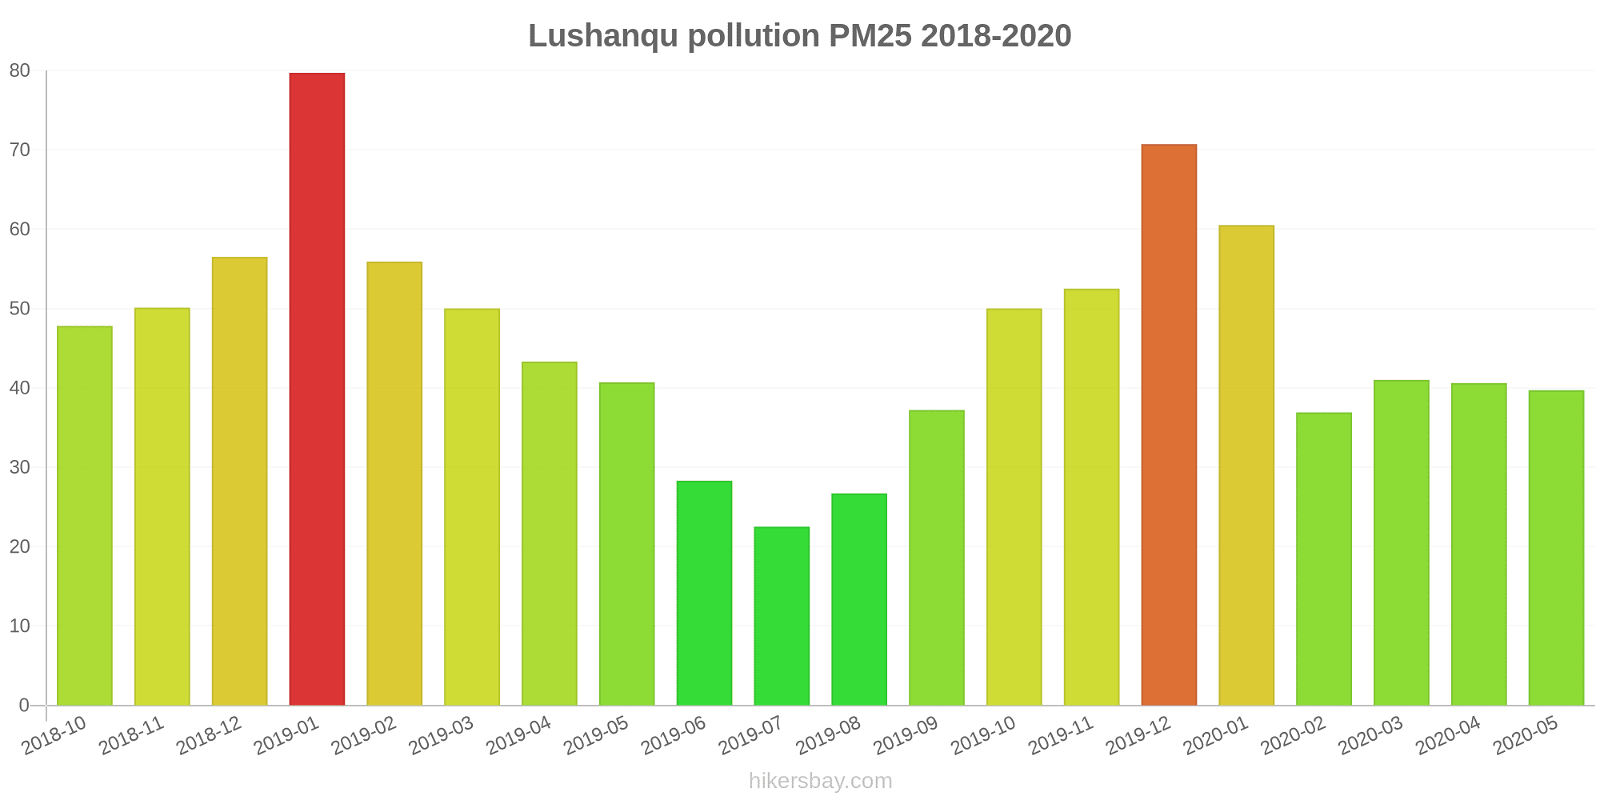
What is the current level of PM2.5 in Lushanqu? (particulate matter (PM2.5) dust)
Today's PM2.5 level is:
35 (Unhealthy for Sensitive Groups)
For comparison, the highest level of PM2.5 in Lushanqu in the last 7 days was: 56 (Friday, May 27, 2022) and the lowest: 56 (Friday, May 27, 2022).
The highest PM2.5 values were recorded: 80 (January 2019).
The lowest level of particulate matter PM2.5 pollution occurs in month: July (23).
How is the O3 level today in Lushanqu? (ozone (O3))
0 (Good)
How high is the level of NO2? (nitrogen dioxide (NO2))
0 (Good)
What is the level of SO2 pollution? (sulfur dioxide (SO2))
0 (Good)
Current data Friday, May 27, 2022, 12:00 PM
PM10 179 (Very bad Hazardous)
PM2,5 35 (Unhealthy for Sensitive Groups)
O3 0 (Good)
NO2 0 (Good)
SO2 0 (Good)
Data on air pollution from recent days in Lushanqu
index
2022-05-27
pm10
56
Unhealthy for Sensitive Groups
pm25
56
Unhealthy
o3
0
Good
no2
0
Good
so2
0
Good
data source »
Air pollution in Lushanqu from October 2018 to May 2020
index
2020-05
2020-04
2020-03
2020-02
2020-01
2019-12
2019-11
2019-10
2019-09
2019-08
2019-07
2019-06
2019-05
2019-04
2019-03
2019-02
2019-01
2018-12
2018-11
2018-10
pm25
40 (Unhealthy for Sensitive Groups)
41 (Unhealthy for Sensitive Groups)
41 (Unhealthy for Sensitive Groups)
37 (Unhealthy for Sensitive Groups)
61 (Unhealthy)
71 (Unhealthy)
53 (Unhealthy for Sensitive Groups)
50 (Unhealthy for Sensitive Groups)
37 (Unhealthy for Sensitive Groups)
27 (Moderate)
23 (Moderate)
28 (Moderate)
41 (Unhealthy for Sensitive Groups)
43 (Unhealthy for Sensitive Groups)
50 (Unhealthy for Sensitive Groups)
56 (Unhealthy)
80 (Very Unhealthy)
57 (Unhealthy)
50 (Unhealthy for Sensitive Groups)
48 (Unhealthy for Sensitive Groups)
co
765 (Good)
665 (Good)
560 (Good)
578 (Good)
714 (Good)
748 (Good)
700 (Good)
673 (Good)
551 (Good)
625 (Good)
593 (Good)
532 (Good)
640 (Good)
682 (Good)
623 (Good)
825 (Good)
932 (Good)
860 (Good)
627 (Good)
631 (Good)
no2
29 (Good)
41 (Moderate)
32 (Good)
17 (Good)
29 (Good)
50 (Moderate)
49 (Moderate)
38 (Good)
28 (Good)
20 (Good)
22 (Good)
22 (Good)
30 (Good)
27 (Good)
32 (Good)
24 (Good)
36 (Good)
33 (Good)
41 (Moderate)
45 (Moderate)
o3
131 (Unhealthy for Sensitive Groups)
147 (Unhealthy for Sensitive Groups)
97 (Moderate)
86 (Moderate)
60 (Good)
65 (Good)
97 (Moderate)
124 (Unhealthy for Sensitive Groups)
163 (Unhealthy)
151 (Unhealthy)
120 (Unhealthy for Sensitive Groups)
137 (Unhealthy for Sensitive Groups)
128 (Unhealthy for Sensitive Groups)
91 (Moderate)
83 (Moderate)
50 (Good)
54 (Good)
46 (Good)
70 (Good)
103 (Moderate)
pm10
64 (Unhealthy for Sensitive Groups)
74 (Unhealthy for Sensitive Groups)
62 (Unhealthy for Sensitive Groups)
46 (Moderate)
69 (Unhealthy for Sensitive Groups)
86 (Unhealthy)
96 (Unhealthy)
83 (Unhealthy)
70 (Unhealthy for Sensitive Groups)
58 (Unhealthy for Sensitive Groups)
48 (Moderate)
50 (Unhealthy for Sensitive Groups)
84 (Unhealthy)
70 (Unhealthy for Sensitive Groups)
78 (Unhealthy for Sensitive Groups)
68 (Unhealthy for Sensitive Groups)
104 (Unhealthy)
84 (Unhealthy)
81 (Unhealthy)
94 (Unhealthy)
so2
12 (Good)
14 (Good)
11 (Good)
8 (Good)
9.7 (Good)
13 (Good)
14 (Good)
13 (Good)
9.9 (Good)
8.9 (Good)
8.8 (Good)
11 (Good)
16 (Good)
9.9 (Good)
11 (Good)
7.2 (Good)
12 (Good)
12 (Good)
13 (Good)
12 (Good)
data source »
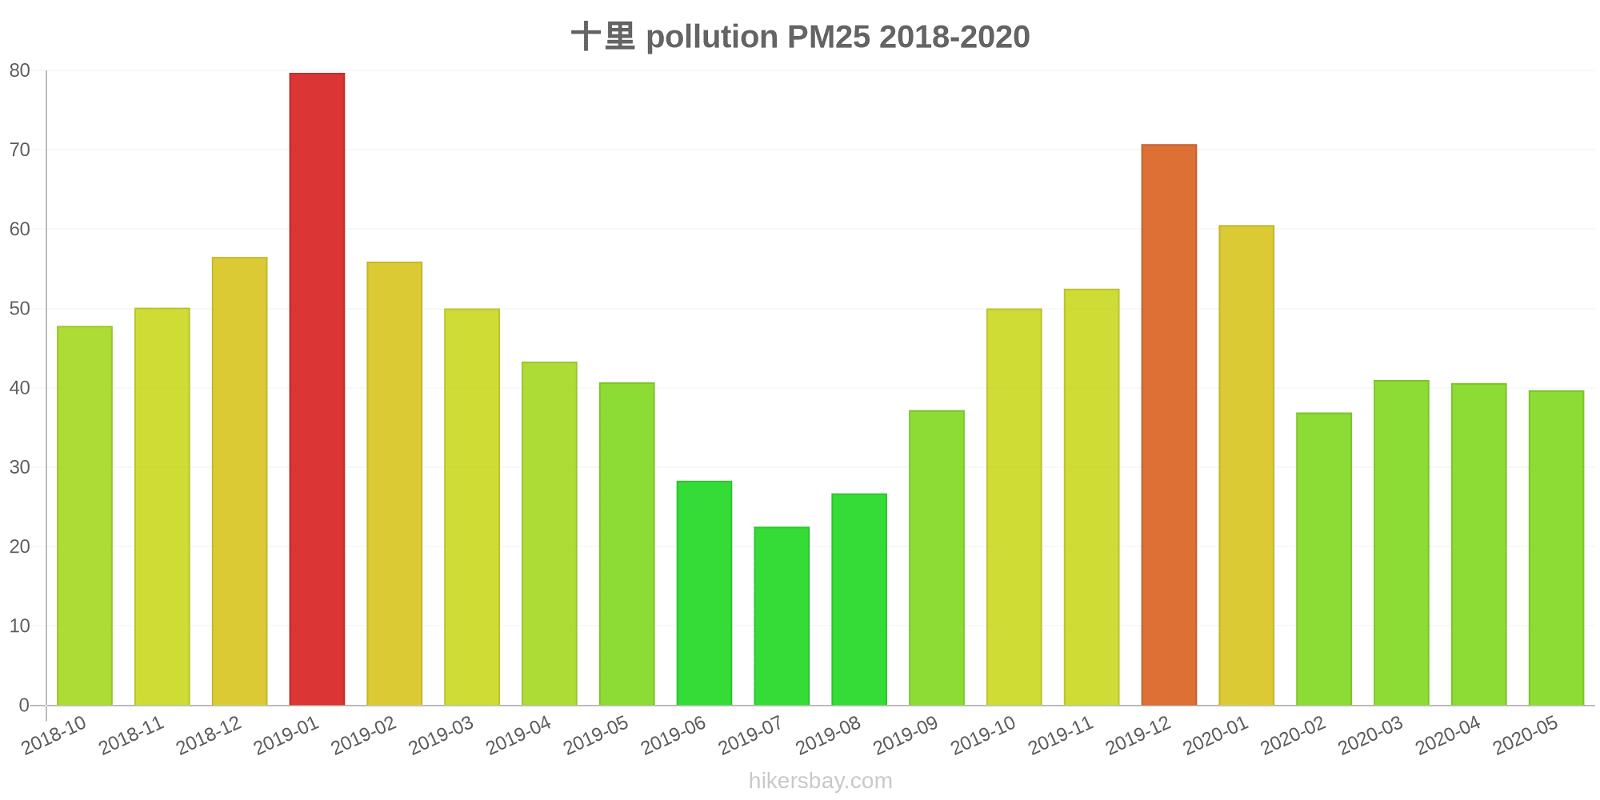
十里
Friday, May 27, 2022, 12:00 PM
PM10 179 (Very bad Hazardous)
particulate matter (PM10) suspended dust
PM2,5 35 (Unhealthy for Sensitive Groups)
particulate matter (PM2.5) dust
O3 0.04 (Good)
ozone (O3)
NO2 0 (Good)
nitrogen dioxide (NO2)
SO2 0 (Good)
sulfur dioxide (SO2)
十里
index
2022-05-27
pm10
56
pm25
56
o3
0.03
no2
0
so2
0
十里
2018-10 2020-05
index
2020-05
2020-04
2020-03
2020-02
2020-01
2019-12
2019-11
2019-10
2019-09
2019-08
2019-07
2019-06
2019-05
2019-04
2019-03
2019-02
2019-01
2018-12
2018-11
2018-10
pm25
40
41
41
37
61
71
53
50
37
27
23
28
41
43
50
56
80
57
50
48
co
765
665
560
578
714
748
700
673
551
625
593
532
640
682
623
825
932
860
627
631
no2
29
41
32
17
29
50
49
38
28
20
22
22
30
27
32
24
36
33
41
45
o3
131
147
97
86
60
65
97
124
163
151
120
137
128
91
83
50
54
46
70
103
pm10
64
74
62
46
69
86
96
83
70
58
48
50
84
70
78
68
104
84
81
94
so2
12
14
11
8
9.7
13
14
13
9.9
8.9
8.8
11
16
9.9
11
7.2
12
12
13
12
* Pollution data source:
https://openaq.org
(ChinaAQIData)
The data is licensed under CC-By 4.0
PM10 179 (Very bad Hazardous)
PM2,5 35 (Unhealthy for Sensitive Groups)
O3 0 (Good)
NO2 0 (Good)
SO2 0 (Good)
Data on air pollution from recent days in Lushanqu
| index | 2022-05-27 |
|---|---|
| pm10 | 56 Unhealthy for Sensitive Groups |
| pm25 | 56 Unhealthy |
| o3 | 0 Good |
| no2 | 0 Good |
| so2 | 0 Good |

| index | 2020-05 | 2020-04 | 2020-03 | 2020-02 | 2020-01 | 2019-12 | 2019-11 | 2019-10 | 2019-09 | 2019-08 | 2019-07 | 2019-06 | 2019-05 | 2019-04 | 2019-03 | 2019-02 | 2019-01 | 2018-12 | 2018-11 | 2018-10 |
|---|---|---|---|---|---|---|---|---|---|---|---|---|---|---|---|---|---|---|---|---|
| pm25 | 40 (Unhealthy for Sensitive Groups) | 41 (Unhealthy for Sensitive Groups) | 41 (Unhealthy for Sensitive Groups) | 37 (Unhealthy for Sensitive Groups) | 61 (Unhealthy) | 71 (Unhealthy) | 53 (Unhealthy for Sensitive Groups) | 50 (Unhealthy for Sensitive Groups) | 37 (Unhealthy for Sensitive Groups) | 27 (Moderate) | 23 (Moderate) | 28 (Moderate) | 41 (Unhealthy for Sensitive Groups) | 43 (Unhealthy for Sensitive Groups) | 50 (Unhealthy for Sensitive Groups) | 56 (Unhealthy) | 80 (Very Unhealthy) | 57 (Unhealthy) | 50 (Unhealthy for Sensitive Groups) | 48 (Unhealthy for Sensitive Groups) |
| co | 765 (Good) | 665 (Good) | 560 (Good) | 578 (Good) | 714 (Good) | 748 (Good) | 700 (Good) | 673 (Good) | 551 (Good) | 625 (Good) | 593 (Good) | 532 (Good) | 640 (Good) | 682 (Good) | 623 (Good) | 825 (Good) | 932 (Good) | 860 (Good) | 627 (Good) | 631 (Good) |
| no2 | 29 (Good) | 41 (Moderate) | 32 (Good) | 17 (Good) | 29 (Good) | 50 (Moderate) | 49 (Moderate) | 38 (Good) | 28 (Good) | 20 (Good) | 22 (Good) | 22 (Good) | 30 (Good) | 27 (Good) | 32 (Good) | 24 (Good) | 36 (Good) | 33 (Good) | 41 (Moderate) | 45 (Moderate) |
| o3 | 131 (Unhealthy for Sensitive Groups) | 147 (Unhealthy for Sensitive Groups) | 97 (Moderate) | 86 (Moderate) | 60 (Good) | 65 (Good) | 97 (Moderate) | 124 (Unhealthy for Sensitive Groups) | 163 (Unhealthy) | 151 (Unhealthy) | 120 (Unhealthy for Sensitive Groups) | 137 (Unhealthy for Sensitive Groups) | 128 (Unhealthy for Sensitive Groups) | 91 (Moderate) | 83 (Moderate) | 50 (Good) | 54 (Good) | 46 (Good) | 70 (Good) | 103 (Moderate) |
| pm10 | 64 (Unhealthy for Sensitive Groups) | 74 (Unhealthy for Sensitive Groups) | 62 (Unhealthy for Sensitive Groups) | 46 (Moderate) | 69 (Unhealthy for Sensitive Groups) | 86 (Unhealthy) | 96 (Unhealthy) | 83 (Unhealthy) | 70 (Unhealthy for Sensitive Groups) | 58 (Unhealthy for Sensitive Groups) | 48 (Moderate) | 50 (Unhealthy for Sensitive Groups) | 84 (Unhealthy) | 70 (Unhealthy for Sensitive Groups) | 78 (Unhealthy for Sensitive Groups) | 68 (Unhealthy for Sensitive Groups) | 104 (Unhealthy) | 84 (Unhealthy) | 81 (Unhealthy) | 94 (Unhealthy) |
| so2 | 12 (Good) | 14 (Good) | 11 (Good) | 8 (Good) | 9.7 (Good) | 13 (Good) | 14 (Good) | 13 (Good) | 9.9 (Good) | 8.9 (Good) | 8.8 (Good) | 11 (Good) | 16 (Good) | 9.9 (Good) | 11 (Good) | 7.2 (Good) | 12 (Good) | 12 (Good) | 13 (Good) | 12 (Good) |
PM10 179 (Very bad Hazardous)
particulate matter (PM10) suspended dustPM2,5 35 (Unhealthy for Sensitive Groups)
particulate matter (PM2.5) dustO3 0.04 (Good)
ozone (O3)NO2 0 (Good)
nitrogen dioxide (NO2)SO2 0 (Good)
sulfur dioxide (SO2)十里
| index | 2022-05-27 |
|---|---|
| pm10 | 56 |
| pm25 | 56 |
| o3 | 0.03 |
| no2 | 0 |
| so2 | 0 |
十里

| index | 2020-05 | 2020-04 | 2020-03 | 2020-02 | 2020-01 | 2019-12 | 2019-11 | 2019-10 | 2019-09 | 2019-08 | 2019-07 | 2019-06 | 2019-05 | 2019-04 | 2019-03 | 2019-02 | 2019-01 | 2018-12 | 2018-11 | 2018-10 |
|---|---|---|---|---|---|---|---|---|---|---|---|---|---|---|---|---|---|---|---|---|
| pm25 | 40 | 41 | 41 | 37 | 61 | 71 | 53 | 50 | 37 | 27 | 23 | 28 | 41 | 43 | 50 | 56 | 80 | 57 | 50 | 48 |
| co | 765 | 665 | 560 | 578 | 714 | 748 | 700 | 673 | 551 | 625 | 593 | 532 | 640 | 682 | 623 | 825 | 932 | 860 | 627 | 631 |
| no2 | 29 | 41 | 32 | 17 | 29 | 50 | 49 | 38 | 28 | 20 | 22 | 22 | 30 | 27 | 32 | 24 | 36 | 33 | 41 | 45 |
| o3 | 131 | 147 | 97 | 86 | 60 | 65 | 97 | 124 | 163 | 151 | 120 | 137 | 128 | 91 | 83 | 50 | 54 | 46 | 70 | 103 |
| pm10 | 64 | 74 | 62 | 46 | 69 | 86 | 96 | 83 | 70 | 58 | 48 | 50 | 84 | 70 | 78 | 68 | 104 | 84 | 81 | 94 |
| so2 | 12 | 14 | 11 | 8 | 9.7 | 13 | 14 | 13 | 9.9 | 8.9 | 8.8 | 11 | 16 | 9.9 | 11 | 7.2 | 12 | 12 | 13 | 12 |