Air Pollution in Zhangjialong: Real-time Air Quality Index and smog alert.
Pollution and air quality forecast for Zhangjialong. Today is Tuesday, June 2, 2026. The following air pollution values have been recorded for Zhangjialong:- particulate matter (PM10) suspended dust - 179 (Very bad Hazardous)
- particulate matter (PM2.5) dust - 35 (Unhealthy for Sensitive Groups)
- ozone (O3) - 0 (Good)
- nitrogen dioxide (NO2) - 0 (Good)
- sulfur dioxide (SO2) - 0 (Good)

What is the air quality in Zhangjialong today? Is the air polluted in Zhangjialong?. Is there smog?
What is the level of PM10 today in Zhangjialong? (particulate matter (PM10) suspended dust)
The current level of particulate matter PM10 in Zhangjialong is:
179 (Very bad Hazardous)
The highest PM10 values usually occur in month: 110 (January 2019).
The lowest value of particulate matter PM10 pollution in Zhangjialong is usually recorded in: July (43).
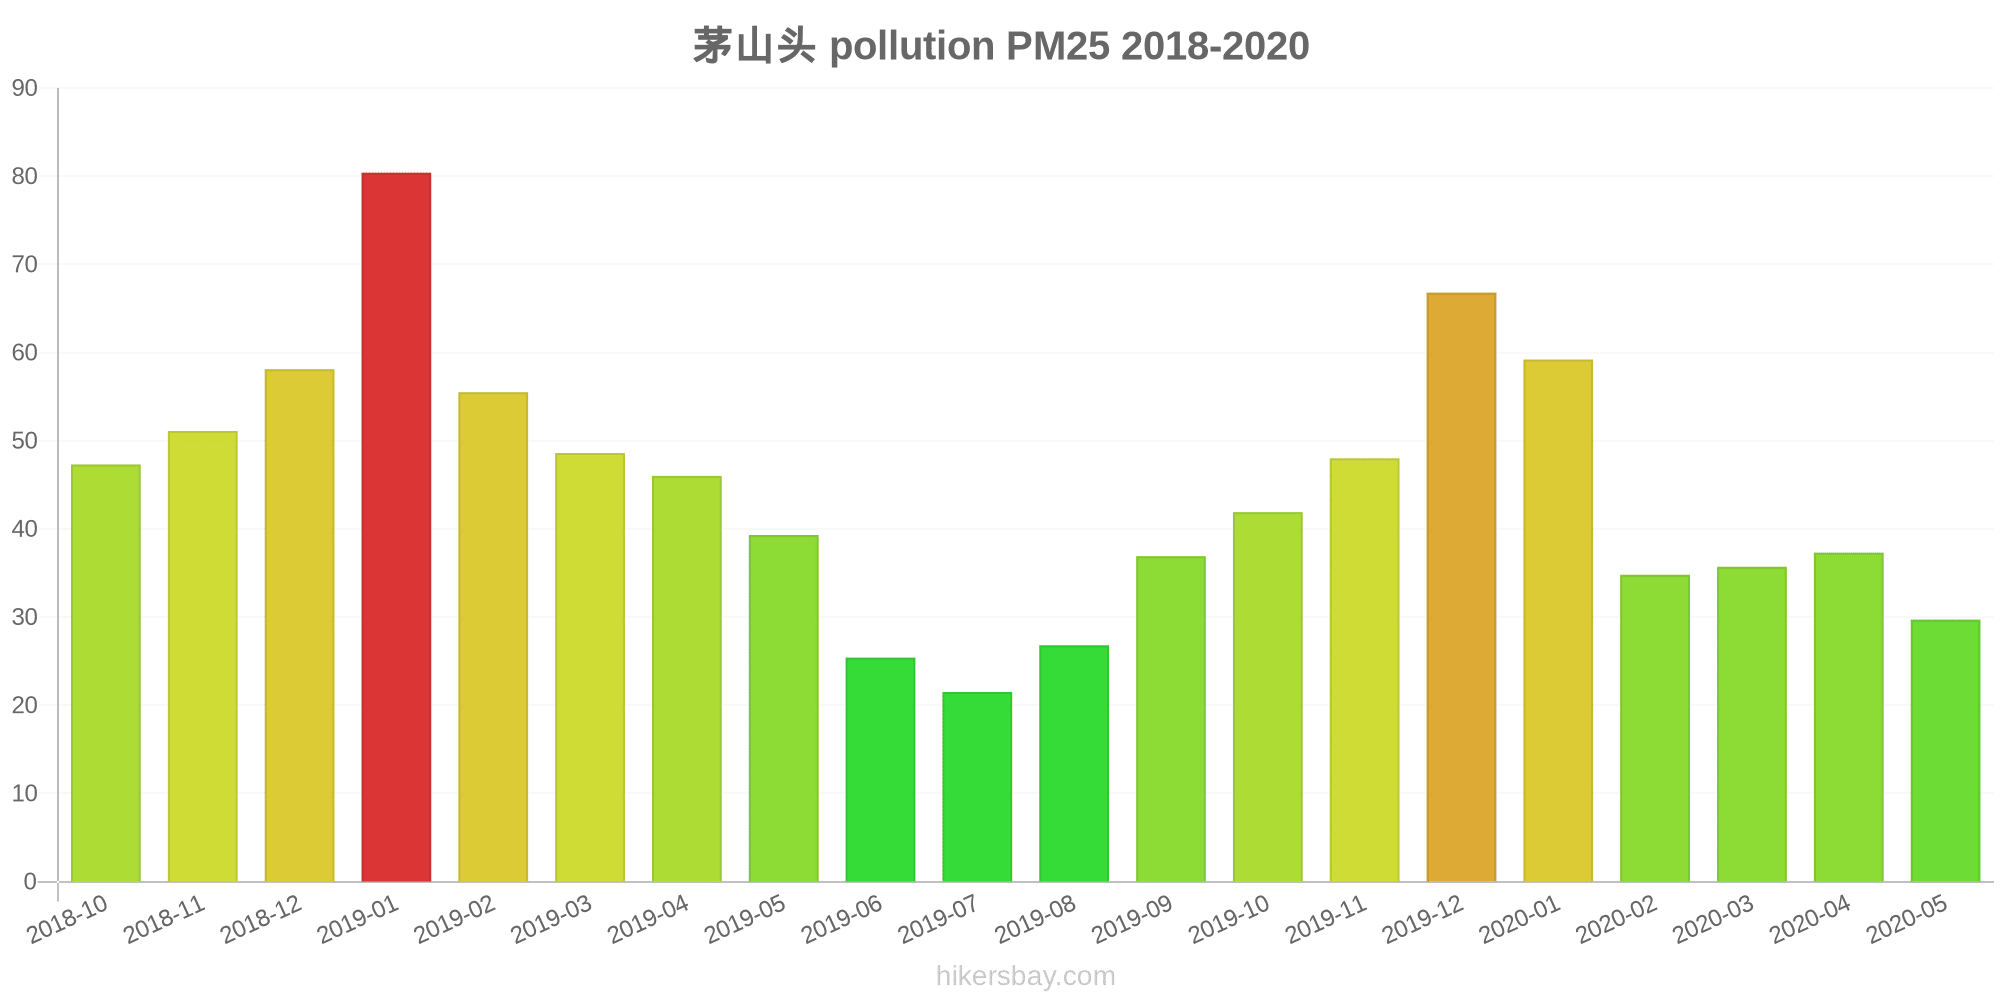
What is the current level of PM2.5 in Zhangjialong? (particulate matter (PM2.5) dust)
Today's PM2.5 level is:
35 (Unhealthy for Sensitive Groups)
For comparison, the highest level of PM2.5 in Zhangjialong in the last 7 days was: 56 (Friday, May 27, 2022) and the lowest: 56 (Friday, May 27, 2022).
The highest PM2.5 values were recorded: 80 (January 2019).
The lowest level of particulate matter PM2.5 pollution occurs in month: July (22).
How is the O3 level today in Zhangjialong? (ozone (O3))
0 (Good)
How high is the level of NO2? (nitrogen dioxide (NO2))
0 (Good)
What is the level of SO2 pollution? (sulfur dioxide (SO2))
0 (Good)
Current data Friday, May 27, 2022, 12:00 PM
PM10 179 (Very bad Hazardous)
PM2,5 35 (Unhealthy for Sensitive Groups)
O3 0 (Good)
NO2 0 (Good)
SO2 0 (Good)
Data on air pollution from recent days in Zhangjialong
index
2022-05-27
pm10
56
Unhealthy for Sensitive Groups
pm25
56
Unhealthy
o3
0
Good
no2
0
Good
so2
0
Good
data source »
Air pollution in Zhangjialong from October 2018 to May 2020

index
2020-05
2020-04
2020-03
2020-02
2020-01
2019-12
2019-11
2019-10
2019-09
2019-08
2019-07
2019-06
2019-05
2019-04
2019-03
2019-02
2019-01
2018-12
2018-11
2018-10
pm25
30 (Moderate)
37 (Unhealthy for Sensitive Groups)
36 (Unhealthy for Sensitive Groups)
35 (Moderate)
59 (Unhealthy)
67 (Unhealthy)
48 (Unhealthy for Sensitive Groups)
42 (Unhealthy for Sensitive Groups)
37 (Unhealthy for Sensitive Groups)
27 (Moderate)
22 (Moderate)
25 (Moderate)
39 (Unhealthy for Sensitive Groups)
46 (Unhealthy for Sensitive Groups)
49 (Unhealthy for Sensitive Groups)
56 (Unhealthy)
80 (Very Unhealthy)
58 (Unhealthy)
51 (Unhealthy for Sensitive Groups)
47 (Unhealthy for Sensitive Groups)
co
648 (Good)
619 (Good)
485 (Good)
582 (Good)
774 (Good)
837 (Good)
695 (Good)
613 (Good)
632 (Good)
706 (Good)
466 (Good)
429 (Good)
543 (Good)
581 (Good)
530 (Good)
706 (Good)
731 (Good)
848 (Good)
824 (Good)
826 (Good)
no2
27 (Good)
39 (Good)
30 (Good)
17 (Good)
29 (Good)
49 (Moderate)
47 (Moderate)
36 (Good)
22 (Good)
18 (Good)
20 (Good)
25 (Good)
33 (Good)
36 (Good)
39 (Good)
28 (Good)
45 (Moderate)
33 (Good)
39 (Good)
48 (Moderate)
o3
128 (Unhealthy for Sensitive Groups)
135 (Unhealthy for Sensitive Groups)
88 (Moderate)
82 (Moderate)
55 (Good)
62 (Good)
101 (Moderate)
126 (Unhealthy for Sensitive Groups)
162 (Unhealthy)
162 (Unhealthy)
126 (Unhealthy for Sensitive Groups)
146 (Unhealthy for Sensitive Groups)
114 (Moderate)
89 (Moderate)
88 (Moderate)
56 (Good)
54 (Good)
53 (Good)
73 (Moderate)
108 (Moderate)
pm10
59 (Unhealthy for Sensitive Groups)
70 (Unhealthy for Sensitive Groups)
59 (Unhealthy for Sensitive Groups)
44 (Moderate)
65 (Unhealthy for Sensitive Groups)
75 (Unhealthy for Sensitive Groups)
76 (Unhealthy for Sensitive Groups)
69 (Unhealthy for Sensitive Groups)
55 (Unhealthy for Sensitive Groups)
49 (Moderate)
43 (Moderate)
43 (Moderate)
68 (Unhealthy for Sensitive Groups)
66 (Unhealthy for Sensitive Groups)
79 (Unhealthy for Sensitive Groups)
67 (Unhealthy for Sensitive Groups)
110 (Very Unhealthy)
76 (Unhealthy for Sensitive Groups)
75 (Unhealthy for Sensitive Groups)
92 (Unhealthy)
so2
11 (Good)
11 (Good)
9.4 (Good)
8.9 (Good)
9 (Good)
10 (Good)
12 (Good)
12 (Good)
10 (Good)
9.8 (Good)
9.2 (Good)
9.5 (Good)
11 (Good)
10 (Good)
9.9 (Good)
9.7 (Good)
11 (Good)
11 (Good)
11 (Good)
15 (Good)
data source »
茅山头
Friday, May 27, 2022, 12:00 PM
PM10 179 (Very bad Hazardous)
particulate matter (PM10) suspended dust
PM2,5 35 (Unhealthy for Sensitive Groups)
particulate matter (PM2.5) dust
O3 0.04 (Good)
ozone (O3)
NO2 0 (Good)
nitrogen dioxide (NO2)
SO2 0 (Good)
sulfur dioxide (SO2)
茅山头
index
2022-05-27
pm10
56
pm25
56
o3
0.03
no2
0
so2
0
茅山头
2018-10 2020-05

index
2020-05
2020-04
2020-03
2020-02
2020-01
2019-12
2019-11
2019-10
2019-09
2019-08
2019-07
2019-06
2019-05
2019-04
2019-03
2019-02
2019-01
2018-12
2018-11
2018-10
pm25
30
37
36
35
59
67
48
42
37
27
22
25
39
46
49
56
80
58
51
47
co
648
619
485
582
774
837
695
613
632
706
466
429
543
581
530
706
731
848
824
826
no2
27
39
30
17
29
49
47
36
22
18
20
25
33
36
39
28
45
33
39
48
o3
128
135
88
82
55
62
101
126
162
162
126
146
114
89
88
56
54
53
73
108
pm10
59
70
59
44
65
75
76
69
55
49
43
43
68
66
79
67
110
76
75
92
so2
11
11
9.4
8.9
9
10
12
12
10
9.8
9.2
9.5
11
10
9.9
9.7
11
11
11
15
* Pollution data source:
https://openaq.org
(ChinaAQIData)
The data is licensed under CC-By 4.0
PM10 179 (Very bad Hazardous)
PM2,5 35 (Unhealthy for Sensitive Groups)
O3 0 (Good)
NO2 0 (Good)
SO2 0 (Good)
Data on air pollution from recent days in Zhangjialong
| index | 2022-05-27 |
|---|---|
| pm10 | 56 Unhealthy for Sensitive Groups |
| pm25 | 56 Unhealthy |
| o3 | 0 Good |
| no2 | 0 Good |
| so2 | 0 Good |

| index | 2020-05 | 2020-04 | 2020-03 | 2020-02 | 2020-01 | 2019-12 | 2019-11 | 2019-10 | 2019-09 | 2019-08 | 2019-07 | 2019-06 | 2019-05 | 2019-04 | 2019-03 | 2019-02 | 2019-01 | 2018-12 | 2018-11 | 2018-10 |
|---|---|---|---|---|---|---|---|---|---|---|---|---|---|---|---|---|---|---|---|---|
| pm25 | 30 (Moderate) | 37 (Unhealthy for Sensitive Groups) | 36 (Unhealthy for Sensitive Groups) | 35 (Moderate) | 59 (Unhealthy) | 67 (Unhealthy) | 48 (Unhealthy for Sensitive Groups) | 42 (Unhealthy for Sensitive Groups) | 37 (Unhealthy for Sensitive Groups) | 27 (Moderate) | 22 (Moderate) | 25 (Moderate) | 39 (Unhealthy for Sensitive Groups) | 46 (Unhealthy for Sensitive Groups) | 49 (Unhealthy for Sensitive Groups) | 56 (Unhealthy) | 80 (Very Unhealthy) | 58 (Unhealthy) | 51 (Unhealthy for Sensitive Groups) | 47 (Unhealthy for Sensitive Groups) |
| co | 648 (Good) | 619 (Good) | 485 (Good) | 582 (Good) | 774 (Good) | 837 (Good) | 695 (Good) | 613 (Good) | 632 (Good) | 706 (Good) | 466 (Good) | 429 (Good) | 543 (Good) | 581 (Good) | 530 (Good) | 706 (Good) | 731 (Good) | 848 (Good) | 824 (Good) | 826 (Good) |
| no2 | 27 (Good) | 39 (Good) | 30 (Good) | 17 (Good) | 29 (Good) | 49 (Moderate) | 47 (Moderate) | 36 (Good) | 22 (Good) | 18 (Good) | 20 (Good) | 25 (Good) | 33 (Good) | 36 (Good) | 39 (Good) | 28 (Good) | 45 (Moderate) | 33 (Good) | 39 (Good) | 48 (Moderate) |
| o3 | 128 (Unhealthy for Sensitive Groups) | 135 (Unhealthy for Sensitive Groups) | 88 (Moderate) | 82 (Moderate) | 55 (Good) | 62 (Good) | 101 (Moderate) | 126 (Unhealthy for Sensitive Groups) | 162 (Unhealthy) | 162 (Unhealthy) | 126 (Unhealthy for Sensitive Groups) | 146 (Unhealthy for Sensitive Groups) | 114 (Moderate) | 89 (Moderate) | 88 (Moderate) | 56 (Good) | 54 (Good) | 53 (Good) | 73 (Moderate) | 108 (Moderate) |
| pm10 | 59 (Unhealthy for Sensitive Groups) | 70 (Unhealthy for Sensitive Groups) | 59 (Unhealthy for Sensitive Groups) | 44 (Moderate) | 65 (Unhealthy for Sensitive Groups) | 75 (Unhealthy for Sensitive Groups) | 76 (Unhealthy for Sensitive Groups) | 69 (Unhealthy for Sensitive Groups) | 55 (Unhealthy for Sensitive Groups) | 49 (Moderate) | 43 (Moderate) | 43 (Moderate) | 68 (Unhealthy for Sensitive Groups) | 66 (Unhealthy for Sensitive Groups) | 79 (Unhealthy for Sensitive Groups) | 67 (Unhealthy for Sensitive Groups) | 110 (Very Unhealthy) | 76 (Unhealthy for Sensitive Groups) | 75 (Unhealthy for Sensitive Groups) | 92 (Unhealthy) |
| so2 | 11 (Good) | 11 (Good) | 9.4 (Good) | 8.9 (Good) | 9 (Good) | 10 (Good) | 12 (Good) | 12 (Good) | 10 (Good) | 9.8 (Good) | 9.2 (Good) | 9.5 (Good) | 11 (Good) | 10 (Good) | 9.9 (Good) | 9.7 (Good) | 11 (Good) | 11 (Good) | 11 (Good) | 15 (Good) |
PM10 179 (Very bad Hazardous)
particulate matter (PM10) suspended dustPM2,5 35 (Unhealthy for Sensitive Groups)
particulate matter (PM2.5) dustO3 0.04 (Good)
ozone (O3)NO2 0 (Good)
nitrogen dioxide (NO2)SO2 0 (Good)
sulfur dioxide (SO2)茅山头
| index | 2022-05-27 |
|---|---|
| pm10 | 56 |
| pm25 | 56 |
| o3 | 0.03 |
| no2 | 0 |
| so2 | 0 |
茅山头
| index | 2020-05 | 2020-04 | 2020-03 | 2020-02 | 2020-01 | 2019-12 | 2019-11 | 2019-10 | 2019-09 | 2019-08 | 2019-07 | 2019-06 | 2019-05 | 2019-04 | 2019-03 | 2019-02 | 2019-01 | 2018-12 | 2018-11 | 2018-10 |
|---|---|---|---|---|---|---|---|---|---|---|---|---|---|---|---|---|---|---|---|---|
| pm25 | 30 | 37 | 36 | 35 | 59 | 67 | 48 | 42 | 37 | 27 | 22 | 25 | 39 | 46 | 49 | 56 | 80 | 58 | 51 | 47 |
| co | 648 | 619 | 485 | 582 | 774 | 837 | 695 | 613 | 632 | 706 | 466 | 429 | 543 | 581 | 530 | 706 | 731 | 848 | 824 | 826 |
| no2 | 27 | 39 | 30 | 17 | 29 | 49 | 47 | 36 | 22 | 18 | 20 | 25 | 33 | 36 | 39 | 28 | 45 | 33 | 39 | 48 |
| o3 | 128 | 135 | 88 | 82 | 55 | 62 | 101 | 126 | 162 | 162 | 126 | 146 | 114 | 89 | 88 | 56 | 54 | 53 | 73 | 108 |
| pm10 | 59 | 70 | 59 | 44 | 65 | 75 | 76 | 69 | 55 | 49 | 43 | 43 | 68 | 66 | 79 | 67 | 110 | 76 | 75 | 92 |
| so2 | 11 | 11 | 9.4 | 8.9 | 9 | 10 | 12 | 12 | 10 | 9.8 | 9.2 | 9.5 | 11 | 10 | 9.9 | 9.7 | 11 | 11 | 11 | 15 |