Air Pollution in Chenjialing: Real-time Air Quality Index and smog alert.
Pollution and air quality forecast for Chenjialing. Today is Tuesday, June 2, 2026. The following air pollution values have been recorded for Chenjialing:- particulate matter (PM10) suspended dust - 179 (Very bad Hazardous)
- particulate matter (PM2.5) dust - 35 (Unhealthy for Sensitive Groups)
- ozone (O3) - 0 (Good)
- nitrogen dioxide (NO2) - 0 (Good)
- sulfur dioxide (SO2) - 0 (Good)

What is the air quality in Chenjialing today? Is the air polluted in Chenjialing?. Is there smog?
What is the level of PM10 today in Chenjialing? (particulate matter (PM10) suspended dust)
The current level of particulate matter PM10 in Chenjialing is:
179 (Very bad Hazardous)
The highest PM10 values usually occur in month: 42 (October 2019).
The lowest value of particulate matter PM10 pollution in Chenjialing is usually recorded in: February (11).
What is the current level of PM2.5 in Chenjialing? (particulate matter (PM2.5) dust)
Today's PM2.5 level is:
35 (Unhealthy for Sensitive Groups)
For comparison, the highest level of PM2.5 in Chenjialing in the last 7 days was: 56 (Friday, May 27, 2022) and the lowest: 56 (Friday, May 27, 2022).
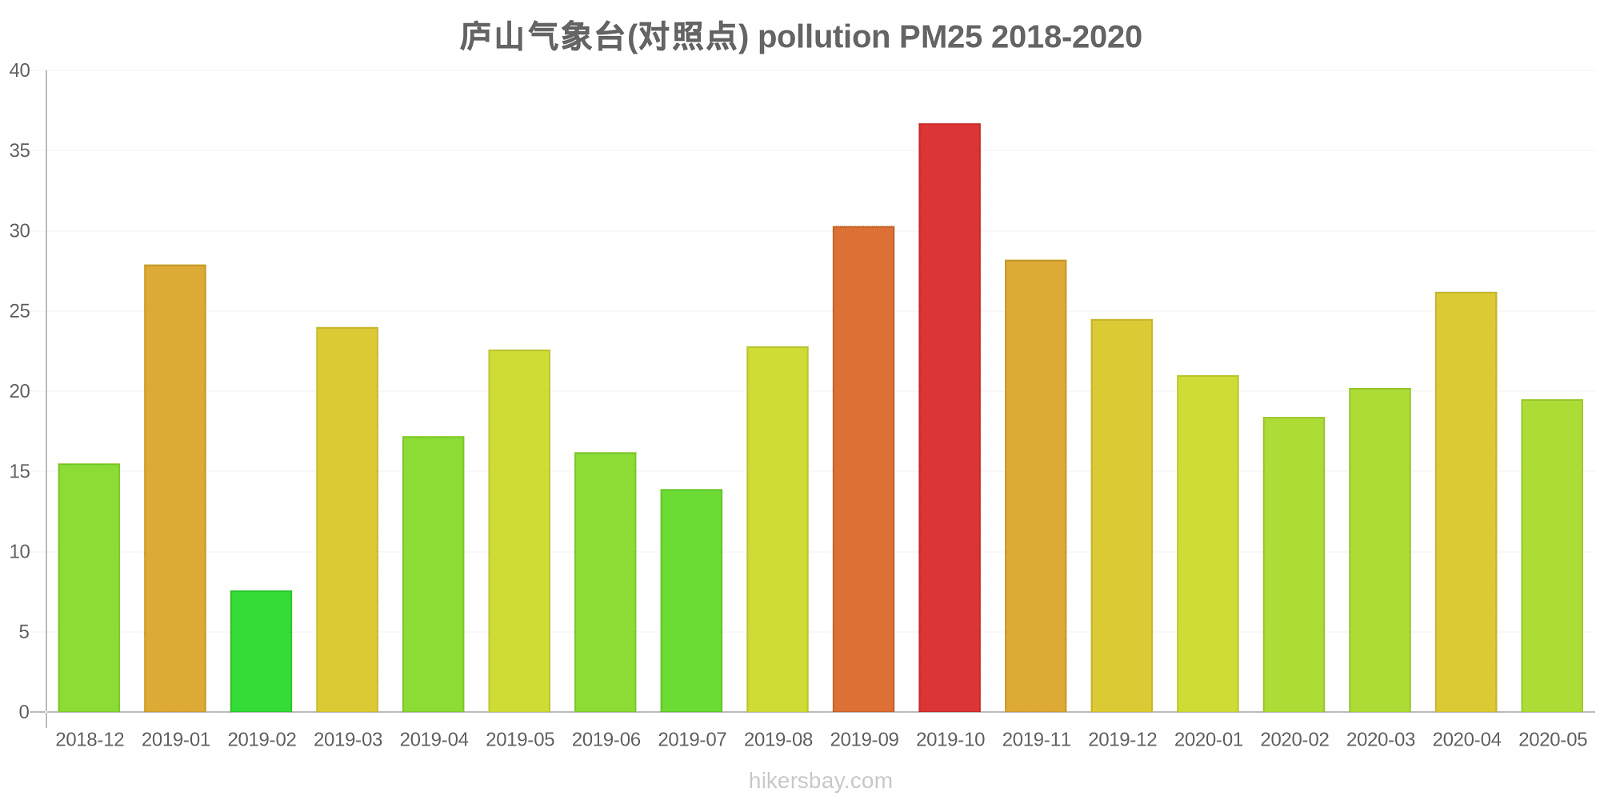
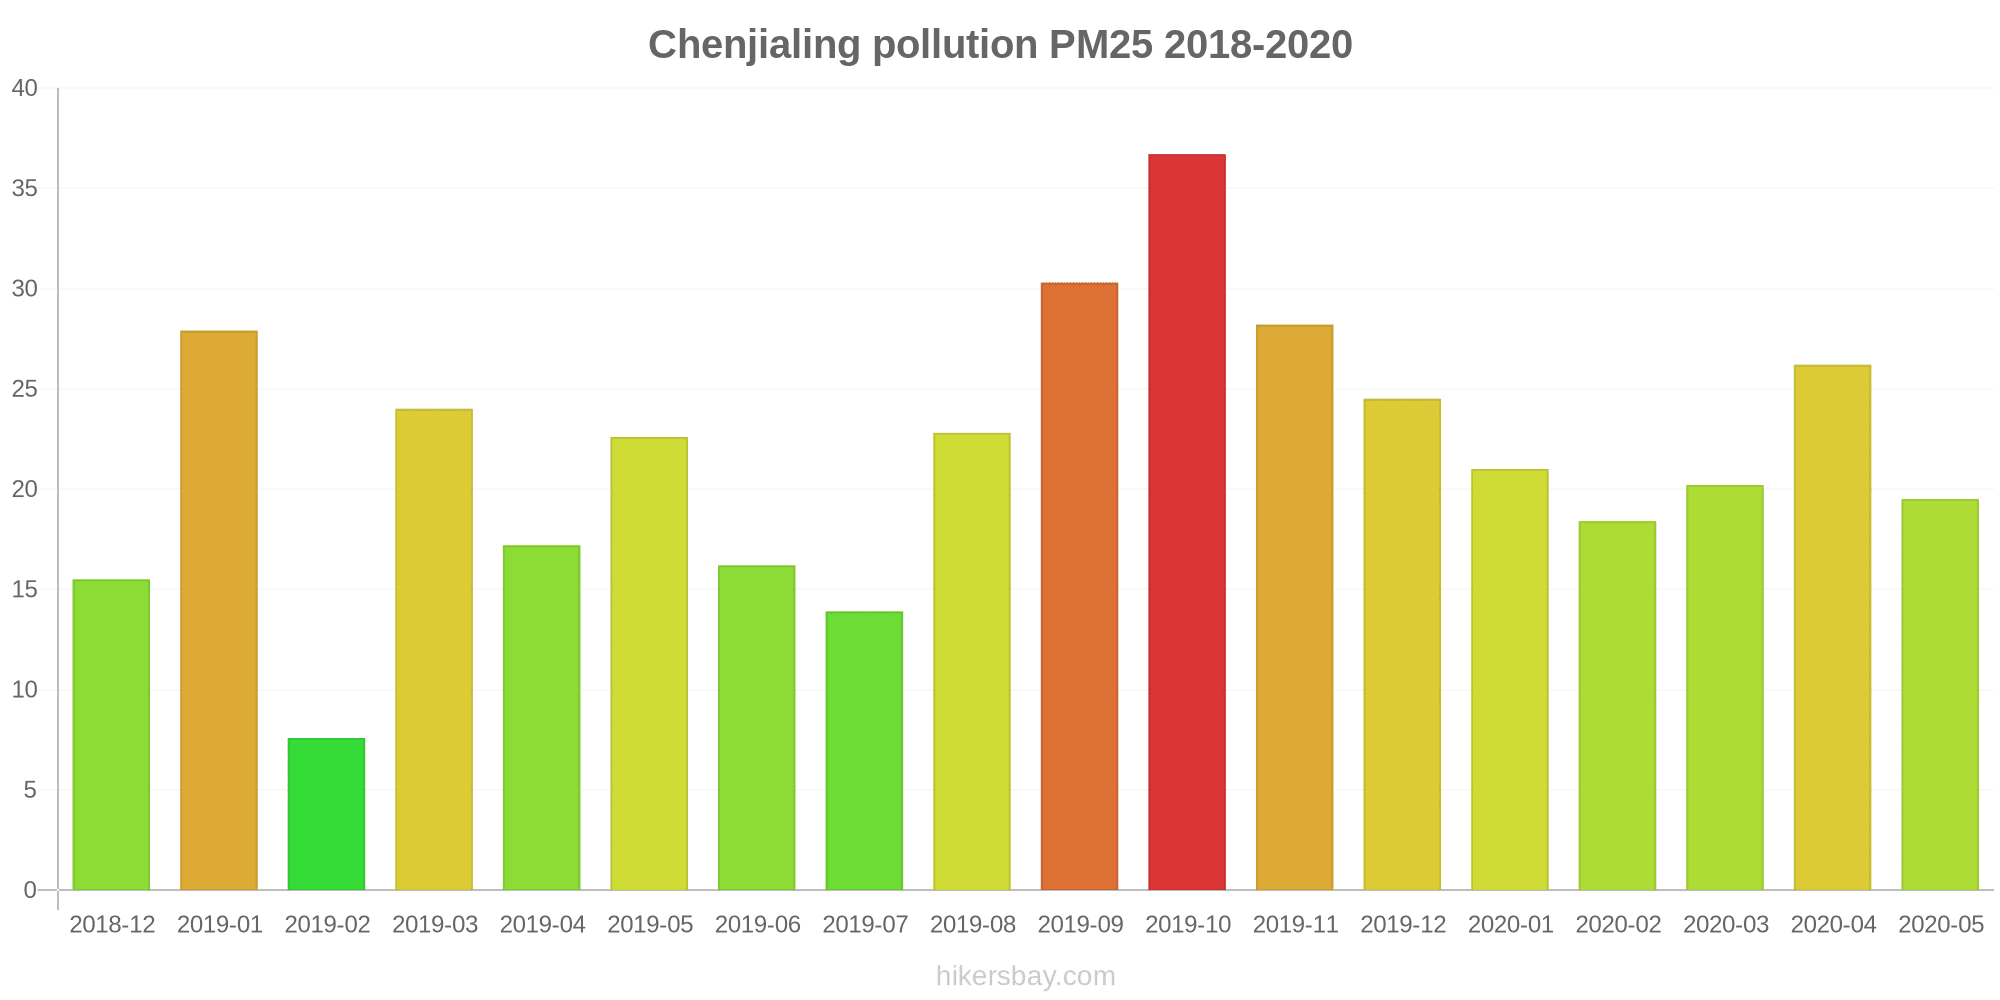
The highest PM2.5 values were recorded: 37 (October 2019).
The lowest level of particulate matter PM2.5 pollution occurs in month: February (7.6).
How is the O3 level today in Chenjialing? (ozone (O3))
0 (Good)
How high is the level of NO2? (nitrogen dioxide (NO2))
0 (Good)
What is the level of SO2 pollution? (sulfur dioxide (SO2))
0 (Good)
Current data Friday, May 27, 2022, 12:00 PM
PM10 179 (Very bad Hazardous)
PM2,5 35 (Unhealthy for Sensitive Groups)
O3 0 (Good)
NO2 0 (Good)
SO2 0 (Good)
Data on air pollution from recent days in Chenjialing
index
2022-05-27
pm10
56
Unhealthy for Sensitive Groups
pm25
56
Unhealthy
o3
0
Good
no2
0
Good
so2
0
Good
data source »
Air pollution in Chenjialing from December 2018 to May 2020

index
2020-05
2020-04
2020-03
2020-02
2020-01
2019-12
2019-11
2019-10
2019-09
2019-08
2019-07
2019-06
2019-05
2019-04
2019-03
2019-02
2019-01
2018-12
pm25
20 (Moderate)
26 (Moderate)
20 (Moderate)
18 (Moderate)
21 (Moderate)
25 (Moderate)
28 (Moderate)
37 (Unhealthy for Sensitive Groups)
30 (Moderate)
23 (Moderate)
14 (Moderate)
16 (Moderate)
23 (Moderate)
17 (Moderate)
24 (Moderate)
7.6 (Good)
28 (Moderate)
16 (Moderate)
co
475 (Good)
333 (Good)
455 (Good)
351 (Good)
595 (Good)
359 (Good)
389 (Good)
364 (Good)
435 (Good)
539 (Good)
408 (Good)
412 (Good)
457 (Good)
525 (Good)
415 (Good)
806 (Good)
746 (Good)
594 (Good)
no2
9.8 (Good)
8.7 (Good)
5.5 (Good)
4.3 (Good)
6.5 (Good)
8.9 (Good)
8.9 (Good)
6.6 (Good)
4.8 (Good)
5 (Good)
4.8 (Good)
3.5 (Good)
7 (Good)
7.1 (Good)
2.6 (Good)
1.9 (Good)
5.1 (Good)
9.6 (Good)
o3
142 (Unhealthy for Sensitive Groups)
151 (Unhealthy)
108 (Moderate)
94 (Moderate)
87 (Moderate)
91 (Moderate)
117 (Moderate)
140 (Unhealthy for Sensitive Groups)
168 (Unhealthy)
148 (Unhealthy for Sensitive Groups)
123 (Unhealthy for Sensitive Groups)
147 (Unhealthy for Sensitive Groups)
152 (Unhealthy)
134 (Unhealthy for Sensitive Groups)
126 (Unhealthy for Sensitive Groups)
77 (Moderate)
100 (Moderate)
85 (Moderate)
pm10
25 (Moderate)
33 (Moderate)
24 (Moderate)
14 (Good)
17 (Good)
26 (Moderate)
39 (Moderate)
42 (Moderate)
35 (Moderate)
32 (Moderate)
21 (Moderate)
23 (Moderate)
42 (Moderate)
25 (Moderate)
33 (Moderate)
11 (Good)
22 (Moderate)
13 (Good)
so2
13 (Good)
11 (Good)
6.5 (Good)
2.9 (Good)
3.3 (Good)
4.7 (Good)
7.5 (Good)
11 (Good)
6.5 (Good)
2.7 (Good)
1.6 (Good)
2.2 (Good)
7.8 (Good)
8 (Good)
2.5 (Good)
19 (Good)
15 (Good)
15 (Good)
data source »
庐山气象台(对照点)
Friday, May 27, 2022, 12:00 PM
PM10 179 (Very bad Hazardous)
particulate matter (PM10) suspended dust
PM2,5 35 (Unhealthy for Sensitive Groups)
particulate matter (PM2.5) dust
O3 0.04 (Good)
ozone (O3)
NO2 0 (Good)
nitrogen dioxide (NO2)
SO2 0 (Good)
sulfur dioxide (SO2)
庐山气象台(对照点)
index
2022-05-27
pm10
56
pm25
56
o3
0.03
no2
0
so2
0
庐山气象台(对照点)
2018-12 2020-05
index
2020-05
2020-04
2020-03
2020-02
2020-01
2019-12
2019-11
2019-10
2019-09
2019-08
2019-07
2019-06
2019-05
2019-04
2019-03
2019-02
2019-01
2018-12
pm25
20
26
20
18
21
25
28
37
30
23
14
16
23
17
24
7.6
28
16
co
475
333
455
351
595
359
389
364
435
539
408
412
457
525
415
806
746
594
no2
9.8
8.7
5.5
4.3
6.5
8.9
8.9
6.6
4.8
5
4.8
3.5
7
7.1
2.6
1.9
5.1
9.6
o3
142
151
108
94
87
91
117
140
168
148
123
147
152
134
126
77
100
85
so2
13
11
6.5
2.9
3.3
4.7
7.5
11
6.5
2.7
1.6
2.2
7.8
8
2.5
19
15
15
pm10
25
33
24
14
17
26
39
42
35
32
21
23
42
25
33
11
22
13
* Pollution data source:
https://openaq.org
(ChinaAQIData)
The data is licensed under CC-By 4.0
PM10 179 (Very bad Hazardous)
PM2,5 35 (Unhealthy for Sensitive Groups)
O3 0 (Good)
NO2 0 (Good)
SO2 0 (Good)
Data on air pollution from recent days in Chenjialing
| index | 2022-05-27 |
|---|---|
| pm10 | 56 Unhealthy for Sensitive Groups |
| pm25 | 56 Unhealthy |
| o3 | 0 Good |
| no2 | 0 Good |
| so2 | 0 Good |
| index | 2020-05 | 2020-04 | 2020-03 | 2020-02 | 2020-01 | 2019-12 | 2019-11 | 2019-10 | 2019-09 | 2019-08 | 2019-07 | 2019-06 | 2019-05 | 2019-04 | 2019-03 | 2019-02 | 2019-01 | 2018-12 |
|---|---|---|---|---|---|---|---|---|---|---|---|---|---|---|---|---|---|---|
| pm25 | 20 (Moderate) | 26 (Moderate) | 20 (Moderate) | 18 (Moderate) | 21 (Moderate) | 25 (Moderate) | 28 (Moderate) | 37 (Unhealthy for Sensitive Groups) | 30 (Moderate) | 23 (Moderate) | 14 (Moderate) | 16 (Moderate) | 23 (Moderate) | 17 (Moderate) | 24 (Moderate) | 7.6 (Good) | 28 (Moderate) | 16 (Moderate) |
| co | 475 (Good) | 333 (Good) | 455 (Good) | 351 (Good) | 595 (Good) | 359 (Good) | 389 (Good) | 364 (Good) | 435 (Good) | 539 (Good) | 408 (Good) | 412 (Good) | 457 (Good) | 525 (Good) | 415 (Good) | 806 (Good) | 746 (Good) | 594 (Good) |
| no2 | 9.8 (Good) | 8.7 (Good) | 5.5 (Good) | 4.3 (Good) | 6.5 (Good) | 8.9 (Good) | 8.9 (Good) | 6.6 (Good) | 4.8 (Good) | 5 (Good) | 4.8 (Good) | 3.5 (Good) | 7 (Good) | 7.1 (Good) | 2.6 (Good) | 1.9 (Good) | 5.1 (Good) | 9.6 (Good) |
| o3 | 142 (Unhealthy for Sensitive Groups) | 151 (Unhealthy) | 108 (Moderate) | 94 (Moderate) | 87 (Moderate) | 91 (Moderate) | 117 (Moderate) | 140 (Unhealthy for Sensitive Groups) | 168 (Unhealthy) | 148 (Unhealthy for Sensitive Groups) | 123 (Unhealthy for Sensitive Groups) | 147 (Unhealthy for Sensitive Groups) | 152 (Unhealthy) | 134 (Unhealthy for Sensitive Groups) | 126 (Unhealthy for Sensitive Groups) | 77 (Moderate) | 100 (Moderate) | 85 (Moderate) |
| pm10 | 25 (Moderate) | 33 (Moderate) | 24 (Moderate) | 14 (Good) | 17 (Good) | 26 (Moderate) | 39 (Moderate) | 42 (Moderate) | 35 (Moderate) | 32 (Moderate) | 21 (Moderate) | 23 (Moderate) | 42 (Moderate) | 25 (Moderate) | 33 (Moderate) | 11 (Good) | 22 (Moderate) | 13 (Good) |
| so2 | 13 (Good) | 11 (Good) | 6.5 (Good) | 2.9 (Good) | 3.3 (Good) | 4.7 (Good) | 7.5 (Good) | 11 (Good) | 6.5 (Good) | 2.7 (Good) | 1.6 (Good) | 2.2 (Good) | 7.8 (Good) | 8 (Good) | 2.5 (Good) | 19 (Good) | 15 (Good) | 15 (Good) |
PM10 179 (Very bad Hazardous)
particulate matter (PM10) suspended dustPM2,5 35 (Unhealthy for Sensitive Groups)
particulate matter (PM2.5) dustO3 0.04 (Good)
ozone (O3)NO2 0 (Good)
nitrogen dioxide (NO2)SO2 0 (Good)
sulfur dioxide (SO2)庐山气象台(对照点)
| index | 2022-05-27 |
|---|---|
| pm10 | 56 |
| pm25 | 56 |
| o3 | 0.03 |
| no2 | 0 |
| so2 | 0 |
庐山气象台(对照点)

| index | 2020-05 | 2020-04 | 2020-03 | 2020-02 | 2020-01 | 2019-12 | 2019-11 | 2019-10 | 2019-09 | 2019-08 | 2019-07 | 2019-06 | 2019-05 | 2019-04 | 2019-03 | 2019-02 | 2019-01 | 2018-12 |
|---|---|---|---|---|---|---|---|---|---|---|---|---|---|---|---|---|---|---|
| pm25 | 20 | 26 | 20 | 18 | 21 | 25 | 28 | 37 | 30 | 23 | 14 | 16 | 23 | 17 | 24 | 7.6 | 28 | 16 |
| co | 475 | 333 | 455 | 351 | 595 | 359 | 389 | 364 | 435 | 539 | 408 | 412 | 457 | 525 | 415 | 806 | 746 | 594 |
| no2 | 9.8 | 8.7 | 5.5 | 4.3 | 6.5 | 8.9 | 8.9 | 6.6 | 4.8 | 5 | 4.8 | 3.5 | 7 | 7.1 | 2.6 | 1.9 | 5.1 | 9.6 |
| o3 | 142 | 151 | 108 | 94 | 87 | 91 | 117 | 140 | 168 | 148 | 123 | 147 | 152 | 134 | 126 | 77 | 100 | 85 |
| so2 | 13 | 11 | 6.5 | 2.9 | 3.3 | 4.7 | 7.5 | 11 | 6.5 | 2.7 | 1.6 | 2.2 | 7.8 | 8 | 2.5 | 19 | 15 | 15 |
| pm10 | 25 | 33 | 24 | 14 | 17 | 26 | 39 | 42 | 35 | 32 | 21 | 23 | 42 | 25 | 33 | 11 | 22 | 13 |