Air Pollution in Xiyanglong: Real-time Air Quality Index and smog alert.
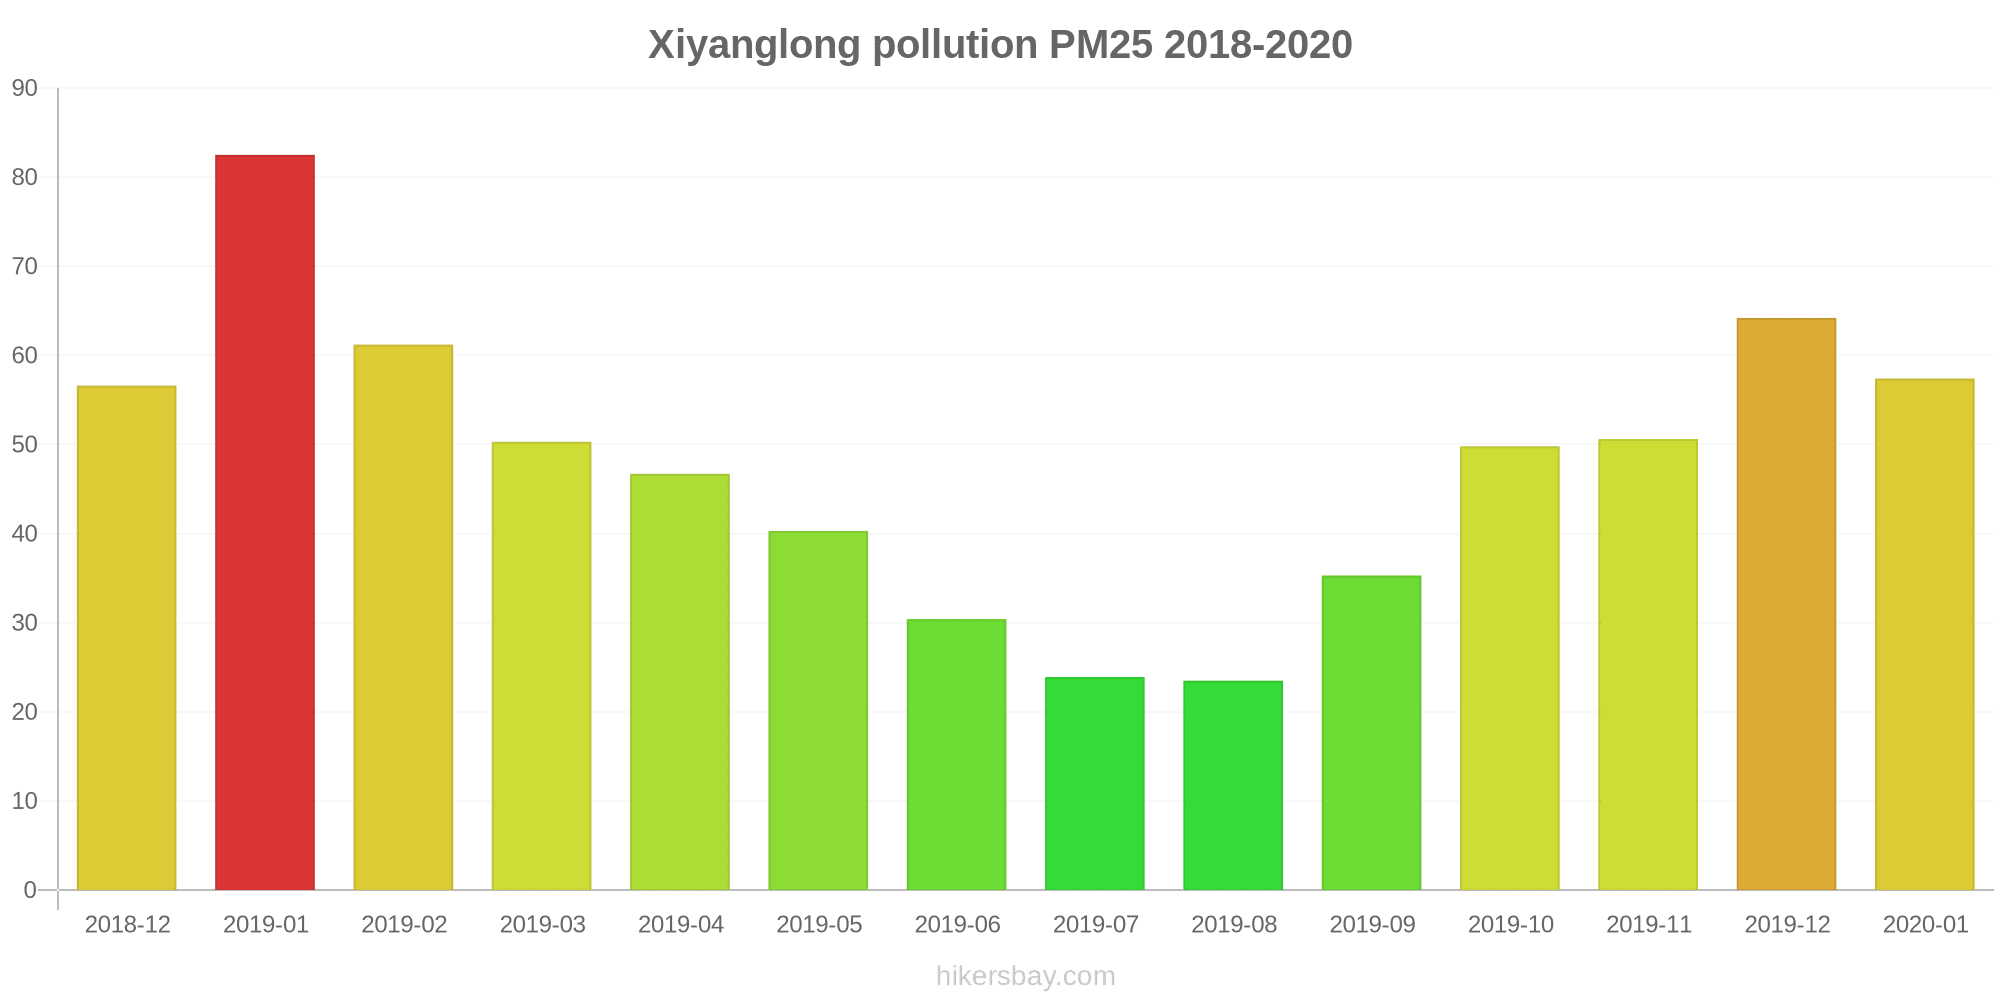
| index | 2020-01 | 2019-12 | 2019-11 | 2019-10 | 2019-09 | 2019-08 | 2019-07 | 2019-06 | 2019-05 | 2019-04 | 2019-03 | 2019-02 | 2019-01 | 2018-12 |
|---|---|---|---|---|---|---|---|---|---|---|---|---|---|---|
| pm25 | 57 (Unhealthy) | 64 (Unhealthy) | 51 (Unhealthy for Sensitive Groups) | 50 (Unhealthy for Sensitive Groups) | 35 (Unhealthy for Sensitive Groups) | 24 (Moderate) | 24 (Moderate) | 30 (Moderate) | 40 (Unhealthy for Sensitive Groups) | 47 (Unhealthy for Sensitive Groups) | 50 (Unhealthy for Sensitive Groups) | 61 (Unhealthy) | 83 (Very Unhealthy) | 57 (Unhealthy) |
| co | 777 (Good) | 684 (Good) | 574 (Good) | 619 (Good) | 524 (Good) | 705 (Good) | 559 (Good) | 570 (Good) | 630 (Good) | 758 (Good) | 721 (Good) | 896 (Good) | 1 (Good) | 1 (Good) |
| no2 | 36 (Good) | 51 (Moderate) | 47 (Moderate) | 38 (Good) | 24 (Good) | 22 (Good) | 22 (Good) | 27 (Good) | 36 (Good) | 32 (Good) | 36 (Good) | 26 (Good) | 42 (Moderate) | 32 (Good) |
| o3 | 40 (Good) | 67 (Good) | 110 (Moderate) | 133 (Unhealthy for Sensitive Groups) | 170 (Unhealthy) | 159 (Unhealthy) | 127 (Unhealthy for Sensitive Groups) | 145 (Unhealthy for Sensitive Groups) | 146 (Unhealthy for Sensitive Groups) | 113 (Moderate) | 103 (Moderate) | 59 (Good) | 61 (Good) | 53 (Good) |
| pm10 | 65 (Unhealthy for Sensitive Groups) | 77 (Unhealthy for Sensitive Groups) | 85 (Unhealthy) | 76 (Unhealthy for Sensitive Groups) | 60 (Unhealthy for Sensitive Groups) | 55 (Unhealthy for Sensitive Groups) | 49 (Moderate) | 48 (Moderate) | 75 (Unhealthy for Sensitive Groups) | 66 (Unhealthy for Sensitive Groups) | 72 (Unhealthy for Sensitive Groups) | 55 (Unhealthy for Sensitive Groups) | 94 (Unhealthy) | 70 (Unhealthy for Sensitive Groups) |
| so2 | 6.4 (Good) | 15 (Good) | 11 (Good) | 8.7 (Good) | 8 (Good) | 6.6 (Good) | 6.4 (Good) | 9.2 (Good) | 11 (Good) | 11 (Good) | 9.7 (Good) | 6 (Good) | 8.7 (Good) | 10 (Good) |
外国语学校(20181128启用)
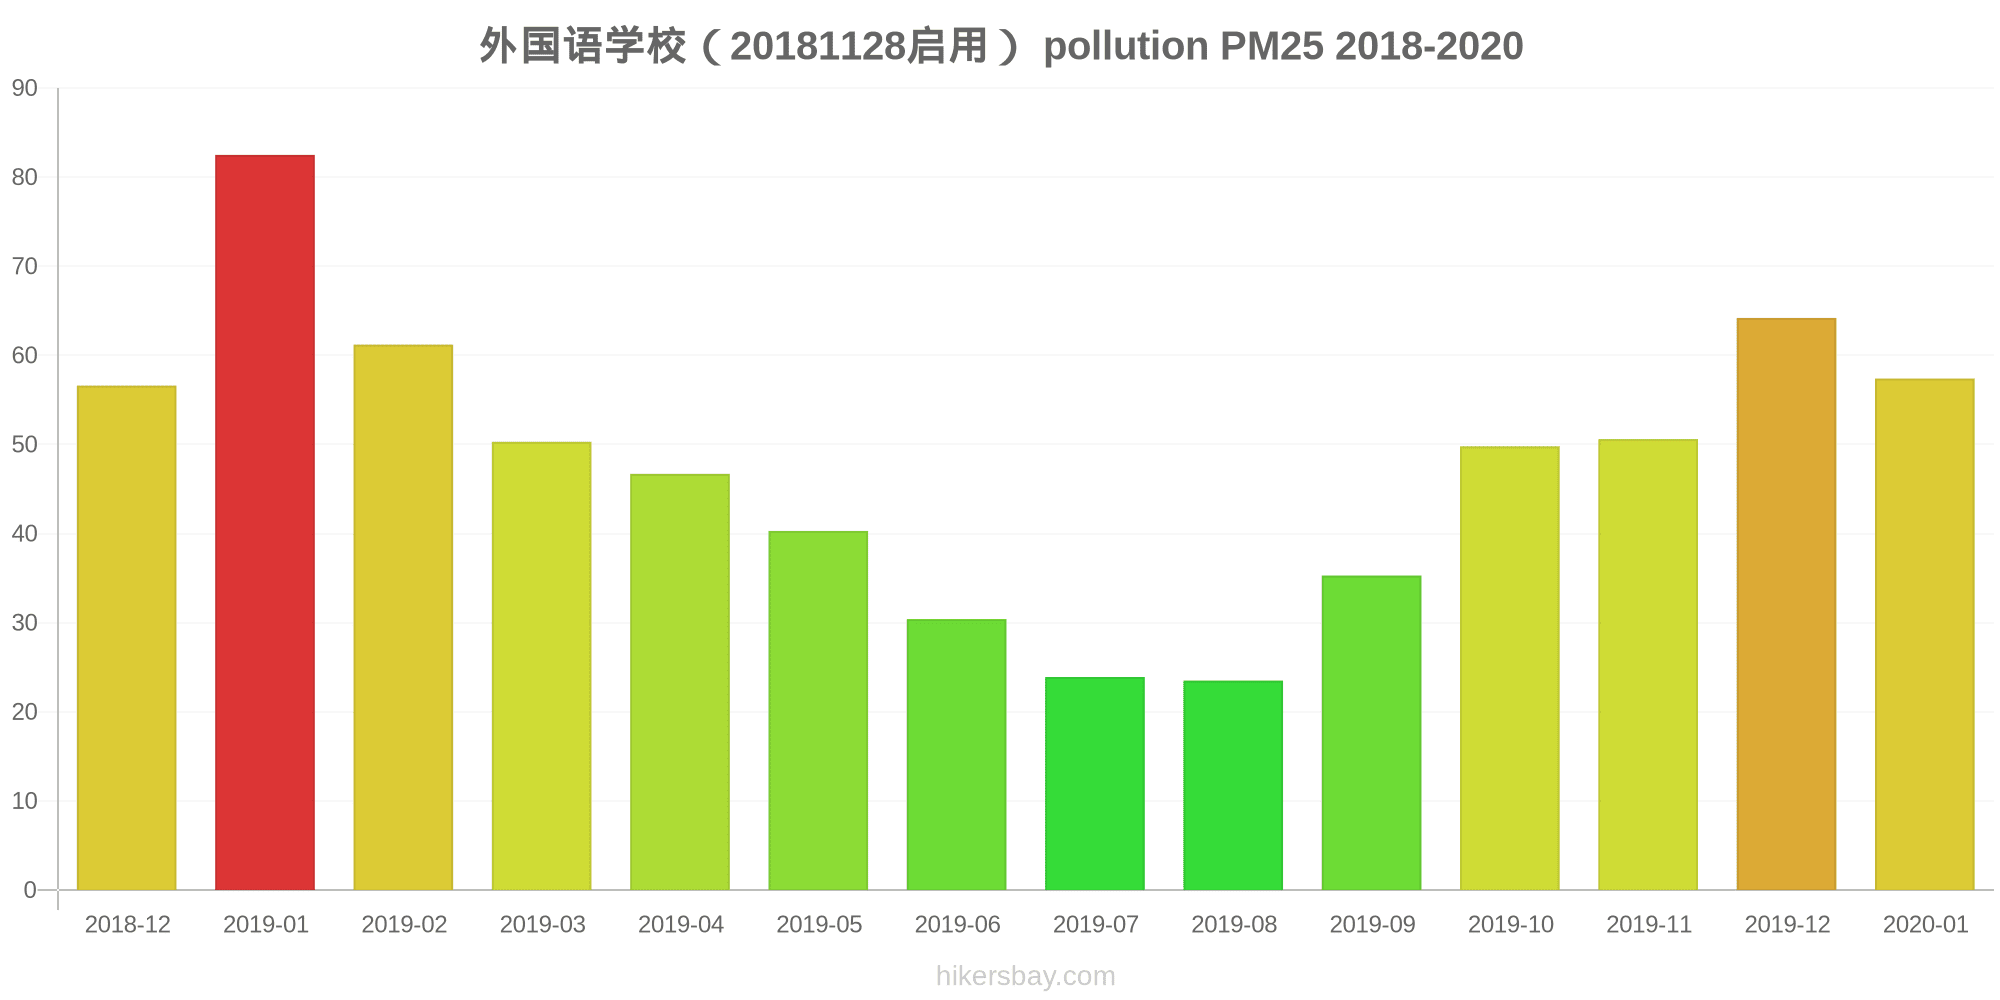
| index | 2020-01 | 2019-12 | 2019-11 | 2019-10 | 2019-09 | 2019-08 | 2019-07 | 2019-06 | 2019-05 | 2019-04 | 2019-03 | 2019-02 | 2019-01 | 2018-12 |
|---|---|---|---|---|---|---|---|---|---|---|---|---|---|---|
| pm25 | 57 | 64 | 51 | 50 | 35 | 24 | 24 | 30 | 40 | 47 | 50 | 61 | 83 | 57 |
| co | 777 | 684 | 574 | 619 | 524 | 705 | 559 | 570 | 630 | 758 | 721 | 896 | 1 | 1 |
| no2 | 36 | 51 | 47 | 38 | 24 | 22 | 22 | 27 | 36 | 32 | 36 | 26 | 42 | 32 |
| o3 | 40 | 67 | 110 | 133 | 170 | 159 | 127 | 145 | 146 | 113 | 103 | 59 | 61 | 53 |
| so2 | 6.4 | 15 | 11 | 8.7 | 8 | 6.6 | 6.4 | 9.2 | 11 | 11 | 9.7 | 6 | 8.7 | 10 |
| pm10 | 65 | 77 | 85 | 76 | 60 | 55 | 49 | 48 | 75 | 66 | 72 | 55 | 94 | 70 |
* Pollution data source:
https://openaq.org
()
The data is licensed under CC-By 4.0