Air Pollution in Nongke: Real-time Air Quality Index and smog alert.
Pollution and air quality forecast for Nongke. Today is Tuesday, June 16, 2026. The following air pollution values have been recorded for Nongke:- particulate matter (PM10) suspended dust - 179 (Very bad Hazardous)
- particulate matter (PM2.5) dust - 35 (Unhealthy for Sensitive Groups)
- ozone (O3) - 0 (Good)
- nitrogen dioxide (NO2) - 0 (Good)
- sulfur dioxide (SO2) - 0 (Good)

What is the air quality in Nongke today? Is the air polluted in Nongke?. Is there smog?
What is the level of PM10 today in Nongke? (particulate matter (PM10) suspended dust)
The current level of particulate matter PM10 in Nongke is:
179 (Very bad Hazardous)
The highest PM10 values usually occur in month: 140 (November 2018).
The lowest value of particulate matter PM10 pollution in Nongke is usually recorded in: September (38).
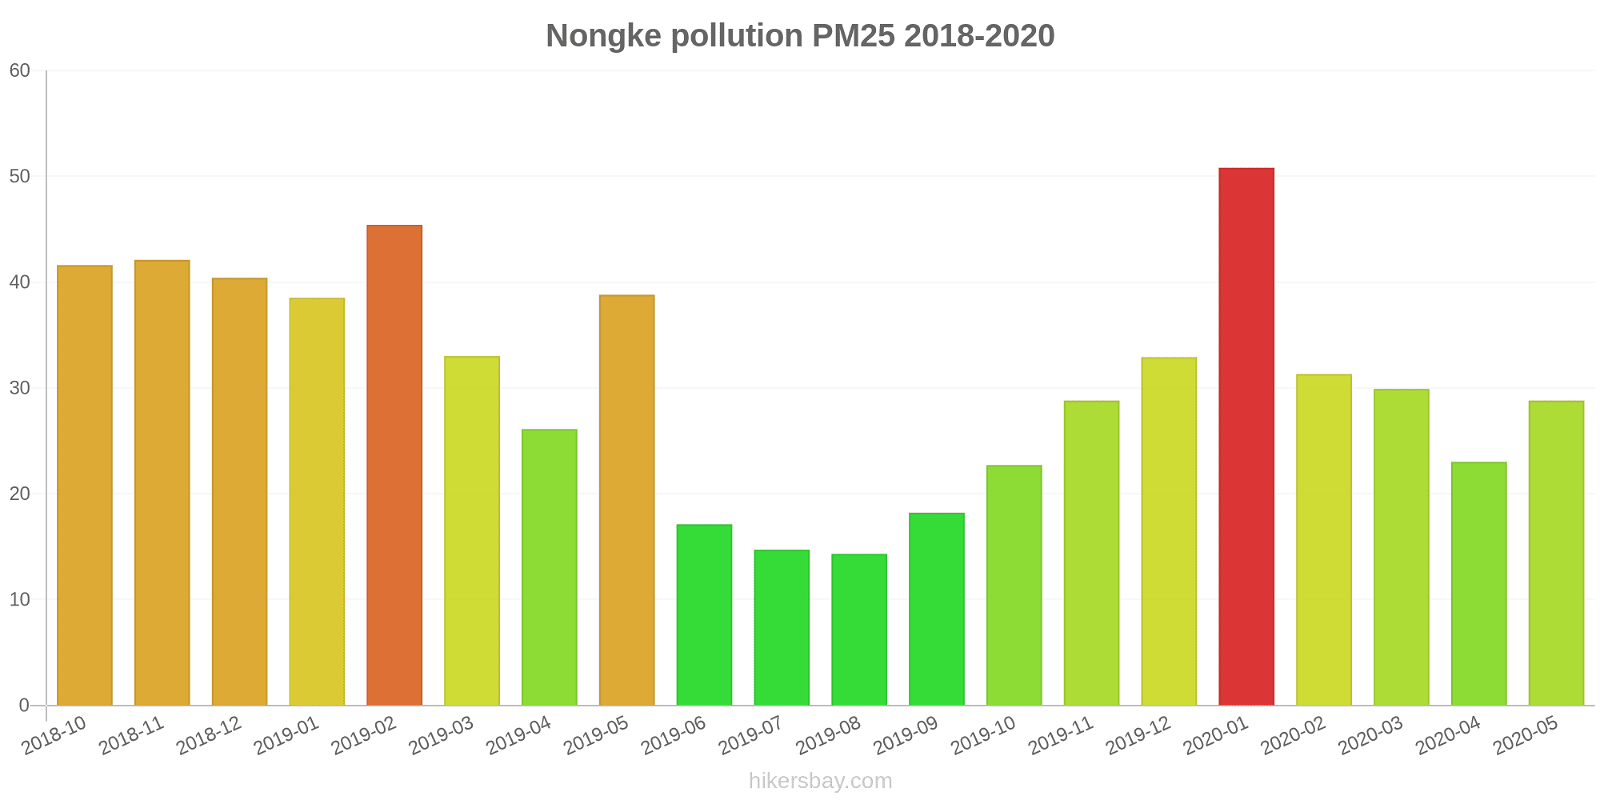
What is the current level of PM2.5 in Nongke? (particulate matter (PM2.5) dust)
Today's PM2.5 level is:
35 (Unhealthy for Sensitive Groups)
For comparison, the highest level of PM2.5 in Nongke in the last 7 days was: 56 (Friday, May 27, 2022) and the lowest: 56 (Friday, May 27, 2022).
The highest PM2.5 values were recorded: 51 (January 2020).
The lowest level of particulate matter PM2.5 pollution occurs in month: August (14).
How is the O3 level today in Nongke? (ozone (O3))
0 (Good)
How high is the level of NO2? (nitrogen dioxide (NO2))
0 (Good)
What is the level of SO2 pollution? (sulfur dioxide (SO2))
0 (Good)
Current data Friday, May 27, 2022, 12:00 PM
PM10 179 (Very bad Hazardous)
PM2,5 35 (Unhealthy for Sensitive Groups)
O3 0 (Good)
NO2 0 (Good)
SO2 0 (Good)
Data on air pollution from recent days in Nongke
index
2022-05-27
pm10
56
Unhealthy for Sensitive Groups
pm25
56
Unhealthy
o3
0
Good
no2
0
Good
so2
0
Good
data source »
Air pollution in Nongke from October 2018 to May 2020
index
2020-05
2020-04
2020-03
2020-02
2020-01
2019-12
2019-11
2019-10
2019-09
2019-08
2019-07
2019-06
2019-05
2019-04
2019-03
2019-02
2019-01
2018-12
2018-11
2018-10
pm25
29 (Moderate)
23 (Moderate)
30 (Moderate)
31 (Moderate)
51 (Unhealthy for Sensitive Groups)
33 (Moderate)
29 (Moderate)
23 (Moderate)
18 (Moderate)
14 (Moderate)
15 (Moderate)
17 (Moderate)
39 (Unhealthy for Sensitive Groups)
26 (Moderate)
33 (Moderate)
45 (Unhealthy for Sensitive Groups)
39 (Unhealthy for Sensitive Groups)
40 (Unhealthy for Sensitive Groups)
42 (Unhealthy for Sensitive Groups)
42 (Unhealthy for Sensitive Groups)
co
486 (Good)
505 (Good)
611 (Good)
677 (Good)
1 (Good)
782 (Good)
729 (Good)
606 (Good)
455 (Good)
615 (Good)
540 (Good)
514 (Good)
574 (Good)
708 (Good)
750 (Good)
840 (Good)
1 (Good)
731 (Good)
640 (Good)
751 (Good)
no2
19 (Good)
23 (Good)
20 (Good)
14 (Good)
28 (Good)
36 (Good)
33 (Good)
30 (Good)
28 (Good)
26 (Good)
25 (Good)
28 (Good)
30 (Good)
36 (Good)
39 (Good)
23 (Good)
33 (Good)
27 (Good)
29 (Good)
34 (Good)
o3
131 (Unhealthy for Sensitive Groups)
128 (Unhealthy for Sensitive Groups)
112 (Moderate)
102 (Moderate)
94 (Moderate)
81 (Moderate)
67 (Good)
81 (Moderate)
99 (Moderate)
116 (Moderate)
126 (Unhealthy for Sensitive Groups)
122 (Unhealthy for Sensitive Groups)
124 (Unhealthy for Sensitive Groups)
127 (Unhealthy for Sensitive Groups)
121 (Unhealthy for Sensitive Groups)
102 (Moderate)
88 (Moderate)
75 (Moderate)
94 (Moderate)
93 (Moderate)
pm10
104 (Unhealthy)
68 (Unhealthy for Sensitive Groups)
102 (Unhealthy)
74 (Unhealthy for Sensitive Groups)
61 (Unhealthy for Sensitive Groups)
57 (Unhealthy for Sensitive Groups)
60 (Unhealthy for Sensitive Groups)
52 (Unhealthy for Sensitive Groups)
38 (Moderate)
41 (Moderate)
46 (Moderate)
45 (Moderate)
100 (Unhealthy)
89 (Unhealthy)
95 (Unhealthy)
86 (Unhealthy)
73 (Unhealthy for Sensitive Groups)
133 (Very Unhealthy)
140 (Very Unhealthy)
125 (Very Unhealthy)
so2
9.5 (Good)
9.2 (Good)
8.8 (Good)
8.1 (Good)
11 (Good)
8.7 (Good)
12 (Good)
10 (Good)
10 (Good)
11 (Good)
9.3 (Good)
9.5 (Good)
11 (Good)
12 (Good)
11 (Good)
9.3 (Good)
16 (Good)
11 (Good)
11 (Good)
8.9 (Good)
data source »
马园
Friday, May 27, 2022, 12:00 PM
PM10 179 (Very bad Hazardous)
particulate matter (PM10) suspended dust
PM2,5 35 (Unhealthy for Sensitive Groups)
particulate matter (PM2.5) dust
O3 0.04 (Good)
ozone (O3)
NO2 0 (Good)
nitrogen dioxide (NO2)
SO2 0 (Good)
sulfur dioxide (SO2)
马园
index
2022-05-27
pm10
56
pm25
56
o3
0.03
no2
0
so2
0
马园
2018-10 2020-05

index
2020-05
2020-04
2020-03
2020-02
2020-01
2019-12
2019-11
2019-10
2019-09
2019-08
2019-07
2019-06
2019-05
2019-04
2019-03
2019-02
2019-01
2018-12
2018-11
2018-10
pm25
29
23
30
31
51
33
29
23
18
14
15
17
39
26
33
45
39
40
42
42
co
486
505
611
677
1
782
729
606
455
615
540
514
574
708
750
840
1
731
640
751
no2
19
23
20
14
28
36
33
30
28
26
25
28
30
36
39
23
33
27
29
34
o3
131
128
112
102
94
81
67
81
99
116
126
122
124
127
121
102
88
75
94
93
pm10
104
68
102
74
61
57
60
52
38
41
46
45
100
89
95
86
73
133
140
125
so2
9.5
9.2
8.8
8.1
11
8.7
12
10
10
11
9.3
9.5
11
12
11
9.3
16
11
11
8.9
* Pollution data source:
https://openaq.org
(ChinaAQIData)
The data is licensed under CC-By 4.0
PM10 179 (Very bad Hazardous)
PM2,5 35 (Unhealthy for Sensitive Groups)
O3 0 (Good)
NO2 0 (Good)
SO2 0 (Good)
Data on air pollution from recent days in Nongke
| index | 2022-05-27 |
|---|---|
| pm10 | 56 Unhealthy for Sensitive Groups |
| pm25 | 56 Unhealthy |
| o3 | 0 Good |
| no2 | 0 Good |
| so2 | 0 Good |

| index | 2020-05 | 2020-04 | 2020-03 | 2020-02 | 2020-01 | 2019-12 | 2019-11 | 2019-10 | 2019-09 | 2019-08 | 2019-07 | 2019-06 | 2019-05 | 2019-04 | 2019-03 | 2019-02 | 2019-01 | 2018-12 | 2018-11 | 2018-10 |
|---|---|---|---|---|---|---|---|---|---|---|---|---|---|---|---|---|---|---|---|---|
| pm25 | 29 (Moderate) | 23 (Moderate) | 30 (Moderate) | 31 (Moderate) | 51 (Unhealthy for Sensitive Groups) | 33 (Moderate) | 29 (Moderate) | 23 (Moderate) | 18 (Moderate) | 14 (Moderate) | 15 (Moderate) | 17 (Moderate) | 39 (Unhealthy for Sensitive Groups) | 26 (Moderate) | 33 (Moderate) | 45 (Unhealthy for Sensitive Groups) | 39 (Unhealthy for Sensitive Groups) | 40 (Unhealthy for Sensitive Groups) | 42 (Unhealthy for Sensitive Groups) | 42 (Unhealthy for Sensitive Groups) |
| co | 486 (Good) | 505 (Good) | 611 (Good) | 677 (Good) | 1 (Good) | 782 (Good) | 729 (Good) | 606 (Good) | 455 (Good) | 615 (Good) | 540 (Good) | 514 (Good) | 574 (Good) | 708 (Good) | 750 (Good) | 840 (Good) | 1 (Good) | 731 (Good) | 640 (Good) | 751 (Good) |
| no2 | 19 (Good) | 23 (Good) | 20 (Good) | 14 (Good) | 28 (Good) | 36 (Good) | 33 (Good) | 30 (Good) | 28 (Good) | 26 (Good) | 25 (Good) | 28 (Good) | 30 (Good) | 36 (Good) | 39 (Good) | 23 (Good) | 33 (Good) | 27 (Good) | 29 (Good) | 34 (Good) |
| o3 | 131 (Unhealthy for Sensitive Groups) | 128 (Unhealthy for Sensitive Groups) | 112 (Moderate) | 102 (Moderate) | 94 (Moderate) | 81 (Moderate) | 67 (Good) | 81 (Moderate) | 99 (Moderate) | 116 (Moderate) | 126 (Unhealthy for Sensitive Groups) | 122 (Unhealthy for Sensitive Groups) | 124 (Unhealthy for Sensitive Groups) | 127 (Unhealthy for Sensitive Groups) | 121 (Unhealthy for Sensitive Groups) | 102 (Moderate) | 88 (Moderate) | 75 (Moderate) | 94 (Moderate) | 93 (Moderate) |
| pm10 | 104 (Unhealthy) | 68 (Unhealthy for Sensitive Groups) | 102 (Unhealthy) | 74 (Unhealthy for Sensitive Groups) | 61 (Unhealthy for Sensitive Groups) | 57 (Unhealthy for Sensitive Groups) | 60 (Unhealthy for Sensitive Groups) | 52 (Unhealthy for Sensitive Groups) | 38 (Moderate) | 41 (Moderate) | 46 (Moderate) | 45 (Moderate) | 100 (Unhealthy) | 89 (Unhealthy) | 95 (Unhealthy) | 86 (Unhealthy) | 73 (Unhealthy for Sensitive Groups) | 133 (Very Unhealthy) | 140 (Very Unhealthy) | 125 (Very Unhealthy) |
| so2 | 9.5 (Good) | 9.2 (Good) | 8.8 (Good) | 8.1 (Good) | 11 (Good) | 8.7 (Good) | 12 (Good) | 10 (Good) | 10 (Good) | 11 (Good) | 9.3 (Good) | 9.5 (Good) | 11 (Good) | 12 (Good) | 11 (Good) | 9.3 (Good) | 16 (Good) | 11 (Good) | 11 (Good) | 8.9 (Good) |
PM10 179 (Very bad Hazardous)
particulate matter (PM10) suspended dustPM2,5 35 (Unhealthy for Sensitive Groups)
particulate matter (PM2.5) dustO3 0.04 (Good)
ozone (O3)NO2 0 (Good)
nitrogen dioxide (NO2)SO2 0 (Good)
sulfur dioxide (SO2)马园
| index | 2022-05-27 |
|---|---|
| pm10 | 56 |
| pm25 | 56 |
| o3 | 0.03 |
| no2 | 0 |
| so2 | 0 |
马园

| index | 2020-05 | 2020-04 | 2020-03 | 2020-02 | 2020-01 | 2019-12 | 2019-11 | 2019-10 | 2019-09 | 2019-08 | 2019-07 | 2019-06 | 2019-05 | 2019-04 | 2019-03 | 2019-02 | 2019-01 | 2018-12 | 2018-11 | 2018-10 |
|---|---|---|---|---|---|---|---|---|---|---|---|---|---|---|---|---|---|---|---|---|
| pm25 | 29 | 23 | 30 | 31 | 51 | 33 | 29 | 23 | 18 | 14 | 15 | 17 | 39 | 26 | 33 | 45 | 39 | 40 | 42 | 42 |
| co | 486 | 505 | 611 | 677 | 1 | 782 | 729 | 606 | 455 | 615 | 540 | 514 | 574 | 708 | 750 | 840 | 1 | 731 | 640 | 751 |
| no2 | 19 | 23 | 20 | 14 | 28 | 36 | 33 | 30 | 28 | 26 | 25 | 28 | 30 | 36 | 39 | 23 | 33 | 27 | 29 | 34 |
| o3 | 131 | 128 | 112 | 102 | 94 | 81 | 67 | 81 | 99 | 116 | 126 | 122 | 124 | 127 | 121 | 102 | 88 | 75 | 94 | 93 |
| pm10 | 104 | 68 | 102 | 74 | 61 | 57 | 60 | 52 | 38 | 41 | 46 | 45 | 100 | 89 | 95 | 86 | 73 | 133 | 140 | 125 |
| so2 | 9.5 | 9.2 | 8.8 | 8.1 | 11 | 8.7 | 12 | 10 | 10 | 11 | 9.3 | 9.5 | 11 | 12 | 11 | 9.3 | 16 | 11 | 11 | 8.9 |