Air Pollution in Fanlou: Real-time Air Quality Index and smog alert.
Pollution and air quality forecast for Fanlou. Today is Tuesday, June 2, 2026. The following air pollution values have been recorded for Fanlou:- particulate matter (PM10) suspended dust - 179 (Very bad Hazardous)
- particulate matter (PM2.5) dust - 35 (Unhealthy for Sensitive Groups)
- ozone (O3) - 0 (Good)
- nitrogen dioxide (NO2) - 0 (Good)
- sulfur dioxide (SO2) - 0 (Good)

What is the air quality in Fanlou today? Is the air polluted in Fanlou?. Is there smog?
What is the level of PM10 today in Fanlou? (particulate matter (PM10) suspended dust)
The current level of particulate matter PM10 in Fanlou is:
179 (Very bad Hazardous)
The highest PM10 values usually occur in month: 162 (December 2018).
The lowest value of particulate matter PM10 pollution in Fanlou is usually recorded in: July (43).
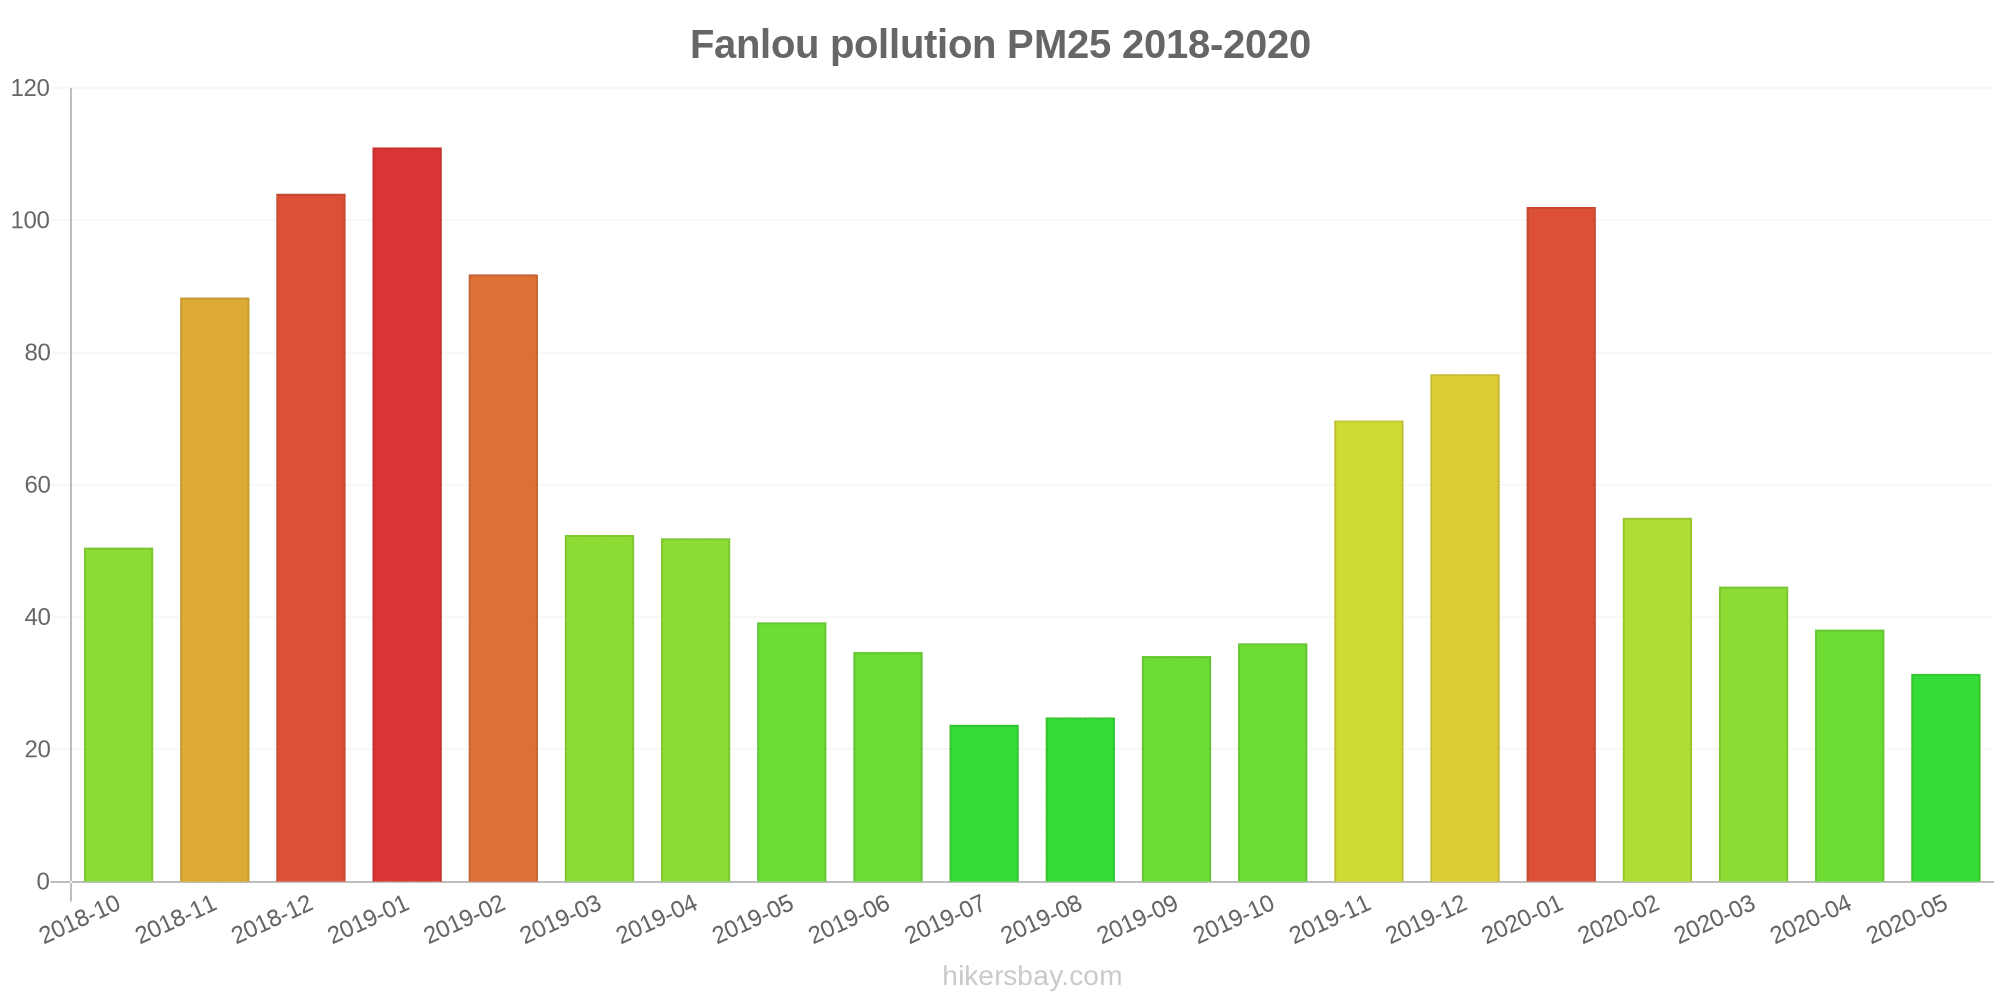
What is the current level of PM2.5 in Fanlou? (particulate matter (PM2.5) dust)
Today's PM2.5 level is:
35 (Unhealthy for Sensitive Groups)
For comparison, the highest level of PM2.5 in Fanlou in the last 7 days was: 56 (Friday, May 27, 2022) and the lowest: 56 (Friday, May 27, 2022).
The highest PM2.5 values were recorded: 111 (January 2019).
The lowest level of particulate matter PM2.5 pollution occurs in month: July (24).
How is the O3 level today in Fanlou? (ozone (O3))
0 (Good)
How high is the level of NO2? (nitrogen dioxide (NO2))
0 (Good)
What is the level of SO2 pollution? (sulfur dioxide (SO2))
0 (Good)
Current data Friday, May 27, 2022, 12:00 PM
PM10 179 (Very bad Hazardous)
PM2,5 35 (Unhealthy for Sensitive Groups)
O3 0 (Good)
NO2 0 (Good)
SO2 0 (Good)
Data on air pollution from recent days in Fanlou
index
2022-05-27
pm10
56
Unhealthy for Sensitive Groups
pm25
56
Unhealthy
o3
0
Good
no2
0
Good
so2
0
Good
data source »
Air pollution in Fanlou from October 2018 to May 2020

index
2020-05
2020-04
2020-03
2020-02
2020-01
2019-12
2019-11
2019-10
2019-09
2019-08
2019-07
2019-06
2019-05
2019-04
2019-03
2019-02
2019-01
2018-12
2018-11
2018-10
pm25
31 (Moderate)
38 (Unhealthy for Sensitive Groups)
45 (Unhealthy for Sensitive Groups)
55 (Unhealthy)
102 (Very Unhealthy)
77 (Very Unhealthy)
70 (Unhealthy)
36 (Unhealthy for Sensitive Groups)
34 (Moderate)
25 (Moderate)
24 (Moderate)
35 (Moderate)
39 (Unhealthy for Sensitive Groups)
52 (Unhealthy for Sensitive Groups)
52 (Unhealthy for Sensitive Groups)
92 (Very Unhealthy)
111 (Very bad Hazardous)
104 (Very Unhealthy)
88 (Very Unhealthy)
51 (Unhealthy for Sensitive Groups)
co
459 (Good)
518 (Good)
702 (Good)
876 (Good)
1 (Good)
880 (Good)
698 (Good)
636 (Good)
622 (Good)
457 (Good)
453 (Good)
388 (Good)
398 (Good)
750 (Good)
588 (Good)
821 (Good)
1 (Good)
1 (Good)
992 (Good)
631 (Good)
no2
17 (Good)
26 (Good)
20 (Good)
14 (Good)
31 (Good)
38 (Good)
31 (Good)
30 (Good)
22 (Good)
19 (Good)
22 (Good)
16 (Good)
21 (Good)
23 (Good)
27 (Good)
21 (Good)
40 (Moderate)
42 (Moderate)
35 (Good)
35 (Good)
o3
136 (Unhealthy for Sensitive Groups)
139 (Unhealthy for Sensitive Groups)
109 (Moderate)
90 (Moderate)
72 (Moderate)
63 (Good)
99 (Moderate)
113 (Moderate)
163 (Unhealthy)
158 (Unhealthy)
165 (Unhealthy)
183 (Very Unhealthy)
149 (Unhealthy for Sensitive Groups)
127 (Unhealthy for Sensitive Groups)
121 (Unhealthy for Sensitive Groups)
85 (Moderate)
74 (Moderate)
47 (Good)
90 (Moderate)
121 (Unhealthy for Sensitive Groups)
pm10
63 (Unhealthy for Sensitive Groups)
80 (Unhealthy)
86 (Unhealthy)
81 (Unhealthy)
144 (Very Unhealthy)
117 (Very Unhealthy)
115 (Very Unhealthy)
82 (Unhealthy)
72 (Unhealthy for Sensitive Groups)
45 (Moderate)
43 (Moderate)
65 (Unhealthy for Sensitive Groups)
89 (Unhealthy)
92 (Unhealthy)
97 (Unhealthy)
124 (Very Unhealthy)
158 (Very bad Hazardous)
162 (Very bad Hazardous)
143 (Very Unhealthy)
95 (Unhealthy)
so2
4.6 (Good)
6.4 (Good)
6.2 (Good)
4.8 (Good)
6.3 (Good)
8.3 (Good)
9.7 (Good)
7 (Good)
7.9 (Good)
4.9 (Good)
3.7 (Good)
4.8 (Good)
5.5 (Good)
6 (Good)
6.7 (Good)
7.9 (Good)
9.2 (Good)
10 (Good)
9.4 (Good)
12 (Good)
data source »
天方二分厂
Friday, May 27, 2022, 12:00 PM
PM10 179 (Very bad Hazardous)
particulate matter (PM10) suspended dust
PM2,5 35 (Unhealthy for Sensitive Groups)
particulate matter (PM2.5) dust
O3 0.04 (Good)
ozone (O3)
NO2 0 (Good)
nitrogen dioxide (NO2)
SO2 0 (Good)
sulfur dioxide (SO2)
天方二分厂
index
2022-05-27
pm10
56
pm25
56
o3
0.03
no2
0
so2
0
天方二分厂
2018-10 2020-05

index
2020-05
2020-04
2020-03
2020-02
2020-01
2019-12
2019-11
2019-10
2019-09
2019-08
2019-07
2019-06
2019-05
2019-04
2019-03
2019-02
2019-01
2018-12
2018-11
2018-10
pm25
31
38
45
55
102
77
70
36
34
25
24
35
39
52
52
92
111
104
88
51
co
459
518
702
876
1
880
698
636
622
457
453
388
398
750
588
821
1
1
992
631
no2
17
26
20
14
31
38
31
30
22
19
22
16
21
23
27
21
40
42
35
35
o3
136
139
109
90
72
63
99
113
163
158
165
183
149
127
121
85
74
47
90
121
pm10
63
80
86
81
144
117
115
82
72
45
43
65
89
92
97
124
158
162
143
95
so2
4.6
6.4
6.2
4.8
6.3
8.3
9.7
7
7.9
4.9
3.7
4.8
5.5
6
6.7
7.9
9.2
10
9.4
12
* Pollution data source:
https://openaq.org
(ChinaAQIData)
The data is licensed under CC-By 4.0
PM10 179 (Very bad Hazardous)
PM2,5 35 (Unhealthy for Sensitive Groups)
O3 0 (Good)
NO2 0 (Good)
SO2 0 (Good)
Data on air pollution from recent days in Fanlou
| index | 2022-05-27 |
|---|---|
| pm10 | 56 Unhealthy for Sensitive Groups |
| pm25 | 56 Unhealthy |
| o3 | 0 Good |
| no2 | 0 Good |
| so2 | 0 Good |
| index | 2020-05 | 2020-04 | 2020-03 | 2020-02 | 2020-01 | 2019-12 | 2019-11 | 2019-10 | 2019-09 | 2019-08 | 2019-07 | 2019-06 | 2019-05 | 2019-04 | 2019-03 | 2019-02 | 2019-01 | 2018-12 | 2018-11 | 2018-10 |
|---|---|---|---|---|---|---|---|---|---|---|---|---|---|---|---|---|---|---|---|---|
| pm25 | 31 (Moderate) | 38 (Unhealthy for Sensitive Groups) | 45 (Unhealthy for Sensitive Groups) | 55 (Unhealthy) | 102 (Very Unhealthy) | 77 (Very Unhealthy) | 70 (Unhealthy) | 36 (Unhealthy for Sensitive Groups) | 34 (Moderate) | 25 (Moderate) | 24 (Moderate) | 35 (Moderate) | 39 (Unhealthy for Sensitive Groups) | 52 (Unhealthy for Sensitive Groups) | 52 (Unhealthy for Sensitive Groups) | 92 (Very Unhealthy) | 111 (Very bad Hazardous) | 104 (Very Unhealthy) | 88 (Very Unhealthy) | 51 (Unhealthy for Sensitive Groups) |
| co | 459 (Good) | 518 (Good) | 702 (Good) | 876 (Good) | 1 (Good) | 880 (Good) | 698 (Good) | 636 (Good) | 622 (Good) | 457 (Good) | 453 (Good) | 388 (Good) | 398 (Good) | 750 (Good) | 588 (Good) | 821 (Good) | 1 (Good) | 1 (Good) | 992 (Good) | 631 (Good) |
| no2 | 17 (Good) | 26 (Good) | 20 (Good) | 14 (Good) | 31 (Good) | 38 (Good) | 31 (Good) | 30 (Good) | 22 (Good) | 19 (Good) | 22 (Good) | 16 (Good) | 21 (Good) | 23 (Good) | 27 (Good) | 21 (Good) | 40 (Moderate) | 42 (Moderate) | 35 (Good) | 35 (Good) |
| o3 | 136 (Unhealthy for Sensitive Groups) | 139 (Unhealthy for Sensitive Groups) | 109 (Moderate) | 90 (Moderate) | 72 (Moderate) | 63 (Good) | 99 (Moderate) | 113 (Moderate) | 163 (Unhealthy) | 158 (Unhealthy) | 165 (Unhealthy) | 183 (Very Unhealthy) | 149 (Unhealthy for Sensitive Groups) | 127 (Unhealthy for Sensitive Groups) | 121 (Unhealthy for Sensitive Groups) | 85 (Moderate) | 74 (Moderate) | 47 (Good) | 90 (Moderate) | 121 (Unhealthy for Sensitive Groups) |
| pm10 | 63 (Unhealthy for Sensitive Groups) | 80 (Unhealthy) | 86 (Unhealthy) | 81 (Unhealthy) | 144 (Very Unhealthy) | 117 (Very Unhealthy) | 115 (Very Unhealthy) | 82 (Unhealthy) | 72 (Unhealthy for Sensitive Groups) | 45 (Moderate) | 43 (Moderate) | 65 (Unhealthy for Sensitive Groups) | 89 (Unhealthy) | 92 (Unhealthy) | 97 (Unhealthy) | 124 (Very Unhealthy) | 158 (Very bad Hazardous) | 162 (Very bad Hazardous) | 143 (Very Unhealthy) | 95 (Unhealthy) |
| so2 | 4.6 (Good) | 6.4 (Good) | 6.2 (Good) | 4.8 (Good) | 6.3 (Good) | 8.3 (Good) | 9.7 (Good) | 7 (Good) | 7.9 (Good) | 4.9 (Good) | 3.7 (Good) | 4.8 (Good) | 5.5 (Good) | 6 (Good) | 6.7 (Good) | 7.9 (Good) | 9.2 (Good) | 10 (Good) | 9.4 (Good) | 12 (Good) |
PM10 179 (Very bad Hazardous)
particulate matter (PM10) suspended dustPM2,5 35 (Unhealthy for Sensitive Groups)
particulate matter (PM2.5) dustO3 0.04 (Good)
ozone (O3)NO2 0 (Good)
nitrogen dioxide (NO2)SO2 0 (Good)
sulfur dioxide (SO2)天方二分厂
| index | 2022-05-27 |
|---|---|
| pm10 | 56 |
| pm25 | 56 |
| o3 | 0.03 |
| no2 | 0 |
| so2 | 0 |
天方二分厂

| index | 2020-05 | 2020-04 | 2020-03 | 2020-02 | 2020-01 | 2019-12 | 2019-11 | 2019-10 | 2019-09 | 2019-08 | 2019-07 | 2019-06 | 2019-05 | 2019-04 | 2019-03 | 2019-02 | 2019-01 | 2018-12 | 2018-11 | 2018-10 |
|---|---|---|---|---|---|---|---|---|---|---|---|---|---|---|---|---|---|---|---|---|
| pm25 | 31 | 38 | 45 | 55 | 102 | 77 | 70 | 36 | 34 | 25 | 24 | 35 | 39 | 52 | 52 | 92 | 111 | 104 | 88 | 51 |
| co | 459 | 518 | 702 | 876 | 1 | 880 | 698 | 636 | 622 | 457 | 453 | 388 | 398 | 750 | 588 | 821 | 1 | 1 | 992 | 631 |
| no2 | 17 | 26 | 20 | 14 | 31 | 38 | 31 | 30 | 22 | 19 | 22 | 16 | 21 | 23 | 27 | 21 | 40 | 42 | 35 | 35 |
| o3 | 136 | 139 | 109 | 90 | 72 | 63 | 99 | 113 | 163 | 158 | 165 | 183 | 149 | 127 | 121 | 85 | 74 | 47 | 90 | 121 |
| pm10 | 63 | 80 | 86 | 81 | 144 | 117 | 115 | 82 | 72 | 45 | 43 | 65 | 89 | 92 | 97 | 124 | 158 | 162 | 143 | 95 |
| so2 | 4.6 | 6.4 | 6.2 | 4.8 | 6.3 | 8.3 | 9.7 | 7 | 7.9 | 4.9 | 3.7 | 4.8 | 5.5 | 6 | 6.7 | 7.9 | 9.2 | 10 | 9.4 | 12 |