Air Pollution in Nangang: Real-time Air Quality Index and smog alert.
Pollution and air quality forecast for Nangang. Today is Tuesday, June 16, 2026. The following air pollution values have been recorded for Nangang:- particulate matter (PM10) suspended dust - 7 (Good)
- particulate matter (PM2.5) dust - 2 (Good)
- carbon monoxide (CO) - 100 (Good)
- nitrogen dioxide (NO2) - 8 (Good)
- ozone (O3) - 0 (Good)
- sulfur dioxide (SO2) - 9 (Good)

What is the air quality in Nangang today? Is the air polluted in Nangang?. Is there smog?
What is the level of PM10 today in Nangang? (particulate matter (PM10) suspended dust)
The current level of particulate matter PM10 in Nangang is:
7 (Good)
The highest PM10 values usually occur in month: 173 (January 2020).
The lowest value of particulate matter PM10 pollution in Nangang is usually recorded in: August (31).
What is the current level of PM2.5 in Nangang? (particulate matter (PM2.5) dust)
Today's PM2.5 level is:
2 (Good)
For comparison, the highest level of PM2.5 in Nangang in the last 7 days was: 24 (Friday, May 27, 2022) and the lowest: 24 (Friday, May 27, 2022).
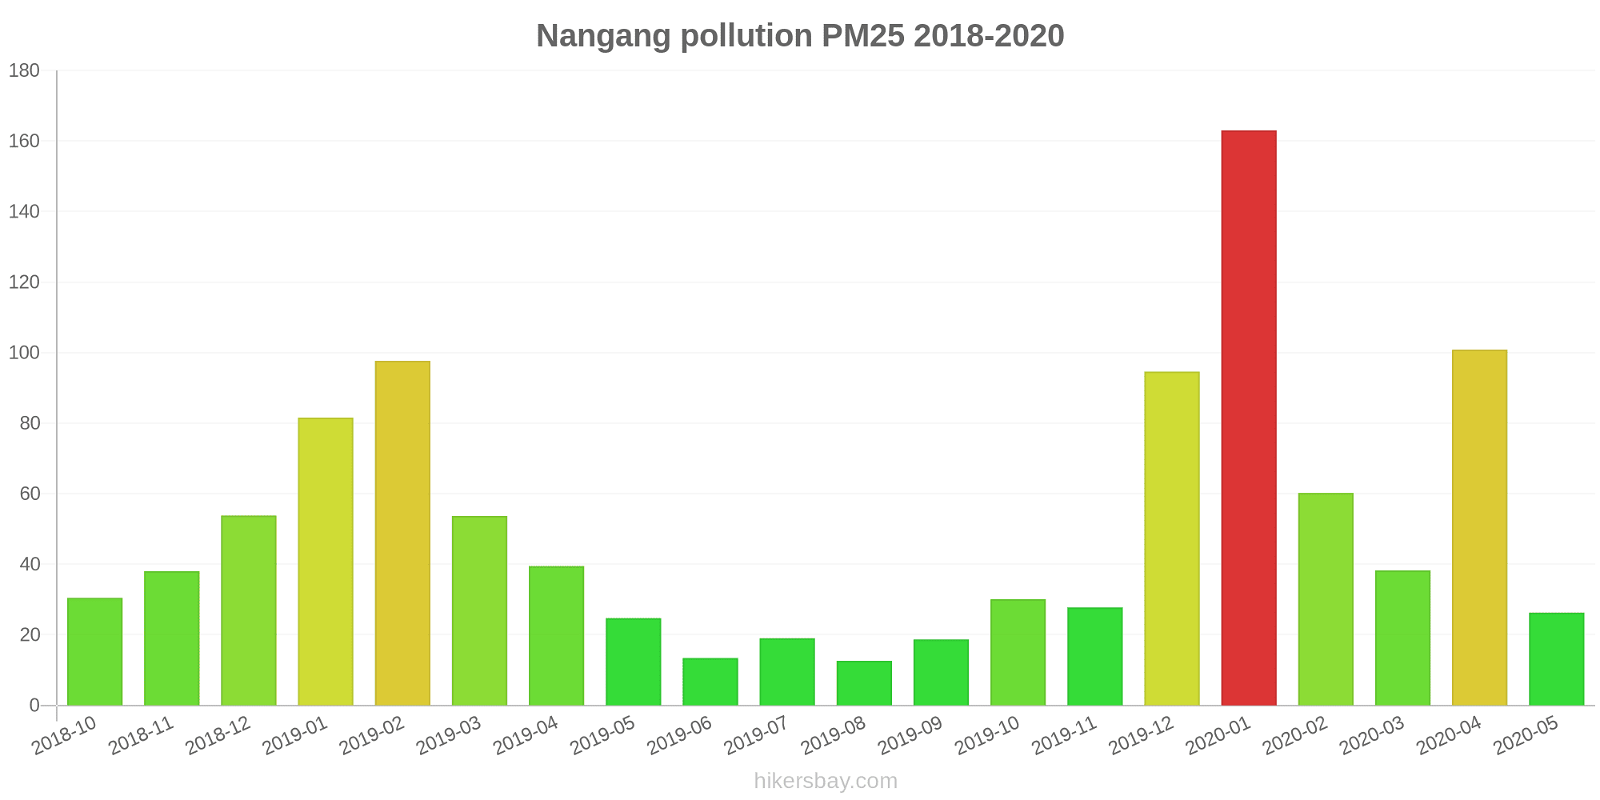
The highest PM2.5 values were recorded: 163 (January 2020).
The lowest level of particulate matter PM2.5 pollution occurs in month: August (13).
How high is the CO level? (carbon monoxide (CO))
100 (Good)
How high is the level of NO2? (nitrogen dioxide (NO2))
8 (Good)
How is the O3 level today in Nangang? (ozone (O3))
0 (Good)
What is the level of SO2 pollution? (sulfur dioxide (SO2))
9 (Good)
Current data Friday, May 27, 2022, 12:00 PM
PM10 7 (Good)
PM2,5 2 (Good)
CO 100 (Good)
NO2 8 (Good)
O3 0 (Good)
SO2 9 (Good)
Data on air pollution from recent days in Nangang
index
2022-05-27
pm10
32
Moderate
pm25
24
Moderate
co
468
Good
no2
21
Good
o3
32
Good
so2
5
Good
data source »
Air pollution in Nangang from October 2018 to May 2020
index
2020-05
2020-04
2020-03
2020-02
2020-01
2019-12
2019-11
2019-10
2019-09
2019-08
2019-07
2019-06
2019-05
2019-04
2019-03
2019-02
2019-01
2018-12
2018-11
2018-10
pm25
26 (Moderate)
101 (Very Unhealthy)
38 (Unhealthy for Sensitive Groups)
60 (Unhealthy)
163 (Very bad Hazardous)
95 (Very Unhealthy)
28 (Moderate)
30 (Moderate)
19 (Moderate)
13 (Good)
19 (Moderate)
13 (Moderate)
25 (Moderate)
39 (Unhealthy for Sensitive Groups)
54 (Unhealthy for Sensitive Groups)
98 (Very Unhealthy)
82 (Very Unhealthy)
54 (Unhealthy for Sensitive Groups)
38 (Unhealthy for Sensitive Groups)
30 (Moderate)
co
549 (Good)
767 (Good)
581 (Good)
381 (Good)
1 (Good)
1 (Good)
618 (Good)
730 (Good)
581 (Good)
547 (Good)
619 (Good)
485 (Good)
537 (Good)
579 (Good)
794 (Good)
445 (Good)
1 (Good)
826 (Good)
682 (Good)
676 (Good)
no2
25 (Good)
38 (Good)
26 (Good)
30 (Good)
70 (Moderate)
52 (Moderate)
31 (Good)
37 (Good)
31 (Good)
23 (Good)
29 (Good)
27 (Good)
26 (Good)
30 (Good)
39 (Good)
45 (Moderate)
50 (Moderate)
38 (Good)
41 (Moderate)
45 (Moderate)
o3
130 (Unhealthy for Sensitive Groups)
122 (Unhealthy for Sensitive Groups)
117 (Moderate)
101 (Moderate)
71 (Moderate)
45 (Good)
53 (Good)
80 (Moderate)
92 (Moderate)
67 (Good)
115 (Moderate)
112 (Moderate)
123 (Unhealthy for Sensitive Groups)
106 (Moderate)
98 (Moderate)
85 (Moderate)
50 (Good)
58 (Good)
58 (Good)
72 (Moderate)
so2
15 (Good)
17 (Good)
15 (Good)
36 (Good)
50 (Good)
37 (Good)
20 (Good)
18 (Good)
12 (Good)
8 (Good)
8.5 (Good)
11 (Good)
12 (Good)
16 (Good)
23 (Good)
39 (Good)
48 (Good)
38 (Good)
24 (Good)
17 (Good)
pm10
49 (Moderate)
105 (Unhealthy)
62 (Unhealthy for Sensitive Groups)
71 (Unhealthy for Sensitive Groups)
173 (Very bad Hazardous)
103 (Unhealthy)
46 (Moderate)
69 (Unhealthy for Sensitive Groups)
51 (Unhealthy for Sensitive Groups)
31 (Moderate)
42 (Moderate)
34 (Moderate)
73 (Unhealthy for Sensitive Groups)
123 (Very Unhealthy)
95 (Unhealthy)
111 (Very Unhealthy)
119 (Very Unhealthy)
68 (Unhealthy for Sensitive Groups)
69 (Unhealthy for Sensitive Groups)
62 (Unhealthy for Sensitive Groups)
data source »
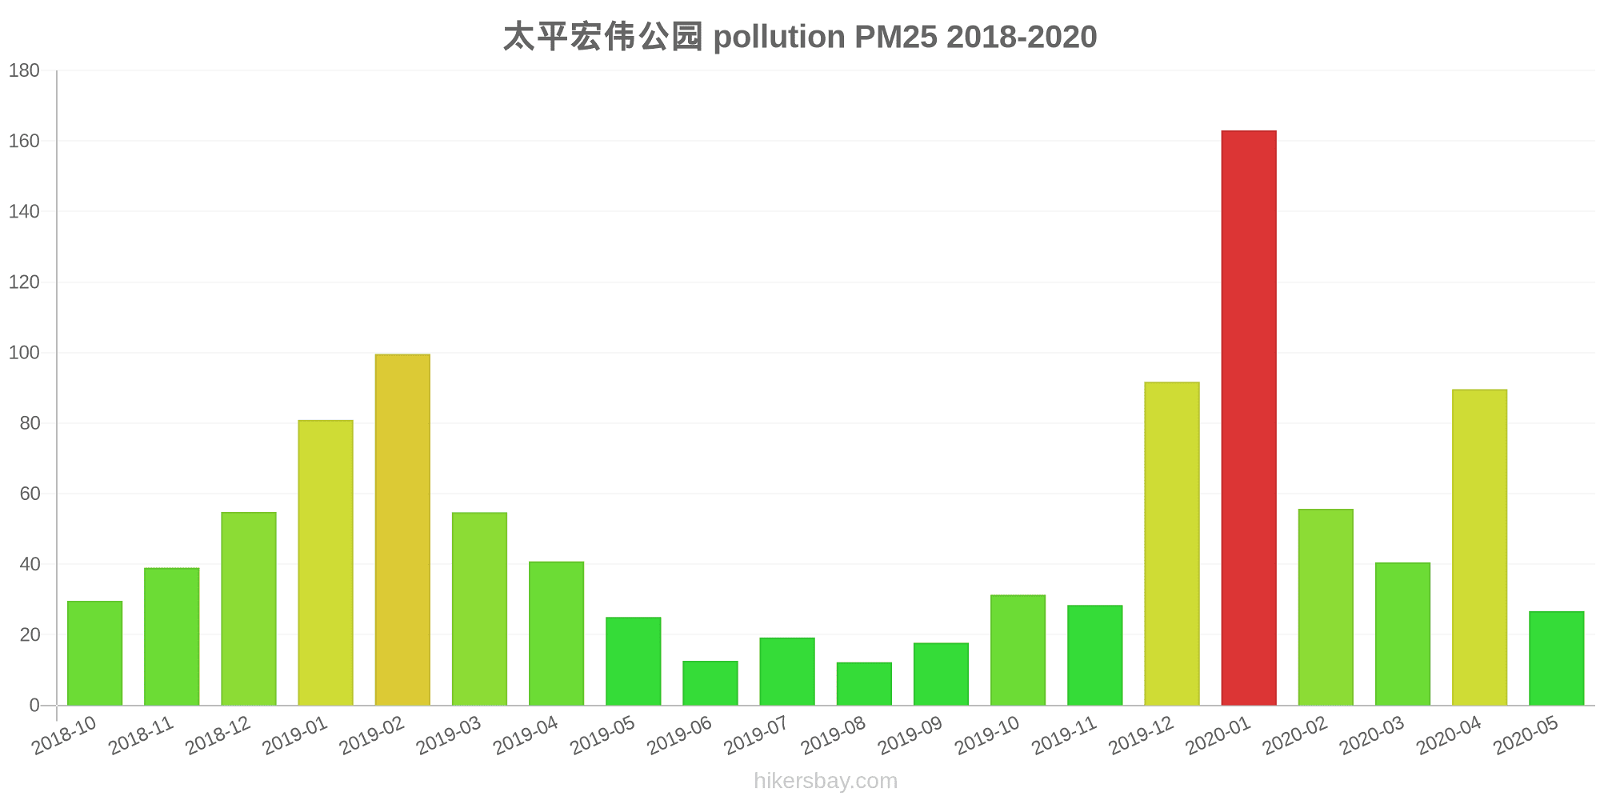
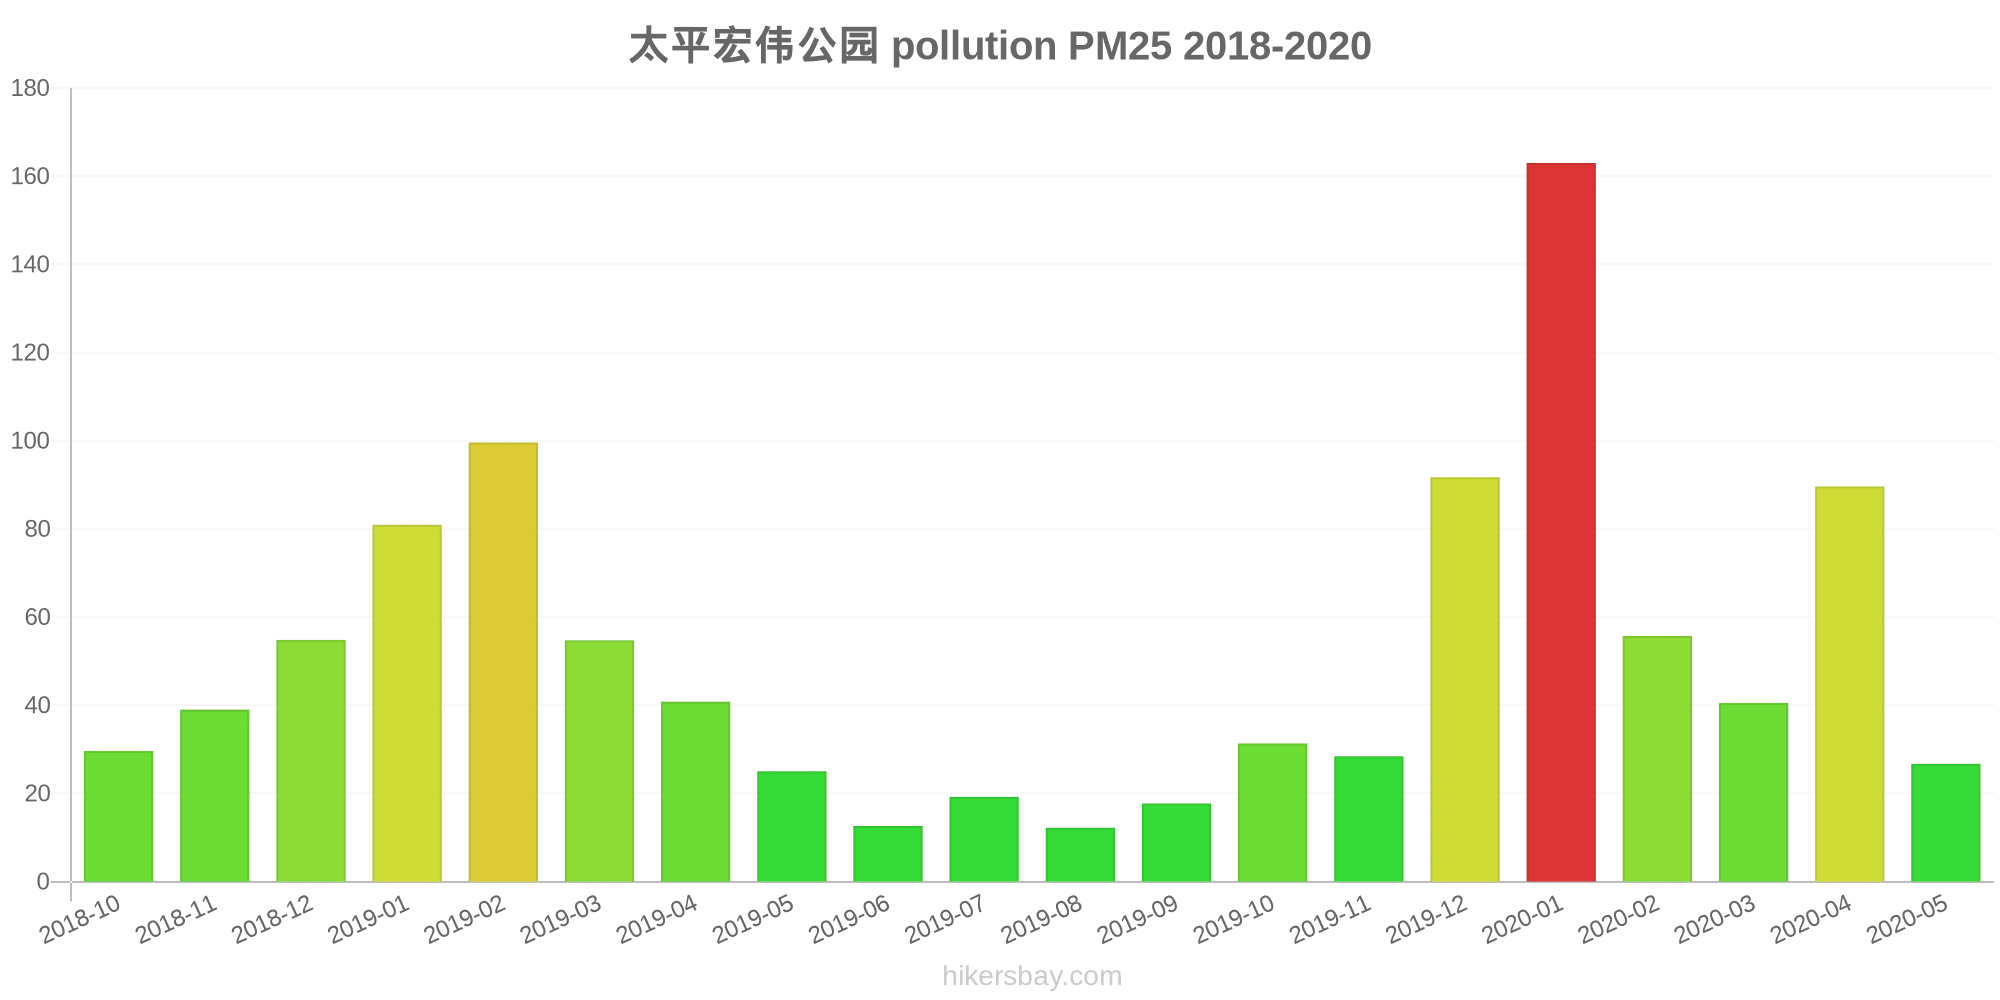
太平宏伟公园
Friday, May 27, 2022, 12:00 PM
PM10 6.7 (Good)
particulate matter (PM10) suspended dust
PM2,5 1.7 (Good)
particulate matter (PM2.5) dust
CO 100 (Good)
carbon monoxide (CO)
NO2 7.6 (Good)
nitrogen dioxide (NO2)
O3 0.02 (Good)
ozone (O3)
SO2 8.6 (Good)
sulfur dioxide (SO2)
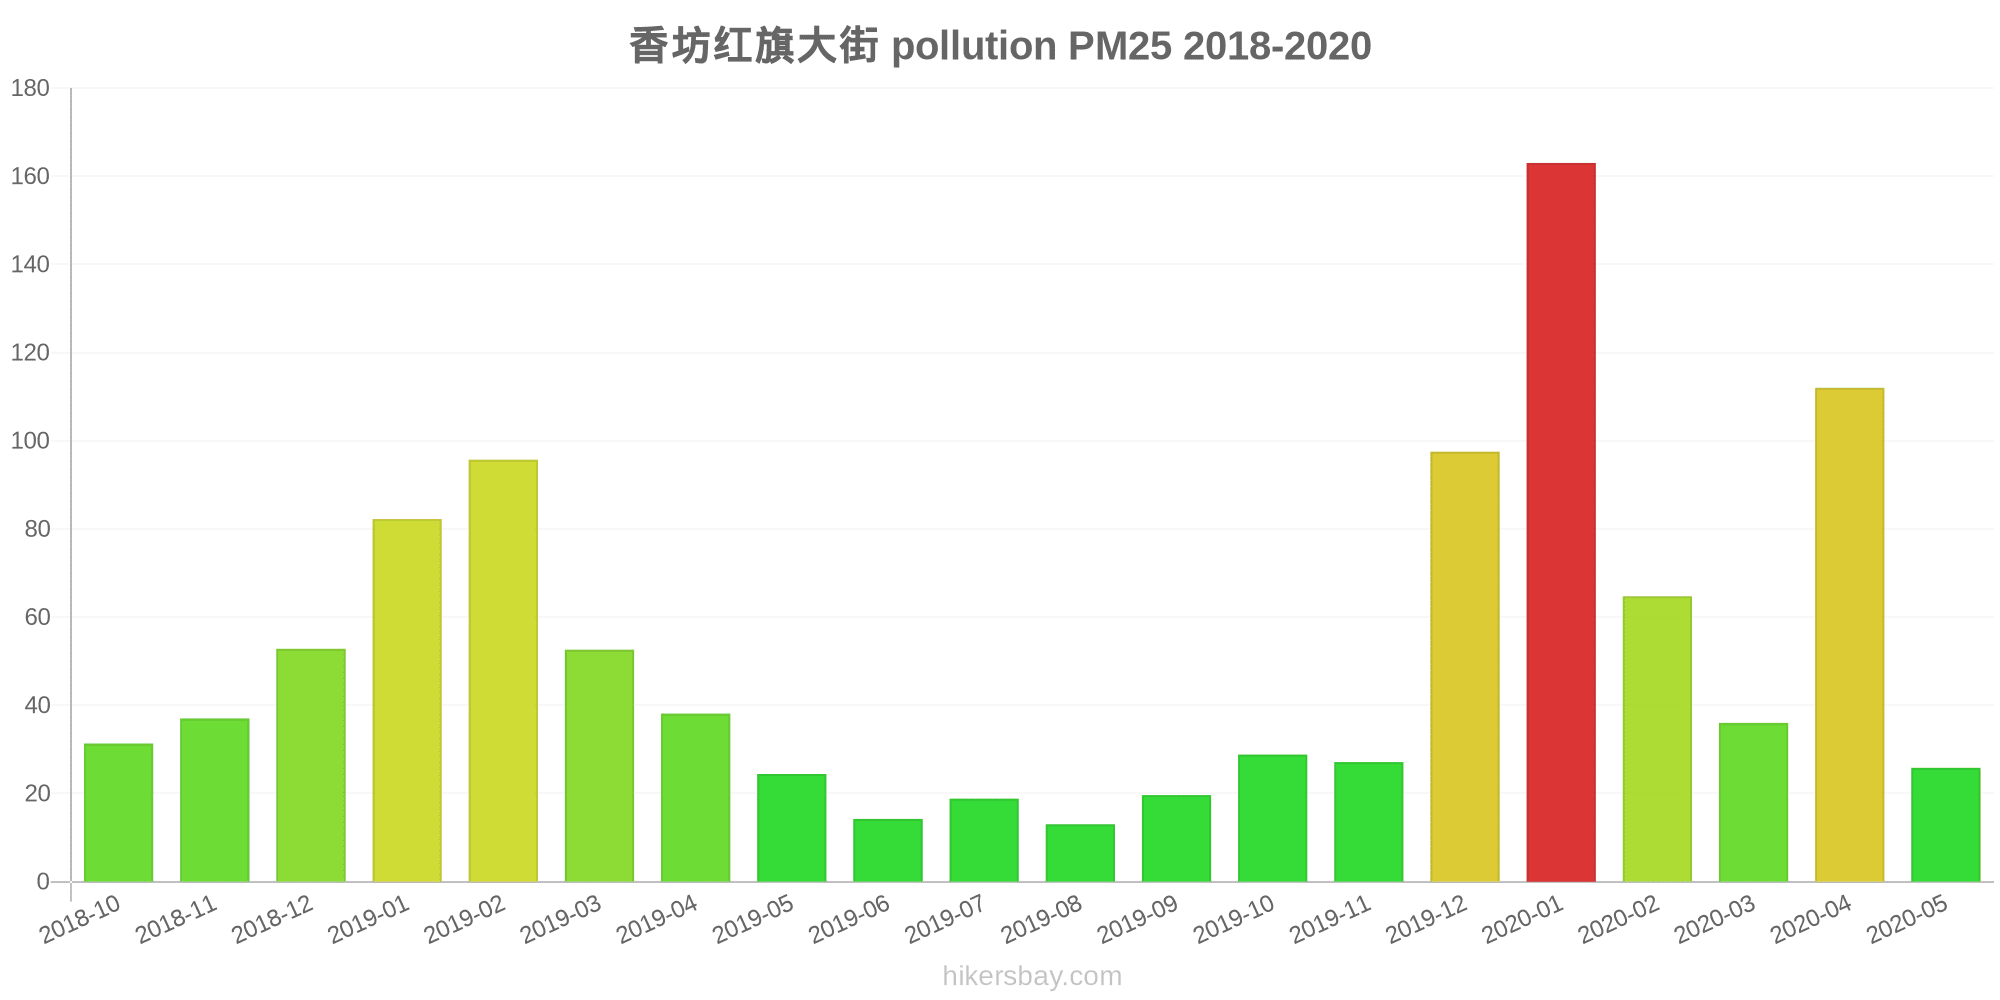
香坊红旗大街
Friday, May 27, 2022, 12:00 PM
PM10 6.7 (Good)
particulate matter (PM10) suspended dust
PM2,5 1.7 (Good)
particulate matter (PM2.5) dust
CO 100 (Good)
carbon monoxide (CO)
NO2 7.6 (Good)
nitrogen dioxide (NO2)
O3 0.02 (Good)
ozone (O3)
SO2 8.6 (Good)
sulfur dioxide (SO2)
太平宏伟公园
index
2022-05-27
pm10
32
pm25
24
co
468
no2
21
o3
32
so2
4.6
香坊红旗大街
index
2022-05-27
pm10
32
pm25
24
co
468
no2
21
o3
32
so2
4.6
太平宏伟公园
2018-10 2020-05
index
2020-05
2020-04
2020-03
2020-02
2020-01
2019-12
2019-11
2019-10
2019-09
2019-08
2019-07
2019-06
2019-05
2019-04
2019-03
2019-02
2019-01
2018-12
2018-11
2018-10
pm25
27
90
41
56
163
92
28
31
18
12
19
13
25
41
55
100
81
55
39
30
co
489
753
692
761
1
1
661
637
520
591
547
439
492
517
720
889
1
898
695
680
no2
24
37
25
29
69
51
31
37
30
21
25
24
23
26
36
43
46
37
39
42
o3
134
127
113
102
70
42
53
81
96
70
118
114
126
110
104
92
56
70
68
83
pm10
54
106
58
68
181
108
47
73
52
30
41
34
73
128
96
110
119
74
71
60
so2
12
19
17
30
41
35
18
17
10
7.3
7
8.8
11
14
22
44
51
42
25
17
香坊红旗大街
2018-10 2020-05

index
2020-05
2020-04
2020-03
2020-02
2020-01
2019-12
2019-11
2019-10
2019-09
2019-08
2019-07
2019-06
2019-05
2019-04
2019-03
2019-02
2019-01
2018-12
2018-11
2018-10
pm25
26
112
36
65
163
98
27
29
20
13
19
14
24
38
53
96
82
53
37
31
co
608
781
470
1
1
1
575
823
642
503
691
530
581
641
867
1
1
753
668
672
no2
25
40
26
30
72
52
32
38
32
26
34
30
30
34
43
47
54
39
43
49
o3
125
116
120
99
72
48
54
78
88
64
112
109
119
102
92
78
44
47
49
60
pm10
45
103
65
73
165
99
45
65
49
32
42
35
72
117
93
112
119
62
68
63
so2
17
15
13
43
58
39
23
18
13
8.8
10
12
13
18
23
34
45
34
23
17
* Pollution data source:
https://openaq.org
(ChinaAQIData)
The data is licensed under CC-By 4.0
PM10 7 (Good)
PM2,5 2 (Good)
CO 100 (Good)
NO2 8 (Good)
O3 0 (Good)
SO2 9 (Good)
Data on air pollution from recent days in Nangang
| index | 2022-05-27 |
|---|---|
| pm10 | 32 Moderate |
| pm25 | 24 Moderate |
| co | 468 Good |
| no2 | 21 Good |
| o3 | 32 Good |
| so2 | 5 Good |

| index | 2020-05 | 2020-04 | 2020-03 | 2020-02 | 2020-01 | 2019-12 | 2019-11 | 2019-10 | 2019-09 | 2019-08 | 2019-07 | 2019-06 | 2019-05 | 2019-04 | 2019-03 | 2019-02 | 2019-01 | 2018-12 | 2018-11 | 2018-10 |
|---|---|---|---|---|---|---|---|---|---|---|---|---|---|---|---|---|---|---|---|---|
| pm25 | 26 (Moderate) | 101 (Very Unhealthy) | 38 (Unhealthy for Sensitive Groups) | 60 (Unhealthy) | 163 (Very bad Hazardous) | 95 (Very Unhealthy) | 28 (Moderate) | 30 (Moderate) | 19 (Moderate) | 13 (Good) | 19 (Moderate) | 13 (Moderate) | 25 (Moderate) | 39 (Unhealthy for Sensitive Groups) | 54 (Unhealthy for Sensitive Groups) | 98 (Very Unhealthy) | 82 (Very Unhealthy) | 54 (Unhealthy for Sensitive Groups) | 38 (Unhealthy for Sensitive Groups) | 30 (Moderate) |
| co | 549 (Good) | 767 (Good) | 581 (Good) | 381 (Good) | 1 (Good) | 1 (Good) | 618 (Good) | 730 (Good) | 581 (Good) | 547 (Good) | 619 (Good) | 485 (Good) | 537 (Good) | 579 (Good) | 794 (Good) | 445 (Good) | 1 (Good) | 826 (Good) | 682 (Good) | 676 (Good) |
| no2 | 25 (Good) | 38 (Good) | 26 (Good) | 30 (Good) | 70 (Moderate) | 52 (Moderate) | 31 (Good) | 37 (Good) | 31 (Good) | 23 (Good) | 29 (Good) | 27 (Good) | 26 (Good) | 30 (Good) | 39 (Good) | 45 (Moderate) | 50 (Moderate) | 38 (Good) | 41 (Moderate) | 45 (Moderate) |
| o3 | 130 (Unhealthy for Sensitive Groups) | 122 (Unhealthy for Sensitive Groups) | 117 (Moderate) | 101 (Moderate) | 71 (Moderate) | 45 (Good) | 53 (Good) | 80 (Moderate) | 92 (Moderate) | 67 (Good) | 115 (Moderate) | 112 (Moderate) | 123 (Unhealthy for Sensitive Groups) | 106 (Moderate) | 98 (Moderate) | 85 (Moderate) | 50 (Good) | 58 (Good) | 58 (Good) | 72 (Moderate) |
| so2 | 15 (Good) | 17 (Good) | 15 (Good) | 36 (Good) | 50 (Good) | 37 (Good) | 20 (Good) | 18 (Good) | 12 (Good) | 8 (Good) | 8.5 (Good) | 11 (Good) | 12 (Good) | 16 (Good) | 23 (Good) | 39 (Good) | 48 (Good) | 38 (Good) | 24 (Good) | 17 (Good) |
| pm10 | 49 (Moderate) | 105 (Unhealthy) | 62 (Unhealthy for Sensitive Groups) | 71 (Unhealthy for Sensitive Groups) | 173 (Very bad Hazardous) | 103 (Unhealthy) | 46 (Moderate) | 69 (Unhealthy for Sensitive Groups) | 51 (Unhealthy for Sensitive Groups) | 31 (Moderate) | 42 (Moderate) | 34 (Moderate) | 73 (Unhealthy for Sensitive Groups) | 123 (Very Unhealthy) | 95 (Unhealthy) | 111 (Very Unhealthy) | 119 (Very Unhealthy) | 68 (Unhealthy for Sensitive Groups) | 69 (Unhealthy for Sensitive Groups) | 62 (Unhealthy for Sensitive Groups) |
PM10 6.7 (Good)
particulate matter (PM10) suspended dustPM2,5 1.7 (Good)
particulate matter (PM2.5) dustCO 100 (Good)
carbon monoxide (CO)NO2 7.6 (Good)
nitrogen dioxide (NO2)O3 0.02 (Good)
ozone (O3)SO2 8.6 (Good)
sulfur dioxide (SO2)PM10 6.7 (Good)
particulate matter (PM10) suspended dustPM2,5 1.7 (Good)
particulate matter (PM2.5) dustCO 100 (Good)
carbon monoxide (CO)NO2 7.6 (Good)
nitrogen dioxide (NO2)O3 0.02 (Good)
ozone (O3)SO2 8.6 (Good)
sulfur dioxide (SO2)太平宏伟公园
| index | 2022-05-27 |
|---|---|
| pm10 | 32 |
| pm25 | 24 |
| co | 468 |
| no2 | 21 |
| o3 | 32 |
| so2 | 4.6 |
香坊红旗大街
| index | 2022-05-27 |
|---|---|
| pm10 | 32 |
| pm25 | 24 |
| co | 468 |
| no2 | 21 |
| o3 | 32 |
| so2 | 4.6 |
太平宏伟公园
| index | 2020-05 | 2020-04 | 2020-03 | 2020-02 | 2020-01 | 2019-12 | 2019-11 | 2019-10 | 2019-09 | 2019-08 | 2019-07 | 2019-06 | 2019-05 | 2019-04 | 2019-03 | 2019-02 | 2019-01 | 2018-12 | 2018-11 | 2018-10 |
|---|---|---|---|---|---|---|---|---|---|---|---|---|---|---|---|---|---|---|---|---|
| pm25 | 27 | 90 | 41 | 56 | 163 | 92 | 28 | 31 | 18 | 12 | 19 | 13 | 25 | 41 | 55 | 100 | 81 | 55 | 39 | 30 |
| co | 489 | 753 | 692 | 761 | 1 | 1 | 661 | 637 | 520 | 591 | 547 | 439 | 492 | 517 | 720 | 889 | 1 | 898 | 695 | 680 |
| no2 | 24 | 37 | 25 | 29 | 69 | 51 | 31 | 37 | 30 | 21 | 25 | 24 | 23 | 26 | 36 | 43 | 46 | 37 | 39 | 42 |
| o3 | 134 | 127 | 113 | 102 | 70 | 42 | 53 | 81 | 96 | 70 | 118 | 114 | 126 | 110 | 104 | 92 | 56 | 70 | 68 | 83 |
| pm10 | 54 | 106 | 58 | 68 | 181 | 108 | 47 | 73 | 52 | 30 | 41 | 34 | 73 | 128 | 96 | 110 | 119 | 74 | 71 | 60 |
| so2 | 12 | 19 | 17 | 30 | 41 | 35 | 18 | 17 | 10 | 7.3 | 7 | 8.8 | 11 | 14 | 22 | 44 | 51 | 42 | 25 | 17 |
香坊红旗大街
| index | 2020-05 | 2020-04 | 2020-03 | 2020-02 | 2020-01 | 2019-12 | 2019-11 | 2019-10 | 2019-09 | 2019-08 | 2019-07 | 2019-06 | 2019-05 | 2019-04 | 2019-03 | 2019-02 | 2019-01 | 2018-12 | 2018-11 | 2018-10 |
|---|---|---|---|---|---|---|---|---|---|---|---|---|---|---|---|---|---|---|---|---|
| pm25 | 26 | 112 | 36 | 65 | 163 | 98 | 27 | 29 | 20 | 13 | 19 | 14 | 24 | 38 | 53 | 96 | 82 | 53 | 37 | 31 |
| co | 608 | 781 | 470 | 1 | 1 | 1 | 575 | 823 | 642 | 503 | 691 | 530 | 581 | 641 | 867 | 1 | 1 | 753 | 668 | 672 |
| no2 | 25 | 40 | 26 | 30 | 72 | 52 | 32 | 38 | 32 | 26 | 34 | 30 | 30 | 34 | 43 | 47 | 54 | 39 | 43 | 49 |
| o3 | 125 | 116 | 120 | 99 | 72 | 48 | 54 | 78 | 88 | 64 | 112 | 109 | 119 | 102 | 92 | 78 | 44 | 47 | 49 | 60 |
| pm10 | 45 | 103 | 65 | 73 | 165 | 99 | 45 | 65 | 49 | 32 | 42 | 35 | 72 | 117 | 93 | 112 | 119 | 62 | 68 | 63 |
| so2 | 17 | 15 | 13 | 43 | 58 | 39 | 23 | 18 | 13 | 8.8 | 10 | 12 | 13 | 18 | 23 | 34 | 45 | 34 | 23 | 17 |