Air Pollution in Yangjiashan: Real-time Air Quality Index and smog alert.
Pollution and air quality forecast for Yangjiashan. Today is Tuesday, June 2, 2026. The following air pollution values have been recorded for Yangjiashan:- particulate matter (PM10) suspended dust - 179 (Very bad Hazardous)
- particulate matter (PM2.5) dust - 35 (Unhealthy for Sensitive Groups)
- ozone (O3) - 0 (Good)
- nitrogen dioxide (NO2) - 0 (Good)
- sulfur dioxide (SO2) - 0 (Good)

What is the air quality in Yangjiashan today? Is the air polluted in Yangjiashan?. Is there smog?
What is the level of PM10 today in Yangjiashan? (particulate matter (PM10) suspended dust)
The current level of particulate matter PM10 in Yangjiashan is:
179 (Very bad Hazardous)
The highest PM10 values usually occur in month: 135 (January 2019).
The lowest value of particulate matter PM10 pollution in Yangjiashan is usually recorded in: July (42).
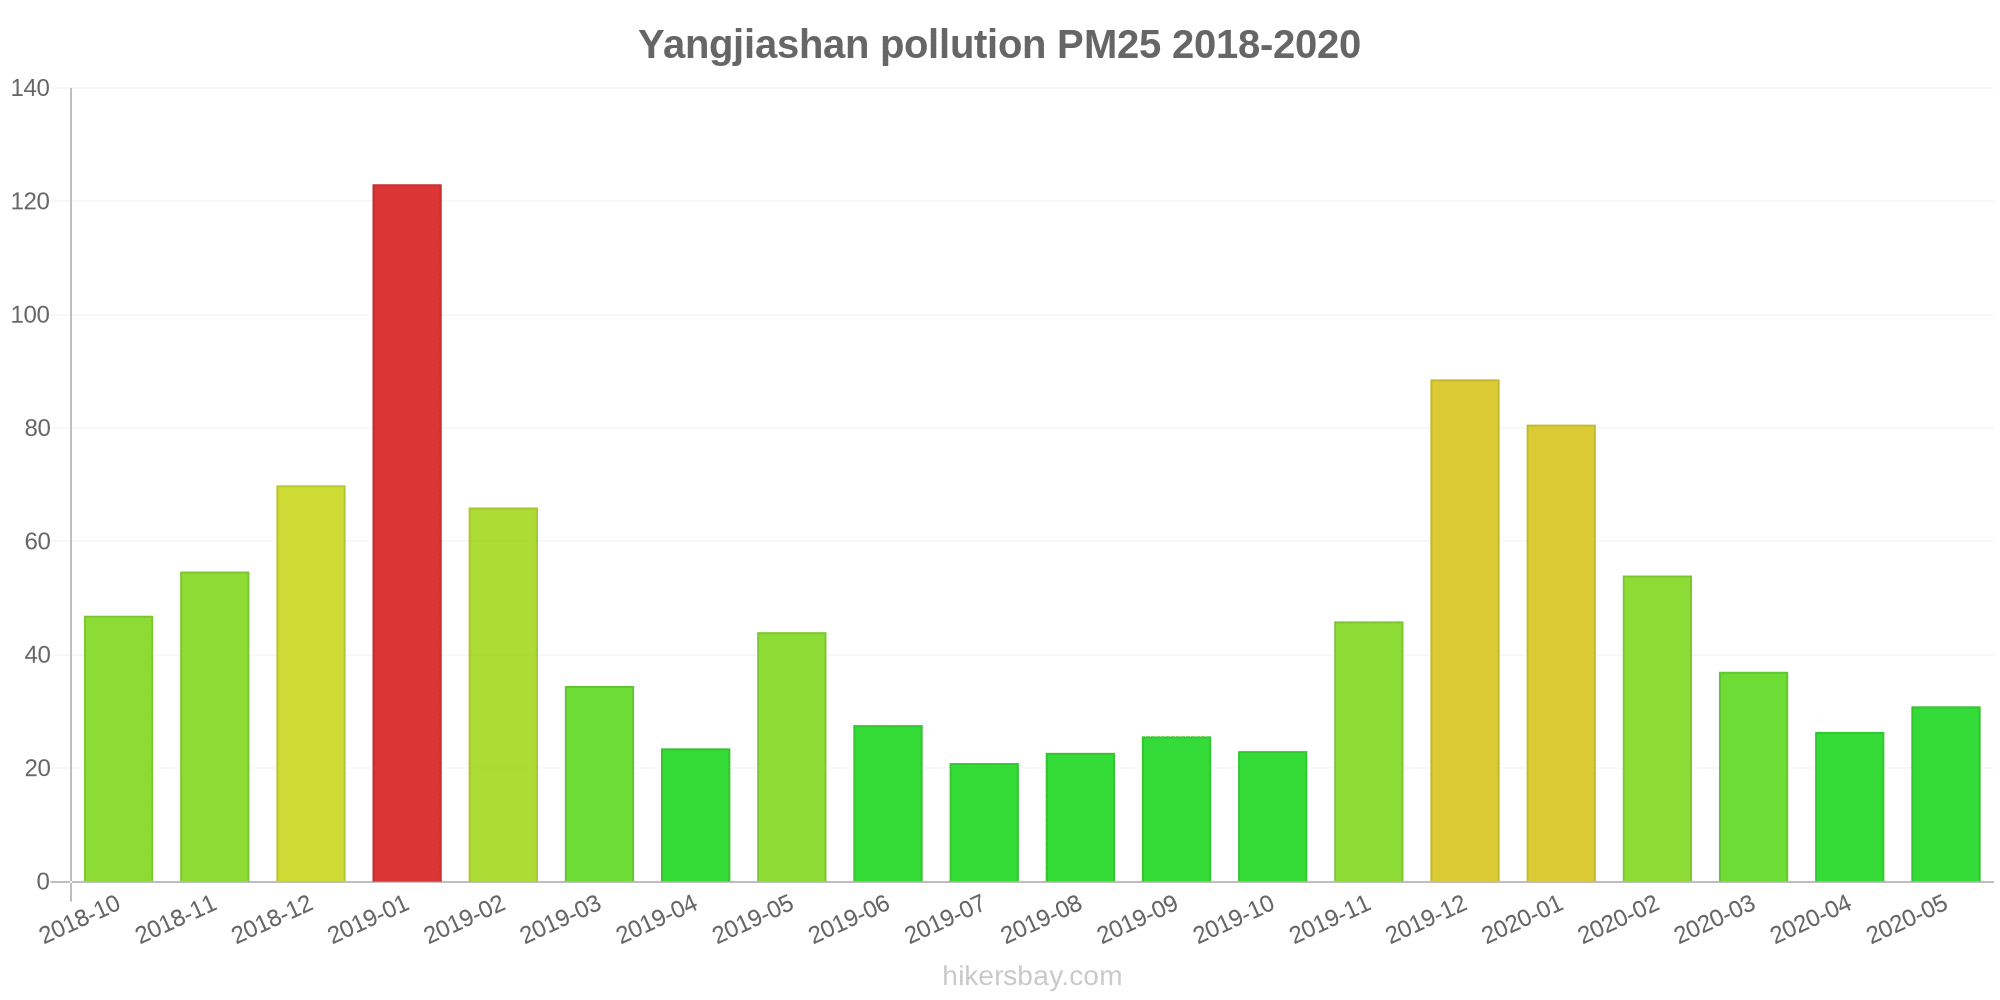
What is the current level of PM2.5 in Yangjiashan? (particulate matter (PM2.5) dust)
Today's PM2.5 level is:
35 (Unhealthy for Sensitive Groups)
For comparison, the highest level of PM2.5 in Yangjiashan in the last 7 days was: 56 (Friday, May 27, 2022) and the lowest: 56 (Friday, May 27, 2022).
The highest PM2.5 values were recorded: 123 (January 2019).
The lowest level of particulate matter PM2.5 pollution occurs in month: July (21).
How is the O3 level today in Yangjiashan? (ozone (O3))
0 (Good)
How high is the level of NO2? (nitrogen dioxide (NO2))
0 (Good)
What is the level of SO2 pollution? (sulfur dioxide (SO2))
0 (Good)
Current data Friday, May 27, 2022, 12:00 PM
PM10 179 (Very bad Hazardous)
PM2,5 35 (Unhealthy for Sensitive Groups)
O3 0 (Good)
NO2 0 (Good)
SO2 0 (Good)
Data on air pollution from recent days in Yangjiashan
index
2022-05-27
pm10
56
Unhealthy for Sensitive Groups
pm25
56
Unhealthy
o3
0
Good
no2
0
Good
so2
0
Good
data source »
Air pollution in Yangjiashan from October 2018 to May 2020

index
2020-05
2020-04
2020-03
2020-02
2020-01
2019-12
2019-11
2019-10
2019-09
2019-08
2019-07
2019-06
2019-05
2019-04
2019-03
2019-02
2019-01
2018-12
2018-11
2018-10
pm25
31 (Moderate)
26 (Moderate)
37 (Unhealthy for Sensitive Groups)
54 (Unhealthy for Sensitive Groups)
81 (Very Unhealthy)
89 (Very Unhealthy)
46 (Unhealthy for Sensitive Groups)
23 (Moderate)
26 (Moderate)
23 (Moderate)
21 (Moderate)
28 (Moderate)
44 (Unhealthy for Sensitive Groups)
24 (Moderate)
35 (Moderate)
66 (Unhealthy)
123 (Very bad Hazardous)
70 (Unhealthy)
55 (Unhealthy for Sensitive Groups)
47 (Unhealthy for Sensitive Groups)
co
627 (Good)
686 (Good)
745 (Good)
979 (Good)
1 (Good)
1 (Good)
1 (Good)
736 (Good)
708 (Good)
697 (Good)
801 (Good)
804 (Good)
861 (Good)
862 (Good)
983 (Good)
1 (Good)
1 (Good)
885 (Good)
1 (Good)
911 (Good)
no2
19 (Good)
26 (Good)
30 (Good)
17 (Good)
28 (Good)
44 (Moderate)
35 (Good)
25 (Good)
24 (Good)
20 (Good)
22 (Good)
21 (Good)
24 (Good)
23 (Good)
34 (Good)
25 (Good)
41 (Moderate)
30 (Good)
36 (Good)
33 (Good)
o3
149 (Unhealthy for Sensitive Groups)
119 (Moderate)
94 (Moderate)
91 (Moderate)
66 (Good)
42 (Good)
48 (Good)
60 (Good)
89 (Moderate)
121 (Unhealthy for Sensitive Groups)
113 (Moderate)
109 (Moderate)
119 (Moderate)
123 (Unhealthy for Sensitive Groups)
91 (Moderate)
73 (Moderate)
52 (Good)
45 (Good)
62 (Good)
82 (Moderate)
pm10
67 (Unhealthy for Sensitive Groups)
53 (Unhealthy for Sensitive Groups)
79 (Unhealthy for Sensitive Groups)
70 (Unhealthy for Sensitive Groups)
92 (Unhealthy)
117 (Very Unhealthy)
76 (Unhealthy for Sensitive Groups)
43 (Moderate)
44 (Moderate)
42 (Moderate)
42 (Moderate)
47 (Moderate)
92 (Unhealthy)
46 (Moderate)
65 (Unhealthy for Sensitive Groups)
89 (Unhealthy)
135 (Very Unhealthy)
110 (Very Unhealthy)
85 (Unhealthy)
82 (Unhealthy)
so2
16 (Good)
20 (Good)
20 (Good)
16 (Good)
14 (Good)
21 (Good)
15 (Good)
11 (Good)
9.1 (Good)
15 (Good)
19 (Good)
13 (Good)
19 (Good)
10 (Good)
11 (Good)
7.5 (Good)
12 (Good)
9.8 (Good)
15 (Good)
13 (Good)
data source »
鑫源开发区
Friday, May 27, 2022, 12:00 PM
PM10 179 (Very bad Hazardous)
particulate matter (PM10) suspended dust
PM2,5 35 (Unhealthy for Sensitive Groups)
particulate matter (PM2.5) dust
O3 0.04 (Good)
ozone (O3)
NO2 0 (Good)
nitrogen dioxide (NO2)
SO2 0 (Good)
sulfur dioxide (SO2)
鑫源开发区
index
2022-05-27
pm10
56
pm25
56
o3
0.03
no2
0
so2
0
鑫源开发区
2018-10 2020-05

index
2020-05
2020-04
2020-03
2020-02
2020-01
2019-12
2019-11
2019-10
2019-09
2019-08
2019-07
2019-06
2019-05
2019-04
2019-03
2019-02
2019-01
2018-12
2018-11
2018-10
pm25
31
26
37
54
81
89
46
23
26
23
21
28
44
24
35
66
123
70
55
47
co
627
686
745
979
1
1
1
736
708
697
801
804
861
862
983
1
1
885
1
911
no2
19
26
30
17
28
44
35
25
24
20
22
21
24
23
34
25
41
30
36
33
o3
149
119
94
91
66
42
48
60
89
121
113
109
119
123
91
73
52
45
62
82
pm10
67
53
79
70
92
117
76
43
44
42
42
47
92
46
65
89
135
110
85
82
so2
16
20
20
16
14
21
15
11
9.1
15
19
13
19
10
11
7.5
12
9.8
15
13
* Pollution data source:
https://openaq.org
(ChinaAQIData)
The data is licensed under CC-By 4.0
PM10 179 (Very bad Hazardous)
PM2,5 35 (Unhealthy for Sensitive Groups)
O3 0 (Good)
NO2 0 (Good)
SO2 0 (Good)
Data on air pollution from recent days in Yangjiashan
| index | 2022-05-27 |
|---|---|
| pm10 | 56 Unhealthy for Sensitive Groups |
| pm25 | 56 Unhealthy |
| o3 | 0 Good |
| no2 | 0 Good |
| so2 | 0 Good |
| index | 2020-05 | 2020-04 | 2020-03 | 2020-02 | 2020-01 | 2019-12 | 2019-11 | 2019-10 | 2019-09 | 2019-08 | 2019-07 | 2019-06 | 2019-05 | 2019-04 | 2019-03 | 2019-02 | 2019-01 | 2018-12 | 2018-11 | 2018-10 |
|---|---|---|---|---|---|---|---|---|---|---|---|---|---|---|---|---|---|---|---|---|
| pm25 | 31 (Moderate) | 26 (Moderate) | 37 (Unhealthy for Sensitive Groups) | 54 (Unhealthy for Sensitive Groups) | 81 (Very Unhealthy) | 89 (Very Unhealthy) | 46 (Unhealthy for Sensitive Groups) | 23 (Moderate) | 26 (Moderate) | 23 (Moderate) | 21 (Moderate) | 28 (Moderate) | 44 (Unhealthy for Sensitive Groups) | 24 (Moderate) | 35 (Moderate) | 66 (Unhealthy) | 123 (Very bad Hazardous) | 70 (Unhealthy) | 55 (Unhealthy for Sensitive Groups) | 47 (Unhealthy for Sensitive Groups) |
| co | 627 (Good) | 686 (Good) | 745 (Good) | 979 (Good) | 1 (Good) | 1 (Good) | 1 (Good) | 736 (Good) | 708 (Good) | 697 (Good) | 801 (Good) | 804 (Good) | 861 (Good) | 862 (Good) | 983 (Good) | 1 (Good) | 1 (Good) | 885 (Good) | 1 (Good) | 911 (Good) |
| no2 | 19 (Good) | 26 (Good) | 30 (Good) | 17 (Good) | 28 (Good) | 44 (Moderate) | 35 (Good) | 25 (Good) | 24 (Good) | 20 (Good) | 22 (Good) | 21 (Good) | 24 (Good) | 23 (Good) | 34 (Good) | 25 (Good) | 41 (Moderate) | 30 (Good) | 36 (Good) | 33 (Good) |
| o3 | 149 (Unhealthy for Sensitive Groups) | 119 (Moderate) | 94 (Moderate) | 91 (Moderate) | 66 (Good) | 42 (Good) | 48 (Good) | 60 (Good) | 89 (Moderate) | 121 (Unhealthy for Sensitive Groups) | 113 (Moderate) | 109 (Moderate) | 119 (Moderate) | 123 (Unhealthy for Sensitive Groups) | 91 (Moderate) | 73 (Moderate) | 52 (Good) | 45 (Good) | 62 (Good) | 82 (Moderate) |
| pm10 | 67 (Unhealthy for Sensitive Groups) | 53 (Unhealthy for Sensitive Groups) | 79 (Unhealthy for Sensitive Groups) | 70 (Unhealthy for Sensitive Groups) | 92 (Unhealthy) | 117 (Very Unhealthy) | 76 (Unhealthy for Sensitive Groups) | 43 (Moderate) | 44 (Moderate) | 42 (Moderate) | 42 (Moderate) | 47 (Moderate) | 92 (Unhealthy) | 46 (Moderate) | 65 (Unhealthy for Sensitive Groups) | 89 (Unhealthy) | 135 (Very Unhealthy) | 110 (Very Unhealthy) | 85 (Unhealthy) | 82 (Unhealthy) |
| so2 | 16 (Good) | 20 (Good) | 20 (Good) | 16 (Good) | 14 (Good) | 21 (Good) | 15 (Good) | 11 (Good) | 9.1 (Good) | 15 (Good) | 19 (Good) | 13 (Good) | 19 (Good) | 10 (Good) | 11 (Good) | 7.5 (Good) | 12 (Good) | 9.8 (Good) | 15 (Good) | 13 (Good) |
PM10 179 (Very bad Hazardous)
particulate matter (PM10) suspended dustPM2,5 35 (Unhealthy for Sensitive Groups)
particulate matter (PM2.5) dustO3 0.04 (Good)
ozone (O3)NO2 0 (Good)
nitrogen dioxide (NO2)SO2 0 (Good)
sulfur dioxide (SO2)鑫源开发区
| index | 2022-05-27 |
|---|---|
| pm10 | 56 |
| pm25 | 56 |
| o3 | 0.03 |
| no2 | 0 |
| so2 | 0 |
鑫源开发区

| index | 2020-05 | 2020-04 | 2020-03 | 2020-02 | 2020-01 | 2019-12 | 2019-11 | 2019-10 | 2019-09 | 2019-08 | 2019-07 | 2019-06 | 2019-05 | 2019-04 | 2019-03 | 2019-02 | 2019-01 | 2018-12 | 2018-11 | 2018-10 |
|---|---|---|---|---|---|---|---|---|---|---|---|---|---|---|---|---|---|---|---|---|
| pm25 | 31 | 26 | 37 | 54 | 81 | 89 | 46 | 23 | 26 | 23 | 21 | 28 | 44 | 24 | 35 | 66 | 123 | 70 | 55 | 47 |
| co | 627 | 686 | 745 | 979 | 1 | 1 | 1 | 736 | 708 | 697 | 801 | 804 | 861 | 862 | 983 | 1 | 1 | 885 | 1 | 911 |
| no2 | 19 | 26 | 30 | 17 | 28 | 44 | 35 | 25 | 24 | 20 | 22 | 21 | 24 | 23 | 34 | 25 | 41 | 30 | 36 | 33 |
| o3 | 149 | 119 | 94 | 91 | 66 | 42 | 48 | 60 | 89 | 121 | 113 | 109 | 119 | 123 | 91 | 73 | 52 | 45 | 62 | 82 |
| pm10 | 67 | 53 | 79 | 70 | 92 | 117 | 76 | 43 | 44 | 42 | 42 | 47 | 92 | 46 | 65 | 89 | 135 | 110 | 85 | 82 |
| so2 | 16 | 20 | 20 | 16 | 14 | 21 | 15 | 11 | 9.1 | 15 | 19 | 13 | 19 | 10 | 11 | 7.5 | 12 | 9.8 | 15 | 13 |