Air Pollution in Zhongsuozhen: Real-time Air Quality Index and smog alert.
Pollution and air quality forecast for Zhongsuozhen. Today is Tuesday, June 2, 2026. The following air pollution values have been recorded for Zhongsuozhen:- particulate matter (PM10) suspended dust - 179 (Very bad Hazardous)
- particulate matter (PM2.5) dust - 35 (Unhealthy for Sensitive Groups)
- ozone (O3) - 0 (Good)
- nitrogen dioxide (NO2) - 0 (Good)
- sulfur dioxide (SO2) - 0 (Good)

What is the air quality in Zhongsuozhen today? Is the air polluted in Zhongsuozhen?. Is there smog?
What is the level of PM10 today in Zhongsuozhen? (particulate matter (PM10) suspended dust)
The current level of particulate matter PM10 in Zhongsuozhen is:
179 (Very bad Hazardous)
The highest PM10 values usually occur in month: 136 (January 2019).
The lowest value of particulate matter PM10 pollution in Zhongsuozhen is usually recorded in: July (38).
What is the current level of PM2.5 in Zhongsuozhen? (particulate matter (PM2.5) dust)
Today's PM2.5 level is:
35 (Unhealthy for Sensitive Groups)
For comparison, the highest level of PM2.5 in Zhongsuozhen in the last 7 days was: 56 (Friday, May 27, 2022) and the lowest: 56 (Friday, May 27, 2022).
The highest PM2.5 values were recorded: 130 (January 2019).
The lowest level of particulate matter PM2.5 pollution occurs in month: July (21).
How is the O3 level today in Zhongsuozhen? (ozone (O3))
0 (Good)
How high is the level of NO2? (nitrogen dioxide (NO2))
0 (Good)
What is the level of SO2 pollution? (sulfur dioxide (SO2))
0 (Good)
Current data Friday, May 27, 2022, 12:00 PM
PM10 179 (Very bad Hazardous)
PM2,5 35 (Unhealthy for Sensitive Groups)
O3 0 (Good)
NO2 0 (Good)
SO2 0 (Good)
Data on air pollution from recent days in Zhongsuozhen
index
2022-05-27
pm10
56
Unhealthy for Sensitive Groups
pm25
56
Unhealthy
o3
0
Good
no2
0
Good
so2
0
Good
data source »
Air pollution in Zhongsuozhen from October 2018 to May 2020
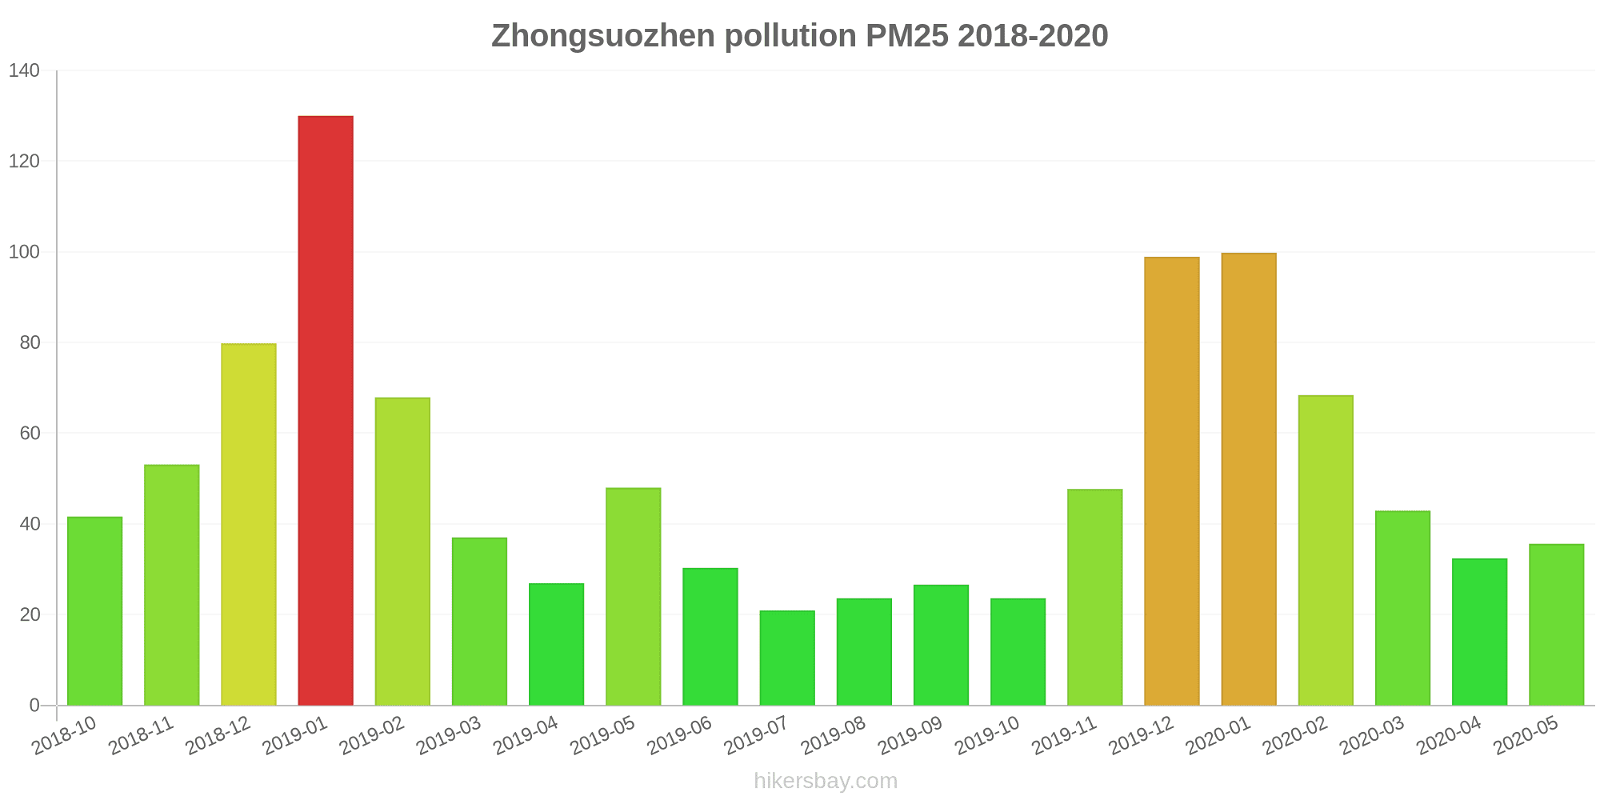
index
2020-05
2020-04
2020-03
2020-02
2020-01
2019-12
2019-11
2019-10
2019-09
2019-08
2019-07
2019-06
2019-05
2019-04
2019-03
2019-02
2019-01
2018-12
2018-11
2018-10
pm25
36 (Unhealthy for Sensitive Groups)
32 (Moderate)
43 (Unhealthy for Sensitive Groups)
68 (Unhealthy)
100 (Very Unhealthy)
99 (Very Unhealthy)
48 (Unhealthy for Sensitive Groups)
24 (Moderate)
27 (Moderate)
24 (Moderate)
21 (Moderate)
30 (Moderate)
48 (Unhealthy for Sensitive Groups)
27 (Moderate)
37 (Unhealthy for Sensitive Groups)
68 (Unhealthy)
130 (Very bad Hazardous)
80 (Very Unhealthy)
53 (Unhealthy for Sensitive Groups)
42 (Unhealthy for Sensitive Groups)
co
787 (Good)
686 (Good)
841 (Good)
1 (Good)
1 (Good)
1 (Good)
979 (Good)
745 (Good)
677 (Good)
636 (Good)
704 (Good)
848 (Good)
798 (Good)
921 (Good)
1 (Good)
1 (Good)
1 (Good)
1 (Good)
1 (Good)
807 (Good)
no2
26 (Good)
35 (Good)
35 (Good)
21 (Good)
29 (Good)
37 (Good)
30 (Good)
22 (Good)
19 (Good)
15 (Good)
17 (Good)
17 (Good)
23 (Good)
27 (Good)
36 (Good)
30 (Good)
46 (Moderate)
33 (Good)
31 (Good)
27 (Good)
o3
147 (Unhealthy for Sensitive Groups)
116 (Moderate)
94 (Moderate)
86 (Moderate)
60 (Good)
37 (Good)
47 (Good)
60 (Good)
85 (Moderate)
115 (Moderate)
109 (Moderate)
111 (Moderate)
114 (Moderate)
116 (Moderate)
92 (Moderate)
79 (Moderate)
49 (Good)
37 (Good)
56 (Good)
75 (Moderate)
pm10
69 (Unhealthy for Sensitive Groups)
57 (Unhealthy for Sensitive Groups)
81 (Unhealthy)
83 (Unhealthy)
111 (Very Unhealthy)
126 (Very Unhealthy)
80 (Unhealthy)
44 (Moderate)
51 (Unhealthy for Sensitive Groups)
46 (Moderate)
38 (Moderate)
49 (Moderate)
74 (Unhealthy for Sensitive Groups)
55 (Unhealthy for Sensitive Groups)
84 (Unhealthy)
107 (Unhealthy)
136 (Very Unhealthy)
115 (Very Unhealthy)
75 (Unhealthy for Sensitive Groups)
67 (Unhealthy for Sensitive Groups)
so2
12 (Good)
14 (Good)
11 (Good)
8.9 (Good)
9.9 (Good)
13 (Good)
10 (Good)
8.9 (Good)
10 (Good)
10 (Good)
12 (Good)
13 (Good)
16 (Good)
12 (Good)
11 (Good)
9.1 (Good)
12 (Good)
8.7 (Good)
8.7 (Good)
8.1 (Good)
data source »
南郑大河坎水厂
Friday, May 27, 2022, 12:00 PM
PM10 179 (Very bad Hazardous)
particulate matter (PM10) suspended dust
PM2,5 35 (Unhealthy for Sensitive Groups)
particulate matter (PM2.5) dust
O3 0.04 (Good)
ozone (O3)
NO2 0 (Good)
nitrogen dioxide (NO2)
SO2 0 (Good)
sulfur dioxide (SO2)
南郑大河坎水厂
index
2022-05-27
pm10
56
pm25
56
o3
0.03
no2
0
so2
0
南郑大河坎水厂
2018-10 2020-05

index
2020-05
2020-04
2020-03
2020-02
2020-01
2019-12
2019-11
2019-10
2019-09
2019-08
2019-07
2019-06
2019-05
2019-04
2019-03
2019-02
2019-01
2018-12
2018-11
2018-10
pm25
36
32
43
68
100
99
48
24
27
24
21
30
48
27
37
68
130
80
53
42
co
787
686
841
1
1
1
979
745
677
636
704
848
798
921
1
1
1
1
1
807
no2
26
35
35
21
29
37
30
22
19
15
17
17
23
27
36
30
46
33
31
27
o3
147
116
94
86
60
37
47
60
85
115
109
111
114
116
92
79
49
37
56
75
pm10
69
57
81
83
111
126
80
44
51
46
38
49
74
55
84
107
136
115
75
67
so2
12
14
11
8.9
9.9
13
10
8.9
10
10
12
13
16
12
11
9.1
12
8.7
8.7
8.1
* Pollution data source:
https://openaq.org
(ChinaAQIData)
The data is licensed under CC-By 4.0
PM10 179 (Very bad Hazardous)
PM2,5 35 (Unhealthy for Sensitive Groups)
O3 0 (Good)
NO2 0 (Good)
SO2 0 (Good)
Data on air pollution from recent days in Zhongsuozhen
| index | 2022-05-27 |
|---|---|
| pm10 | 56 Unhealthy for Sensitive Groups |
| pm25 | 56 Unhealthy |
| o3 | 0 Good |
| no2 | 0 Good |
| so2 | 0 Good |

| index | 2020-05 | 2020-04 | 2020-03 | 2020-02 | 2020-01 | 2019-12 | 2019-11 | 2019-10 | 2019-09 | 2019-08 | 2019-07 | 2019-06 | 2019-05 | 2019-04 | 2019-03 | 2019-02 | 2019-01 | 2018-12 | 2018-11 | 2018-10 |
|---|---|---|---|---|---|---|---|---|---|---|---|---|---|---|---|---|---|---|---|---|
| pm25 | 36 (Unhealthy for Sensitive Groups) | 32 (Moderate) | 43 (Unhealthy for Sensitive Groups) | 68 (Unhealthy) | 100 (Very Unhealthy) | 99 (Very Unhealthy) | 48 (Unhealthy for Sensitive Groups) | 24 (Moderate) | 27 (Moderate) | 24 (Moderate) | 21 (Moderate) | 30 (Moderate) | 48 (Unhealthy for Sensitive Groups) | 27 (Moderate) | 37 (Unhealthy for Sensitive Groups) | 68 (Unhealthy) | 130 (Very bad Hazardous) | 80 (Very Unhealthy) | 53 (Unhealthy for Sensitive Groups) | 42 (Unhealthy for Sensitive Groups) |
| co | 787 (Good) | 686 (Good) | 841 (Good) | 1 (Good) | 1 (Good) | 1 (Good) | 979 (Good) | 745 (Good) | 677 (Good) | 636 (Good) | 704 (Good) | 848 (Good) | 798 (Good) | 921 (Good) | 1 (Good) | 1 (Good) | 1 (Good) | 1 (Good) | 1 (Good) | 807 (Good) |
| no2 | 26 (Good) | 35 (Good) | 35 (Good) | 21 (Good) | 29 (Good) | 37 (Good) | 30 (Good) | 22 (Good) | 19 (Good) | 15 (Good) | 17 (Good) | 17 (Good) | 23 (Good) | 27 (Good) | 36 (Good) | 30 (Good) | 46 (Moderate) | 33 (Good) | 31 (Good) | 27 (Good) |
| o3 | 147 (Unhealthy for Sensitive Groups) | 116 (Moderate) | 94 (Moderate) | 86 (Moderate) | 60 (Good) | 37 (Good) | 47 (Good) | 60 (Good) | 85 (Moderate) | 115 (Moderate) | 109 (Moderate) | 111 (Moderate) | 114 (Moderate) | 116 (Moderate) | 92 (Moderate) | 79 (Moderate) | 49 (Good) | 37 (Good) | 56 (Good) | 75 (Moderate) |
| pm10 | 69 (Unhealthy for Sensitive Groups) | 57 (Unhealthy for Sensitive Groups) | 81 (Unhealthy) | 83 (Unhealthy) | 111 (Very Unhealthy) | 126 (Very Unhealthy) | 80 (Unhealthy) | 44 (Moderate) | 51 (Unhealthy for Sensitive Groups) | 46 (Moderate) | 38 (Moderate) | 49 (Moderate) | 74 (Unhealthy for Sensitive Groups) | 55 (Unhealthy for Sensitive Groups) | 84 (Unhealthy) | 107 (Unhealthy) | 136 (Very Unhealthy) | 115 (Very Unhealthy) | 75 (Unhealthy for Sensitive Groups) | 67 (Unhealthy for Sensitive Groups) |
| so2 | 12 (Good) | 14 (Good) | 11 (Good) | 8.9 (Good) | 9.9 (Good) | 13 (Good) | 10 (Good) | 8.9 (Good) | 10 (Good) | 10 (Good) | 12 (Good) | 13 (Good) | 16 (Good) | 12 (Good) | 11 (Good) | 9.1 (Good) | 12 (Good) | 8.7 (Good) | 8.7 (Good) | 8.1 (Good) |
PM10 179 (Very bad Hazardous)
particulate matter (PM10) suspended dustPM2,5 35 (Unhealthy for Sensitive Groups)
particulate matter (PM2.5) dustO3 0.04 (Good)
ozone (O3)NO2 0 (Good)
nitrogen dioxide (NO2)SO2 0 (Good)
sulfur dioxide (SO2)南郑大河坎水厂
| index | 2022-05-27 |
|---|---|
| pm10 | 56 |
| pm25 | 56 |
| o3 | 0.03 |
| no2 | 0 |
| so2 | 0 |
南郑大河坎水厂

| index | 2020-05 | 2020-04 | 2020-03 | 2020-02 | 2020-01 | 2019-12 | 2019-11 | 2019-10 | 2019-09 | 2019-08 | 2019-07 | 2019-06 | 2019-05 | 2019-04 | 2019-03 | 2019-02 | 2019-01 | 2018-12 | 2018-11 | 2018-10 |
|---|---|---|---|---|---|---|---|---|---|---|---|---|---|---|---|---|---|---|---|---|
| pm25 | 36 | 32 | 43 | 68 | 100 | 99 | 48 | 24 | 27 | 24 | 21 | 30 | 48 | 27 | 37 | 68 | 130 | 80 | 53 | 42 |
| co | 787 | 686 | 841 | 1 | 1 | 1 | 979 | 745 | 677 | 636 | 704 | 848 | 798 | 921 | 1 | 1 | 1 | 1 | 1 | 807 |
| no2 | 26 | 35 | 35 | 21 | 29 | 37 | 30 | 22 | 19 | 15 | 17 | 17 | 23 | 27 | 36 | 30 | 46 | 33 | 31 | 27 |
| o3 | 147 | 116 | 94 | 86 | 60 | 37 | 47 | 60 | 85 | 115 | 109 | 111 | 114 | 116 | 92 | 79 | 49 | 37 | 56 | 75 |
| pm10 | 69 | 57 | 81 | 83 | 111 | 126 | 80 | 44 | 51 | 46 | 38 | 49 | 74 | 55 | 84 | 107 | 136 | 115 | 75 | 67 |
| so2 | 12 | 14 | 11 | 8.9 | 9.9 | 13 | 10 | 8.9 | 10 | 10 | 12 | 13 | 16 | 12 | 11 | 9.1 | 12 | 8.7 | 8.7 | 8.1 |