Air Pollution in Yaotun: Real-time Air Quality Index and smog alert.
Pollution and air quality forecast for Yaotun. Today is Tuesday, June 16, 2026. The following air pollution values have been recorded for Yaotun:- particulate matter (PM10) suspended dust - 7 (Good)
- particulate matter (PM2.5) dust - 2 (Good)
- carbon monoxide (CO) - 100 (Good)
- nitrogen dioxide (NO2) - 8 (Good)
- ozone (O3) - 0 (Good)
- sulfur dioxide (SO2) - 9 (Good)

What is the air quality in Yaotun today? Is the air polluted in Yaotun?. Is there smog?
What is the level of PM10 today in Yaotun? (particulate matter (PM10) suspended dust)
The current level of particulate matter PM10 in Yaotun is:
7 (Good)
The highest PM10 values usually occur in month: 172 (January 2020).
The lowest value of particulate matter PM10 pollution in Yaotun is usually recorded in: August (36).
What is the current level of PM2.5 in Yaotun? (particulate matter (PM2.5) dust)
Today's PM2.5 level is:
2 (Good)
For comparison, the highest level of PM2.5 in Yaotun in the last 7 days was: 24 (Friday, May 27, 2022) and the lowest: 24 (Friday, May 27, 2022).
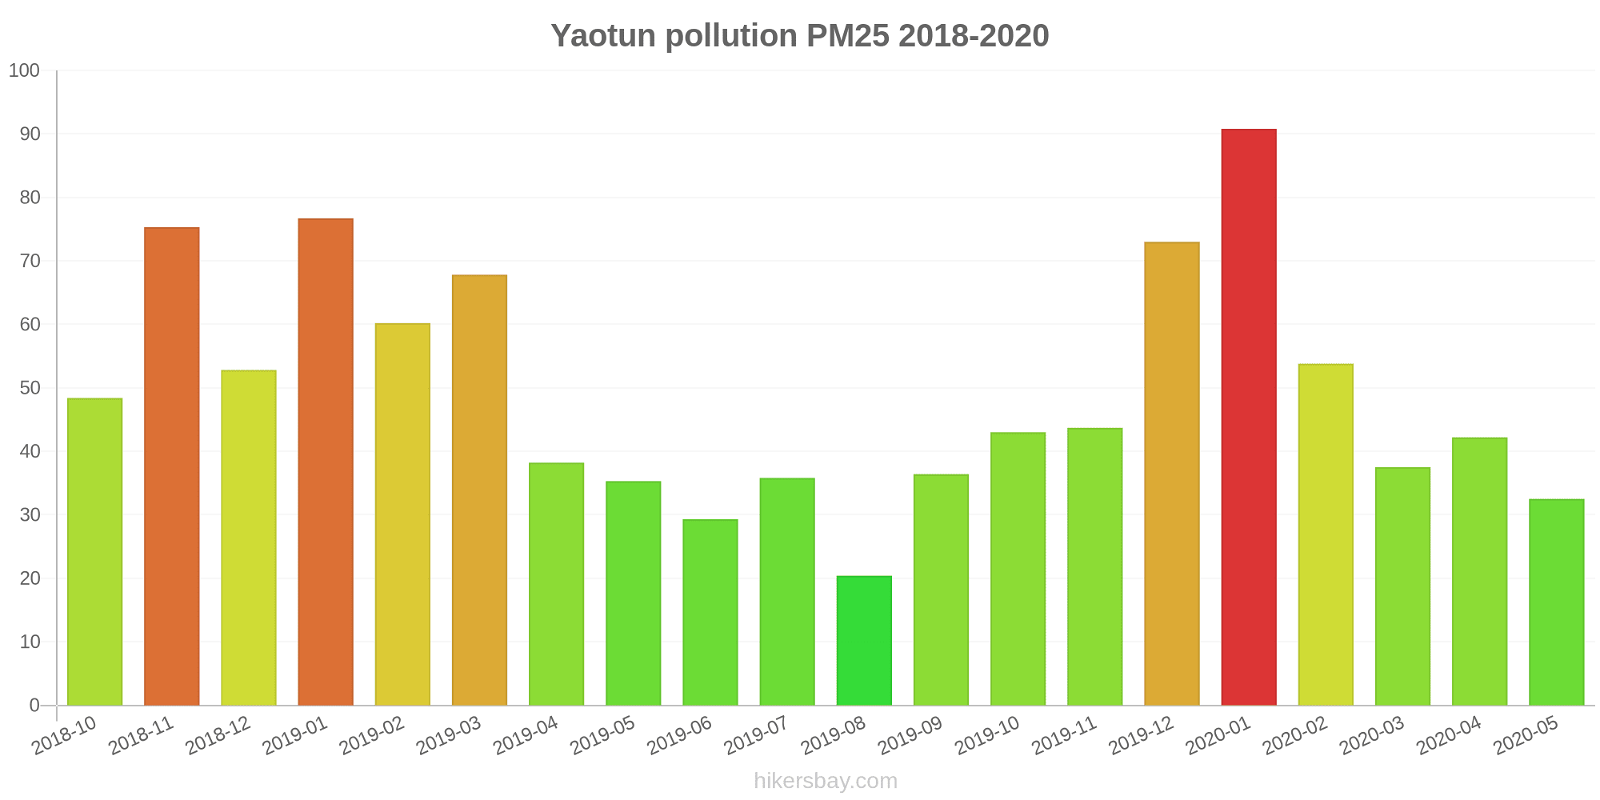
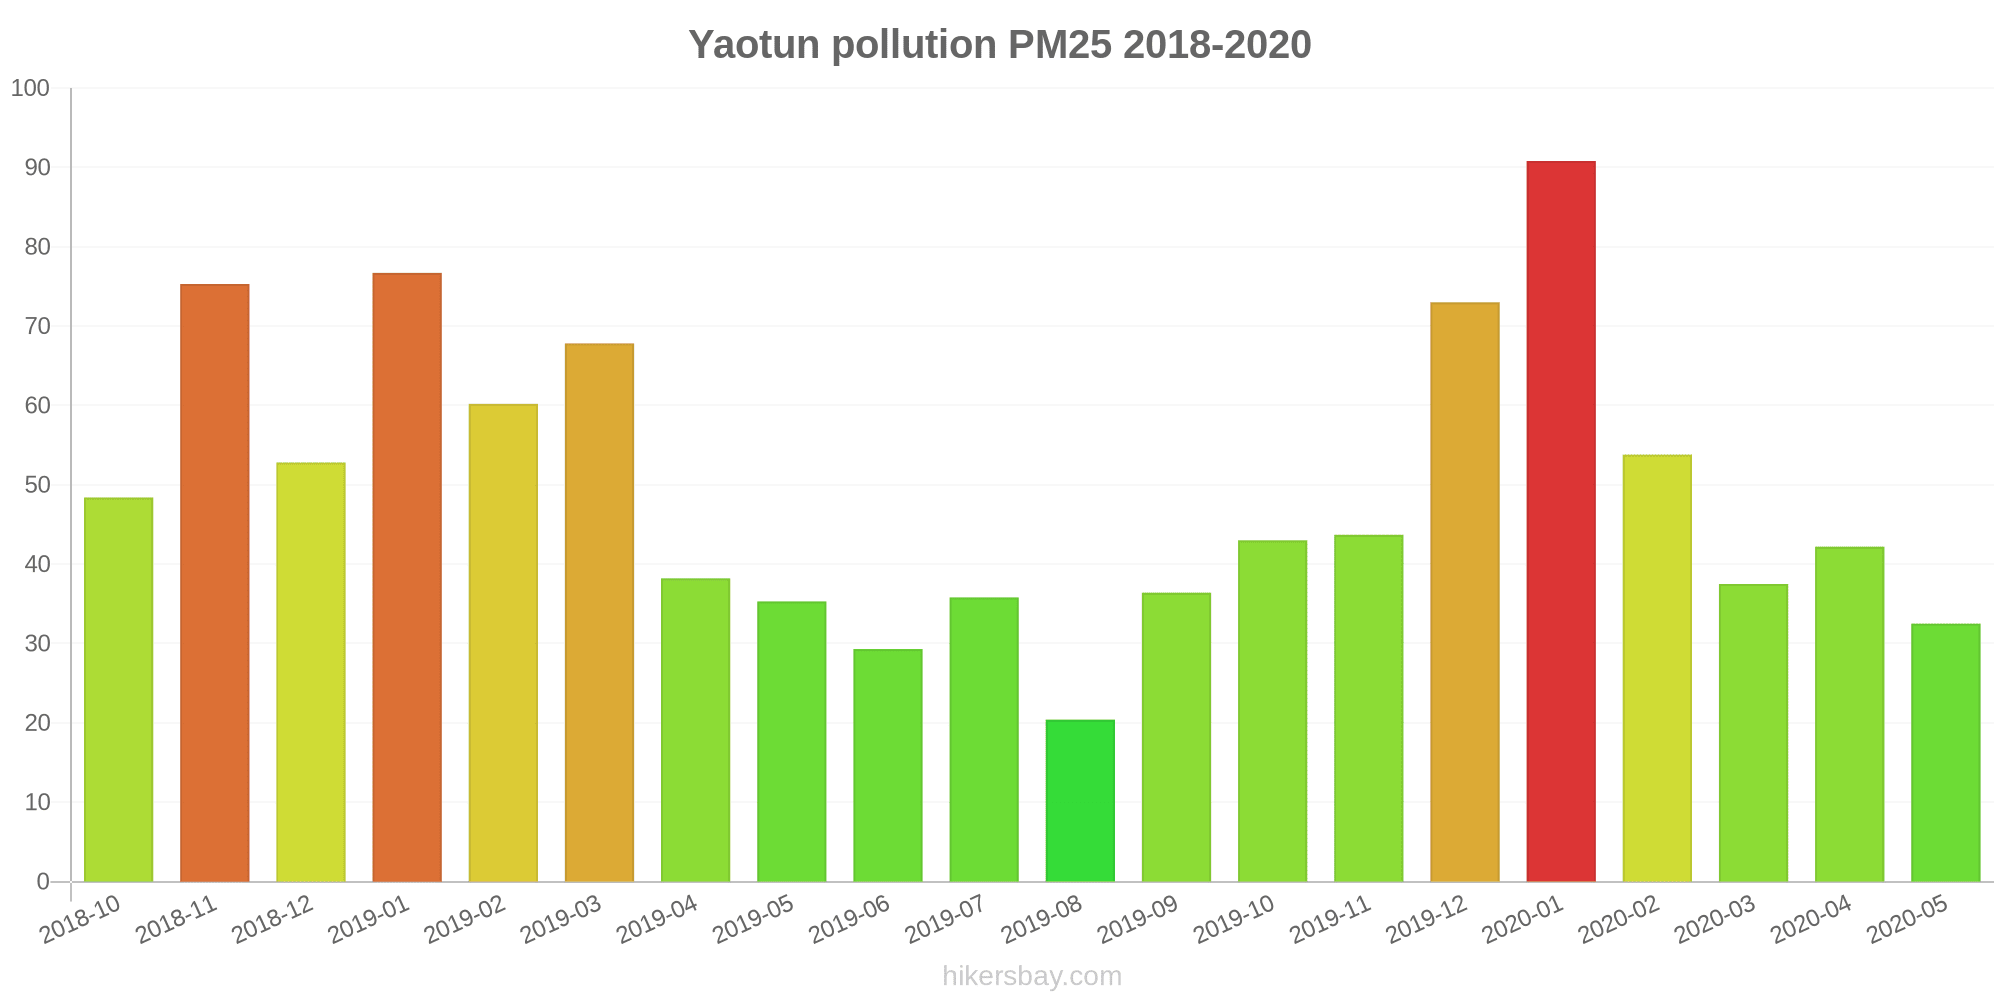
The highest PM2.5 values were recorded: 91 (January 2020).
The lowest level of particulate matter PM2.5 pollution occurs in month: August (20).
How high is the CO level? (carbon monoxide (CO))
100 (Good)
How high is the level of NO2? (nitrogen dioxide (NO2))
8 (Good)
How is the O3 level today in Yaotun? (ozone (O3))
0 (Good)
What is the level of SO2 pollution? (sulfur dioxide (SO2))
9 (Good)
Current data Friday, May 27, 2022, 12:00 PM
PM10 7 (Good)
PM2,5 2 (Good)
CO 100 (Good)
NO2 8 (Good)
O3 0 (Good)
SO2 9 (Good)
Data on air pollution from recent days in Yaotun
index
2022-05-27
pm10
32
Moderate
pm25
24
Moderate
co
468
Good
no2
21
Good
o3
32
Good
so2
5
Good
data source »
Air pollution in Yaotun from October 2018 to May 2020
index
2020-05
2020-04
2020-03
2020-02
2020-01
2019-12
2019-11
2019-10
2019-09
2019-08
2019-07
2019-06
2019-05
2019-04
2019-03
2019-02
2019-01
2018-12
2018-11
2018-10
pm25
33 (Moderate)
42 (Unhealthy for Sensitive Groups)
38 (Unhealthy for Sensitive Groups)
54 (Unhealthy for Sensitive Groups)
91 (Very Unhealthy)
73 (Unhealthy)
44 (Unhealthy for Sensitive Groups)
43 (Unhealthy for Sensitive Groups)
36 (Unhealthy for Sensitive Groups)
20 (Moderate)
36 (Unhealthy for Sensitive Groups)
29 (Moderate)
35 (Unhealthy for Sensitive Groups)
38 (Unhealthy for Sensitive Groups)
68 (Unhealthy)
60 (Unhealthy)
77 (Very Unhealthy)
53 (Unhealthy for Sensitive Groups)
75 (Very Unhealthy)
48 (Unhealthy for Sensitive Groups)
co
681 (Good)
750 (Good)
840 (Good)
1 (Good)
1 (Good)
1 (Good)
1 (Good)
1 (Good)
1 (Good)
663 (Good)
735 (Good)
579 (Good)
692 (Good)
870 (Good)
1 (Good)
1 (Good)
1 (Good)
978 (Good)
1 (Good)
1 (Good)
no2
29 (Good)
29 (Good)
28 (Good)
26 (Good)
43 (Moderate)
45 (Moderate)
37 (Good)
36 (Good)
25 (Good)
20 (Good)
19 (Good)
21 (Good)
24 (Good)
30 (Good)
42 (Moderate)
38 (Good)
50 (Moderate)
31 (Good)
43 (Moderate)
39 (Good)
o3
131 (Unhealthy for Sensitive Groups)
116 (Moderate)
88 (Moderate)
80 (Moderate)
70 (Good)
57 (Good)
65 (Good)
97 (Moderate)
140 (Unhealthy for Sensitive Groups)
111 (Moderate)
159 (Unhealthy)
147 (Unhealthy for Sensitive Groups)
152 (Unhealthy)
114 (Moderate)
93 (Moderate)
83 (Moderate)
62 (Good)
60 (Good)
70 (Moderate)
94 (Moderate)
pm10
58 (Unhealthy for Sensitive Groups)
82 (Unhealthy)
81 (Unhealthy)
106 (Unhealthy)
172 (Very bad Hazardous)
134 (Very Unhealthy)
96 (Unhealthy)
90 (Unhealthy)
72 (Unhealthy for Sensitive Groups)
36 (Moderate)
49 (Moderate)
39 (Moderate)
72 (Unhealthy for Sensitive Groups)
90 (Unhealthy)
105 (Unhealthy)
80 (Unhealthy)
115 (Very Unhealthy)
71 (Unhealthy for Sensitive Groups)
116 (Very Unhealthy)
81 (Unhealthy)
so2
11 (Good)
19 (Good)
21 (Good)
18 (Good)
37 (Good)
40 (Good)
26 (Good)
14 (Good)
12 (Good)
5.5 (Good)
6.3 (Good)
9.1 (Good)
17 (Good)
21 (Good)
29 (Good)
35 (Good)
52 (Moderate)
47 (Good)
40 (Good)
20 (Good)
data source »
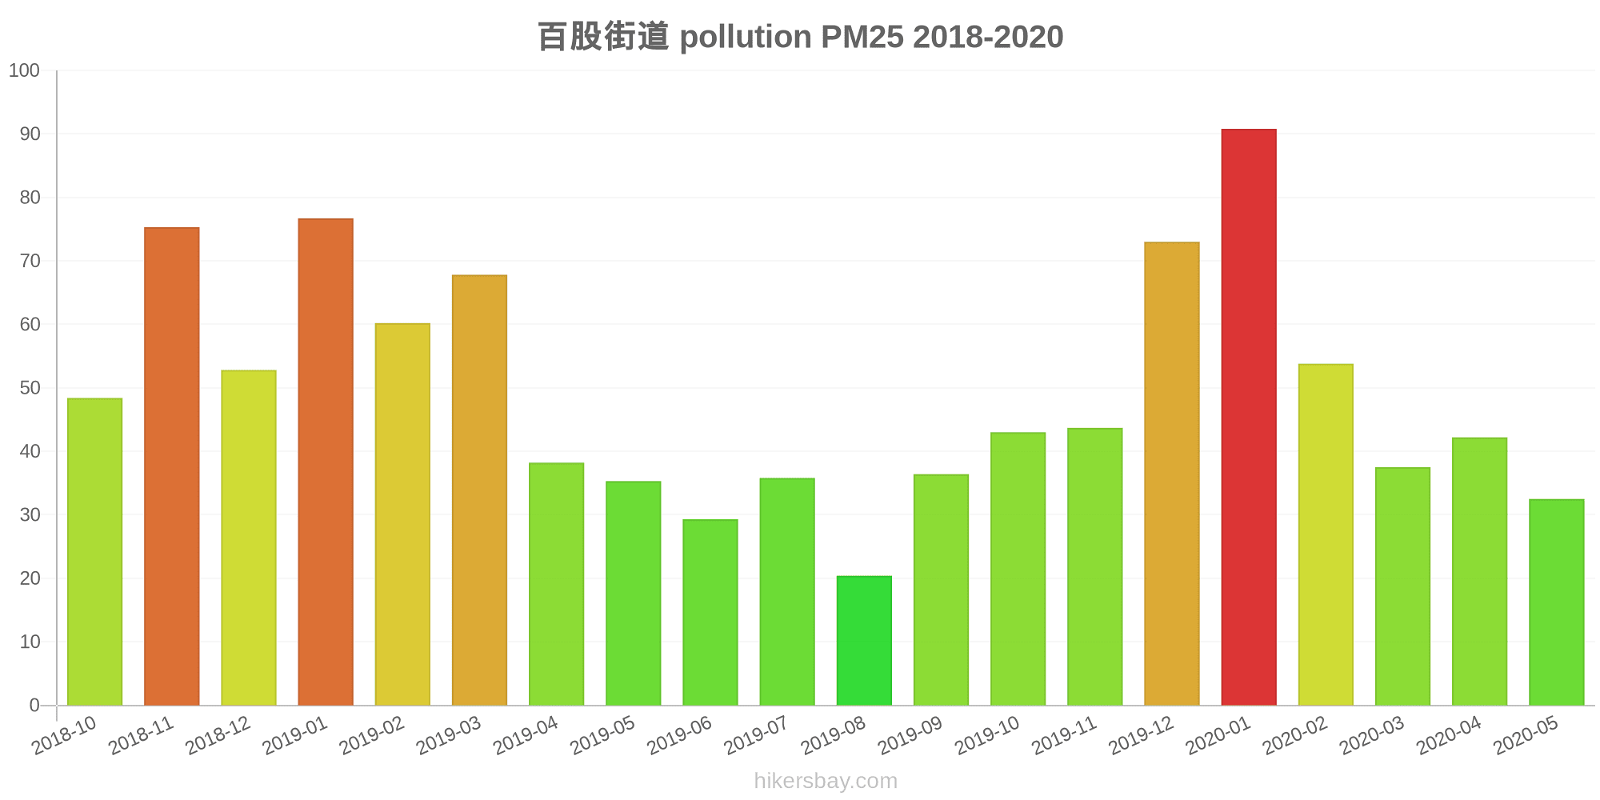
百股街道
Friday, May 27, 2022, 12:00 PM
PM10 6.7 (Good)
particulate matter (PM10) suspended dust
PM2,5 1.7 (Good)
particulate matter (PM2.5) dust
CO 100 (Good)
carbon monoxide (CO)
NO2 7.6 (Good)
nitrogen dioxide (NO2)
O3 0.02 (Good)
ozone (O3)
SO2 8.6 (Good)
sulfur dioxide (SO2)
百股街道
index
2022-05-27
pm10
32
pm25
24
co
468
no2
21
o3
32
so2
4.6
百股街道
2018-10 2020-05
index
2020-05
2020-04
2020-03
2020-02
2020-01
2019-12
2019-11
2019-10
2019-09
2019-08
2019-07
2019-06
2019-05
2019-04
2019-03
2019-02
2019-01
2018-12
2018-11
2018-10
pm25
33
42
38
54
91
73
44
43
36
20
36
29
35
38
68
60
77
53
75
48
co
681
750
840
1
1
1
1
1
1
663
735
579
692
870
1
1
1
978
1
1
no2
29
29
28
26
43
45
37
36
25
20
19
21
24
30
42
38
50
31
43
39
o3
131
116
88
80
70
57
65
97
140
111
159
147
152
114
93
83
62
60
70
94
pm10
58
82
81
106
172
134
96
90
72
36
49
39
72
90
105
80
115
71
116
81
so2
11
19
21
18
37
40
26
14
12
5.5
6.3
9.1
17
21
29
35
52
47
40
20
* Pollution data source:
https://openaq.org
(ChinaAQIData)
The data is licensed under CC-By 4.0
PM10 7 (Good)
PM2,5 2 (Good)
CO 100 (Good)
NO2 8 (Good)
O3 0 (Good)
SO2 9 (Good)
Data on air pollution from recent days in Yaotun
| index | 2022-05-27 |
|---|---|
| pm10 | 32 Moderate |
| pm25 | 24 Moderate |
| co | 468 Good |
| no2 | 21 Good |
| o3 | 32 Good |
| so2 | 5 Good |
| index | 2020-05 | 2020-04 | 2020-03 | 2020-02 | 2020-01 | 2019-12 | 2019-11 | 2019-10 | 2019-09 | 2019-08 | 2019-07 | 2019-06 | 2019-05 | 2019-04 | 2019-03 | 2019-02 | 2019-01 | 2018-12 | 2018-11 | 2018-10 |
|---|---|---|---|---|---|---|---|---|---|---|---|---|---|---|---|---|---|---|---|---|
| pm25 | 33 (Moderate) | 42 (Unhealthy for Sensitive Groups) | 38 (Unhealthy for Sensitive Groups) | 54 (Unhealthy for Sensitive Groups) | 91 (Very Unhealthy) | 73 (Unhealthy) | 44 (Unhealthy for Sensitive Groups) | 43 (Unhealthy for Sensitive Groups) | 36 (Unhealthy for Sensitive Groups) | 20 (Moderate) | 36 (Unhealthy for Sensitive Groups) | 29 (Moderate) | 35 (Unhealthy for Sensitive Groups) | 38 (Unhealthy for Sensitive Groups) | 68 (Unhealthy) | 60 (Unhealthy) | 77 (Very Unhealthy) | 53 (Unhealthy for Sensitive Groups) | 75 (Very Unhealthy) | 48 (Unhealthy for Sensitive Groups) |
| co | 681 (Good) | 750 (Good) | 840 (Good) | 1 (Good) | 1 (Good) | 1 (Good) | 1 (Good) | 1 (Good) | 1 (Good) | 663 (Good) | 735 (Good) | 579 (Good) | 692 (Good) | 870 (Good) | 1 (Good) | 1 (Good) | 1 (Good) | 978 (Good) | 1 (Good) | 1 (Good) |
| no2 | 29 (Good) | 29 (Good) | 28 (Good) | 26 (Good) | 43 (Moderate) | 45 (Moderate) | 37 (Good) | 36 (Good) | 25 (Good) | 20 (Good) | 19 (Good) | 21 (Good) | 24 (Good) | 30 (Good) | 42 (Moderate) | 38 (Good) | 50 (Moderate) | 31 (Good) | 43 (Moderate) | 39 (Good) |
| o3 | 131 (Unhealthy for Sensitive Groups) | 116 (Moderate) | 88 (Moderate) | 80 (Moderate) | 70 (Good) | 57 (Good) | 65 (Good) | 97 (Moderate) | 140 (Unhealthy for Sensitive Groups) | 111 (Moderate) | 159 (Unhealthy) | 147 (Unhealthy for Sensitive Groups) | 152 (Unhealthy) | 114 (Moderate) | 93 (Moderate) | 83 (Moderate) | 62 (Good) | 60 (Good) | 70 (Moderate) | 94 (Moderate) |
| pm10 | 58 (Unhealthy for Sensitive Groups) | 82 (Unhealthy) | 81 (Unhealthy) | 106 (Unhealthy) | 172 (Very bad Hazardous) | 134 (Very Unhealthy) | 96 (Unhealthy) | 90 (Unhealthy) | 72 (Unhealthy for Sensitive Groups) | 36 (Moderate) | 49 (Moderate) | 39 (Moderate) | 72 (Unhealthy for Sensitive Groups) | 90 (Unhealthy) | 105 (Unhealthy) | 80 (Unhealthy) | 115 (Very Unhealthy) | 71 (Unhealthy for Sensitive Groups) | 116 (Very Unhealthy) | 81 (Unhealthy) |
| so2 | 11 (Good) | 19 (Good) | 21 (Good) | 18 (Good) | 37 (Good) | 40 (Good) | 26 (Good) | 14 (Good) | 12 (Good) | 5.5 (Good) | 6.3 (Good) | 9.1 (Good) | 17 (Good) | 21 (Good) | 29 (Good) | 35 (Good) | 52 (Moderate) | 47 (Good) | 40 (Good) | 20 (Good) |
PM10 6.7 (Good)
particulate matter (PM10) suspended dustPM2,5 1.7 (Good)
particulate matter (PM2.5) dustCO 100 (Good)
carbon monoxide (CO)NO2 7.6 (Good)
nitrogen dioxide (NO2)O3 0.02 (Good)
ozone (O3)SO2 8.6 (Good)
sulfur dioxide (SO2)百股街道
| index | 2022-05-27 |
|---|---|
| pm10 | 32 |
| pm25 | 24 |
| co | 468 |
| no2 | 21 |
| o3 | 32 |
| so2 | 4.6 |
百股街道

| index | 2020-05 | 2020-04 | 2020-03 | 2020-02 | 2020-01 | 2019-12 | 2019-11 | 2019-10 | 2019-09 | 2019-08 | 2019-07 | 2019-06 | 2019-05 | 2019-04 | 2019-03 | 2019-02 | 2019-01 | 2018-12 | 2018-11 | 2018-10 |
|---|---|---|---|---|---|---|---|---|---|---|---|---|---|---|---|---|---|---|---|---|
| pm25 | 33 | 42 | 38 | 54 | 91 | 73 | 44 | 43 | 36 | 20 | 36 | 29 | 35 | 38 | 68 | 60 | 77 | 53 | 75 | 48 |
| co | 681 | 750 | 840 | 1 | 1 | 1 | 1 | 1 | 1 | 663 | 735 | 579 | 692 | 870 | 1 | 1 | 1 | 978 | 1 | 1 |
| no2 | 29 | 29 | 28 | 26 | 43 | 45 | 37 | 36 | 25 | 20 | 19 | 21 | 24 | 30 | 42 | 38 | 50 | 31 | 43 | 39 |
| o3 | 131 | 116 | 88 | 80 | 70 | 57 | 65 | 97 | 140 | 111 | 159 | 147 | 152 | 114 | 93 | 83 | 62 | 60 | 70 | 94 |
| pm10 | 58 | 82 | 81 | 106 | 172 | 134 | 96 | 90 | 72 | 36 | 49 | 39 | 72 | 90 | 105 | 80 | 115 | 71 | 116 | 81 |
| so2 | 11 | 19 | 21 | 18 | 37 | 40 | 26 | 14 | 12 | 5.5 | 6.3 | 9.1 | 17 | 21 | 29 | 35 | 52 | 47 | 40 | 20 |