Air Pollution in Wangjiayu: Real-time Air Quality Index and smog alert.
Pollution and air quality forecast for Wangjiayu. Today is Sunday, June 21, 2026. The following air pollution values have been recorded for Wangjiayu:- particulate matter (PM10) suspended dust - 7 (Good)
- particulate matter (PM2.5) dust - 2 (Good)
- carbon monoxide (CO) - 100 (Good)
- nitrogen dioxide (NO2) - 8 (Good)
- ozone (O3) - 0 (Good)
- sulfur dioxide (SO2) - 9 (Good)

What is the air quality in Wangjiayu today? Is the air polluted in Wangjiayu?. Is there smog?
What is the level of PM10 today in Wangjiayu? (particulate matter (PM10) suspended dust)
The current level of particulate matter PM10 in Wangjiayu is:
7 (Good)
The highest PM10 values usually occur in month: 130 (January 2020).
The lowest value of particulate matter PM10 pollution in Wangjiayu is usually recorded in: August (31).
What is the current level of PM2.5 in Wangjiayu? (particulate matter (PM2.5) dust)
Today's PM2.5 level is:
2 (Good)
For comparison, the highest level of PM2.5 in Wangjiayu in the last 7 days was: 24 (Friday, May 27, 2022) and the lowest: 24 (Friday, May 27, 2022).
The highest PM2.5 values were recorded: 107 (January 2020).
The lowest level of particulate matter PM2.5 pollution occurs in month: August (17).
How high is the CO level? (carbon monoxide (CO))
100 (Good)
How high is the level of NO2? (nitrogen dioxide (NO2))
8 (Good)
How is the O3 level today in Wangjiayu? (ozone (O3))
0 (Good)
What is the level of SO2 pollution? (sulfur dioxide (SO2))
9 (Good)
Current data Friday, May 27, 2022, 12:00 PM
PM10 7 (Good)
PM2,5 2 (Good)
CO 100 (Good)
NO2 8 (Good)
O3 0 (Good)
SO2 9 (Good)
Data on air pollution from recent days in Wangjiayu
index
2022-05-27
pm10
32
Moderate
pm25
24
Moderate
co
468
Good
no2
21
Good
o3
32
Good
so2
5
Good
data source »
Air pollution in Wangjiayu from October 2018 to May 2020
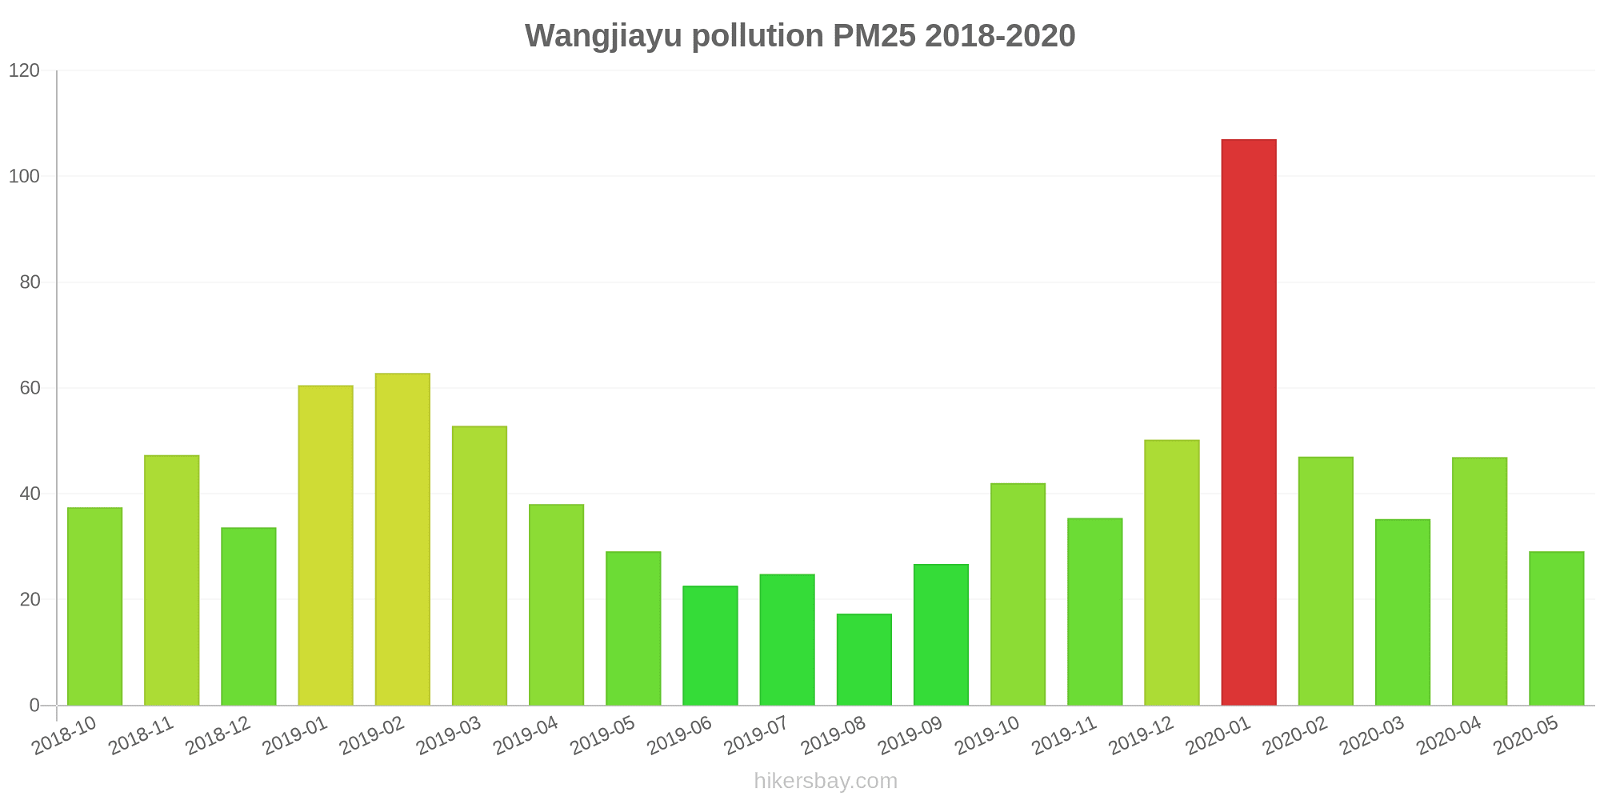
index
2020-05
2020-04
2020-03
2020-02
2020-01
2019-12
2019-11
2019-10
2019-09
2019-08
2019-07
2019-06
2019-05
2019-04
2019-03
2019-02
2019-01
2018-12
2018-11
2018-10
pm25
29 (Moderate)
47 (Unhealthy for Sensitive Groups)
35 (Unhealthy for Sensitive Groups)
47 (Unhealthy for Sensitive Groups)
107 (Very Unhealthy)
50 (Unhealthy for Sensitive Groups)
35 (Unhealthy for Sensitive Groups)
42 (Unhealthy for Sensitive Groups)
27 (Moderate)
17 (Moderate)
25 (Moderate)
23 (Moderate)
29 (Moderate)
38 (Unhealthy for Sensitive Groups)
53 (Unhealthy for Sensitive Groups)
63 (Unhealthy)
61 (Unhealthy)
34 (Moderate)
47 (Unhealthy for Sensitive Groups)
37 (Unhealthy for Sensitive Groups)
co
892 (Good)
1 (Good)
862 (Good)
1 (Good)
1 (Good)
1 (Good)
1 (Good)
979 (Good)
805 (Good)
854 (Good)
960 (Good)
808 (Good)
865 (Good)
966 (Good)
1 (Good)
1 (Good)
1 (Good)
990 (Good)
1 (Good)
1 (Good)
no2
19 (Good)
24 (Good)
20 (Good)
21 (Good)
45 (Moderate)
33 (Good)
35 (Good)
30 (Good)
22 (Good)
15 (Good)
13 (Good)
18 (Good)
19 (Good)
24 (Good)
27 (Good)
31 (Good)
44 (Moderate)
28 (Good)
36 (Good)
30 (Good)
o3
129 (Unhealthy for Sensitive Groups)
130 (Unhealthy for Sensitive Groups)
100 (Moderate)
80 (Moderate)
67 (Good)
63 (Good)
65 (Good)
104 (Moderate)
129 (Unhealthy for Sensitive Groups)
114 (Moderate)
169 (Unhealthy)
150 (Unhealthy)
151 (Unhealthy)
123 (Unhealthy for Sensitive Groups)
107 (Moderate)
85 (Moderate)
63 (Good)
56 (Good)
66 (Good)
87 (Moderate)
pm10
65 (Unhealthy for Sensitive Groups)
108 (Unhealthy)
72 (Unhealthy for Sensitive Groups)
65 (Unhealthy for Sensitive Groups)
130 (Very Unhealthy)
76 (Unhealthy for Sensitive Groups)
63 (Unhealthy for Sensitive Groups)
76 (Unhealthy for Sensitive Groups)
51 (Unhealthy for Sensitive Groups)
31 (Moderate)
39 (Moderate)
38 (Moderate)
65 (Unhealthy for Sensitive Groups)
92 (Unhealthy)
93 (Unhealthy)
97 (Unhealthy)
113 (Very Unhealthy)
59 (Unhealthy for Sensitive Groups)
76 (Unhealthy for Sensitive Groups)
62 (Unhealthy for Sensitive Groups)
so2
14 (Good)
18 (Good)
15 (Good)
16 (Good)
27 (Good)
17 (Good)
20 (Good)
15 (Good)
12 (Good)
11 (Good)
9.1 (Good)
11 (Good)
16 (Good)
16 (Good)
23 (Good)
31 (Good)
34 (Good)
22 (Good)
20 (Good)
19 (Good)
data source »
深沟寺
Friday, May 27, 2022, 12:00 PM
PM10 6.7 (Good)
particulate matter (PM10) suspended dust
PM2,5 1.7 (Good)
particulate matter (PM2.5) dust
CO 100 (Good)
carbon monoxide (CO)
NO2 7.6 (Good)
nitrogen dioxide (NO2)
O3 0.02 (Good)
ozone (O3)
SO2 8.6 (Good)
sulfur dioxide (SO2)
深沟寺
index
2022-05-27
pm10
32
pm25
24
co
468
no2
21
o3
32
so2
4.6
深沟寺
2018-10 2020-05

index
2020-05
2020-04
2020-03
2020-02
2020-01
2019-12
2019-11
2019-10
2019-09
2019-08
2019-07
2019-06
2019-05
2019-04
2019-03
2019-02
2019-01
2018-12
2018-11
2018-10
pm25
29
47
35
47
107
50
35
42
27
17
25
23
29
38
53
63
61
34
47
37
co
892
1
862
1
1
1
1
979
805
854
960
808
865
966
1
1
1
990
1
1
no2
19
24
20
21
45
33
35
30
22
15
13
18
19
24
27
31
44
28
36
30
o3
129
130
100
80
67
63
65
104
129
114
169
150
151
123
107
85
63
56
66
87
pm10
65
108
72
65
130
76
63
76
51
31
39
38
65
92
93
97
113
59
76
62
so2
14
18
15
16
27
17
20
15
12
11
9.1
11
16
16
23
31
34
22
20
19
* Pollution data source:
https://openaq.org
(ChinaAQIData)
The data is licensed under CC-By 4.0
PM10 7 (Good)
PM2,5 2 (Good)
CO 100 (Good)
NO2 8 (Good)
O3 0 (Good)
SO2 9 (Good)
Data on air pollution from recent days in Wangjiayu
| index | 2022-05-27 |
|---|---|
| pm10 | 32 Moderate |
| pm25 | 24 Moderate |
| co | 468 Good |
| no2 | 21 Good |
| o3 | 32 Good |
| so2 | 5 Good |

| index | 2020-05 | 2020-04 | 2020-03 | 2020-02 | 2020-01 | 2019-12 | 2019-11 | 2019-10 | 2019-09 | 2019-08 | 2019-07 | 2019-06 | 2019-05 | 2019-04 | 2019-03 | 2019-02 | 2019-01 | 2018-12 | 2018-11 | 2018-10 |
|---|---|---|---|---|---|---|---|---|---|---|---|---|---|---|---|---|---|---|---|---|
| pm25 | 29 (Moderate) | 47 (Unhealthy for Sensitive Groups) | 35 (Unhealthy for Sensitive Groups) | 47 (Unhealthy for Sensitive Groups) | 107 (Very Unhealthy) | 50 (Unhealthy for Sensitive Groups) | 35 (Unhealthy for Sensitive Groups) | 42 (Unhealthy for Sensitive Groups) | 27 (Moderate) | 17 (Moderate) | 25 (Moderate) | 23 (Moderate) | 29 (Moderate) | 38 (Unhealthy for Sensitive Groups) | 53 (Unhealthy for Sensitive Groups) | 63 (Unhealthy) | 61 (Unhealthy) | 34 (Moderate) | 47 (Unhealthy for Sensitive Groups) | 37 (Unhealthy for Sensitive Groups) |
| co | 892 (Good) | 1 (Good) | 862 (Good) | 1 (Good) | 1 (Good) | 1 (Good) | 1 (Good) | 979 (Good) | 805 (Good) | 854 (Good) | 960 (Good) | 808 (Good) | 865 (Good) | 966 (Good) | 1 (Good) | 1 (Good) | 1 (Good) | 990 (Good) | 1 (Good) | 1 (Good) |
| no2 | 19 (Good) | 24 (Good) | 20 (Good) | 21 (Good) | 45 (Moderate) | 33 (Good) | 35 (Good) | 30 (Good) | 22 (Good) | 15 (Good) | 13 (Good) | 18 (Good) | 19 (Good) | 24 (Good) | 27 (Good) | 31 (Good) | 44 (Moderate) | 28 (Good) | 36 (Good) | 30 (Good) |
| o3 | 129 (Unhealthy for Sensitive Groups) | 130 (Unhealthy for Sensitive Groups) | 100 (Moderate) | 80 (Moderate) | 67 (Good) | 63 (Good) | 65 (Good) | 104 (Moderate) | 129 (Unhealthy for Sensitive Groups) | 114 (Moderate) | 169 (Unhealthy) | 150 (Unhealthy) | 151 (Unhealthy) | 123 (Unhealthy for Sensitive Groups) | 107 (Moderate) | 85 (Moderate) | 63 (Good) | 56 (Good) | 66 (Good) | 87 (Moderate) |
| pm10 | 65 (Unhealthy for Sensitive Groups) | 108 (Unhealthy) | 72 (Unhealthy for Sensitive Groups) | 65 (Unhealthy for Sensitive Groups) | 130 (Very Unhealthy) | 76 (Unhealthy for Sensitive Groups) | 63 (Unhealthy for Sensitive Groups) | 76 (Unhealthy for Sensitive Groups) | 51 (Unhealthy for Sensitive Groups) | 31 (Moderate) | 39 (Moderate) | 38 (Moderate) | 65 (Unhealthy for Sensitive Groups) | 92 (Unhealthy) | 93 (Unhealthy) | 97 (Unhealthy) | 113 (Very Unhealthy) | 59 (Unhealthy for Sensitive Groups) | 76 (Unhealthy for Sensitive Groups) | 62 (Unhealthy for Sensitive Groups) |
| so2 | 14 (Good) | 18 (Good) | 15 (Good) | 16 (Good) | 27 (Good) | 17 (Good) | 20 (Good) | 15 (Good) | 12 (Good) | 11 (Good) | 9.1 (Good) | 11 (Good) | 16 (Good) | 16 (Good) | 23 (Good) | 31 (Good) | 34 (Good) | 22 (Good) | 20 (Good) | 19 (Good) |
PM10 6.7 (Good)
particulate matter (PM10) suspended dustPM2,5 1.7 (Good)
particulate matter (PM2.5) dustCO 100 (Good)
carbon monoxide (CO)NO2 7.6 (Good)
nitrogen dioxide (NO2)O3 0.02 (Good)
ozone (O3)SO2 8.6 (Good)
sulfur dioxide (SO2)深沟寺
| index | 2022-05-27 |
|---|---|
| pm10 | 32 |
| pm25 | 24 |
| co | 468 |
| no2 | 21 |
| o3 | 32 |
| so2 | 4.6 |
深沟寺

| index | 2020-05 | 2020-04 | 2020-03 | 2020-02 | 2020-01 | 2019-12 | 2019-11 | 2019-10 | 2019-09 | 2019-08 | 2019-07 | 2019-06 | 2019-05 | 2019-04 | 2019-03 | 2019-02 | 2019-01 | 2018-12 | 2018-11 | 2018-10 |
|---|---|---|---|---|---|---|---|---|---|---|---|---|---|---|---|---|---|---|---|---|
| pm25 | 29 | 47 | 35 | 47 | 107 | 50 | 35 | 42 | 27 | 17 | 25 | 23 | 29 | 38 | 53 | 63 | 61 | 34 | 47 | 37 |
| co | 892 | 1 | 862 | 1 | 1 | 1 | 1 | 979 | 805 | 854 | 960 | 808 | 865 | 966 | 1 | 1 | 1 | 990 | 1 | 1 |
| no2 | 19 | 24 | 20 | 21 | 45 | 33 | 35 | 30 | 22 | 15 | 13 | 18 | 19 | 24 | 27 | 31 | 44 | 28 | 36 | 30 |
| o3 | 129 | 130 | 100 | 80 | 67 | 63 | 65 | 104 | 129 | 114 | 169 | 150 | 151 | 123 | 107 | 85 | 63 | 56 | 66 | 87 |
| pm10 | 65 | 108 | 72 | 65 | 130 | 76 | 63 | 76 | 51 | 31 | 39 | 38 | 65 | 92 | 93 | 97 | 113 | 59 | 76 | 62 |
| so2 | 14 | 18 | 15 | 16 | 27 | 17 | 20 | 15 | 12 | 11 | 9.1 | 11 | 16 | 16 | 23 | 31 | 34 | 22 | 20 | 19 |