Air Pollution in Hujiawan: Real-time Air Quality Index and smog alert.
Pollution and air quality forecast for Hujiawan. Today is Tuesday, June 2, 2026. The following air pollution values have been recorded for Hujiawan:- particulate matter (PM10) suspended dust - 179 (Very bad Hazardous)
- particulate matter (PM2.5) dust - 35 (Unhealthy for Sensitive Groups)
- ozone (O3) - 0 (Good)
- nitrogen dioxide (NO2) - 0 (Good)
- sulfur dioxide (SO2) - 0 (Good)

What is the air quality in Hujiawan today? Is the air polluted in Hujiawan?. Is there smog?
What is the level of PM10 today in Hujiawan? (particulate matter (PM10) suspended dust)
The current level of particulate matter PM10 in Hujiawan is:
179 (Very bad Hazardous)
The highest PM10 values usually occur in month: 138 (December 2018).
The lowest value of particulate matter PM10 pollution in Hujiawan is usually recorded in: July (33).
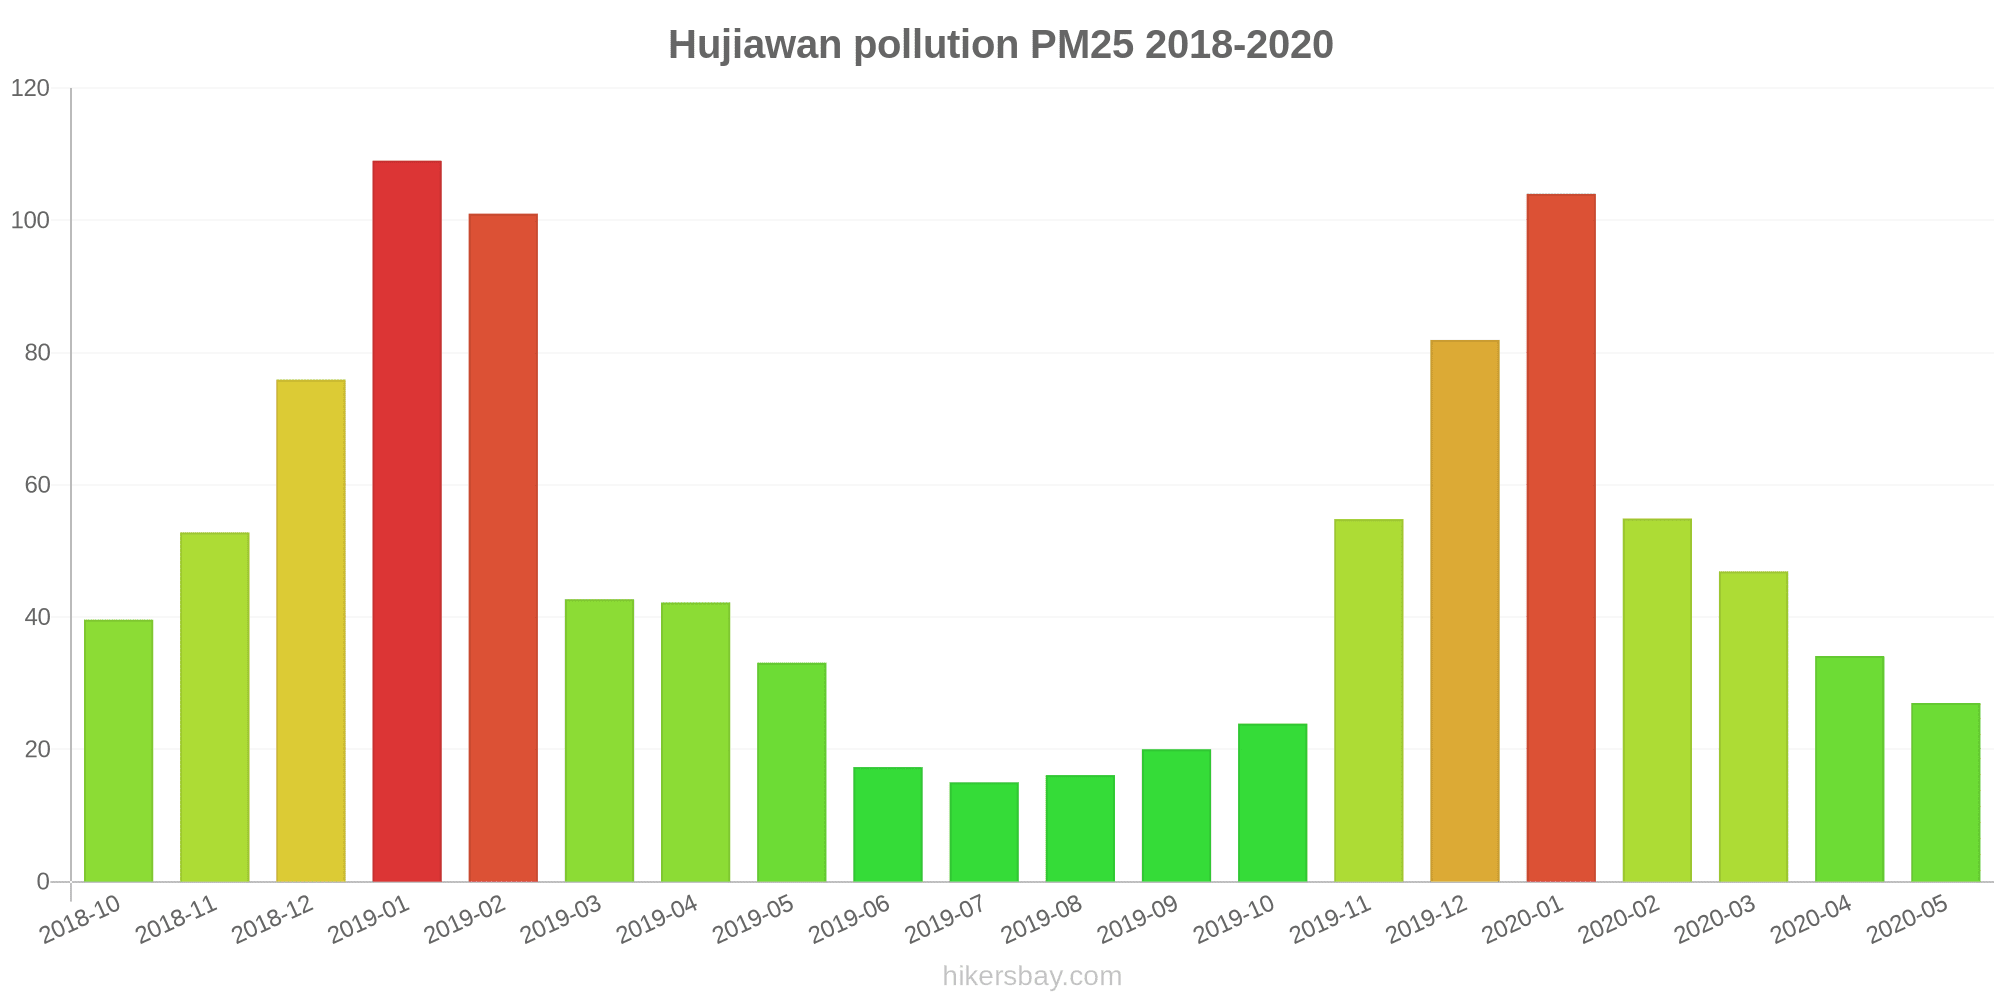
What is the current level of PM2.5 in Hujiawan? (particulate matter (PM2.5) dust)
Today's PM2.5 level is:
35 (Unhealthy for Sensitive Groups)
For comparison, the highest level of PM2.5 in Hujiawan in the last 7 days was: 56 (Friday, May 27, 2022) and the lowest: 56 (Friday, May 27, 2022).
The highest PM2.5 values were recorded: 109 (January 2019).
The lowest level of particulate matter PM2.5 pollution occurs in month: July (15).
How is the O3 level today in Hujiawan? (ozone (O3))
0 (Good)
How high is the level of NO2? (nitrogen dioxide (NO2))
0 (Good)
What is the level of SO2 pollution? (sulfur dioxide (SO2))
0 (Good)
Current data Friday, May 27, 2022, 12:00 PM
PM10 179 (Very bad Hazardous)
PM2,5 35 (Unhealthy for Sensitive Groups)
O3 0 (Good)
NO2 0 (Good)
SO2 0 (Good)
Data on air pollution from recent days in Hujiawan
index
2022-05-27
pm10
56
Unhealthy for Sensitive Groups
pm25
56
Unhealthy
o3
0
Good
no2
0
Good
so2
0
Good
data source »
Air pollution in Hujiawan from October 2018 to May 2020

index
2020-05
2020-04
2020-03
2020-02
2020-01
2019-12
2019-11
2019-10
2019-09
2019-08
2019-07
2019-06
2019-05
2019-04
2019-03
2019-02
2019-01
2018-12
2018-11
2018-10
pm25
27 (Moderate)
34 (Moderate)
47 (Unhealthy for Sensitive Groups)
55 (Unhealthy for Sensitive Groups)
104 (Very Unhealthy)
82 (Very Unhealthy)
55 (Unhealthy for Sensitive Groups)
24 (Moderate)
20 (Moderate)
16 (Moderate)
15 (Moderate)
17 (Moderate)
33 (Moderate)
42 (Unhealthy for Sensitive Groups)
43 (Unhealthy for Sensitive Groups)
101 (Very Unhealthy)
109 (Very Unhealthy)
76 (Very Unhealthy)
53 (Unhealthy for Sensitive Groups)
40 (Unhealthy for Sensitive Groups)
co
518 (Good)
454 (Good)
510 (Good)
734 (Good)
1 (Good)
781 (Good)
735 (Good)
514 (Good)
493 (Good)
467 (Good)
461 (Good)
536 (Good)
575 (Good)
826 (Good)
667 (Good)
1 (Good)
970 (Good)
748 (Good)
536 (Good)
369 (Good)
no2
17 (Good)
25 (Good)
31 (Good)
20 (Good)
32 (Good)
41 (Moderate)
31 (Good)
24 (Good)
20 (Good)
19 (Good)
15 (Good)
13 (Good)
18 (Good)
23 (Good)
31 (Good)
22 (Good)
38 (Good)
38 (Good)
35 (Good)
32 (Good)
o3
128 (Unhealthy for Sensitive Groups)
131 (Unhealthy for Sensitive Groups)
107 (Moderate)
94 (Moderate)
68 (Good)
66 (Good)
63 (Good)
77 (Moderate)
113 (Moderate)
133 (Unhealthy for Sensitive Groups)
137 (Unhealthy for Sensitive Groups)
127 (Unhealthy for Sensitive Groups)
121 (Unhealthy for Sensitive Groups)
119 (Moderate)
108 (Moderate)
86 (Moderate)
80 (Moderate)
58 (Good)
69 (Good)
87 (Moderate)
pm10
64 (Unhealthy for Sensitive Groups)
67 (Unhealthy for Sensitive Groups)
104 (Unhealthy)
79 (Unhealthy for Sensitive Groups)
115 (Very Unhealthy)
114 (Very Unhealthy)
108 (Unhealthy)
58 (Unhealthy for Sensitive Groups)
40 (Moderate)
38 (Moderate)
33 (Moderate)
37 (Moderate)
88 (Unhealthy)
74 (Unhealthy for Sensitive Groups)
87 (Unhealthy)
130 (Very Unhealthy)
132 (Very Unhealthy)
138 (Very Unhealthy)
107 (Unhealthy)
76 (Unhealthy for Sensitive Groups)
so2
5.8 (Good)
6.4 (Good)
6.7 (Good)
7.4 (Good)
9.3 (Good)
8.7 (Good)
6.5 (Good)
4.9 (Good)
5.1 (Good)
5.8 (Good)
4.8 (Good)
4.4 (Good)
5.7 (Good)
5.4 (Good)
6.2 (Good)
8.4 (Good)
10 (Good)
9.8 (Good)
6.7 (Good)
5.6 (Good)
data source »
竹园沟
Friday, May 27, 2022, 12:00 PM
PM10 179 (Very bad Hazardous)
particulate matter (PM10) suspended dust
PM2,5 35 (Unhealthy for Sensitive Groups)
particulate matter (PM2.5) dust
O3 0.04 (Good)
ozone (O3)
NO2 0 (Good)
nitrogen dioxide (NO2)
SO2 0 (Good)
sulfur dioxide (SO2)
竹园沟
index
2022-05-27
pm10
56
pm25
56
o3
0.03
no2
0
so2
0
竹园沟
2018-10 2020-05

index
2020-05
2020-04
2020-03
2020-02
2020-01
2019-12
2019-11
2019-10
2019-09
2019-08
2019-07
2019-06
2019-05
2019-04
2019-03
2019-02
2019-01
2018-12
2018-11
2018-10
pm25
27
34
47
55
104
82
55
24
20
16
15
17
33
42
43
101
109
76
53
40
co
518
454
510
734
1
781
735
514
493
467
461
536
575
826
667
1
970
748
536
369
no2
17
25
31
20
32
41
31
24
20
19
15
13
18
23
31
22
38
38
35
32
o3
128
131
107
94
68
66
63
77
113
133
137
127
121
119
108
86
80
58
69
87
pm10
64
67
104
79
115
114
108
58
40
38
33
37
88
74
87
130
132
138
107
76
so2
5.8
6.4
6.7
7.4
9.3
8.7
6.5
4.9
5.1
5.8
4.8
4.4
5.7
5.4
6.2
8.4
10
9.8
6.7
5.6
* Pollution data source:
https://openaq.org
(ChinaAQIData)
The data is licensed under CC-By 4.0
PM10 179 (Very bad Hazardous)
PM2,5 35 (Unhealthy for Sensitive Groups)
O3 0 (Good)
NO2 0 (Good)
SO2 0 (Good)
Data on air pollution from recent days in Hujiawan
| index | 2022-05-27 |
|---|---|
| pm10 | 56 Unhealthy for Sensitive Groups |
| pm25 | 56 Unhealthy |
| o3 | 0 Good |
| no2 | 0 Good |
| so2 | 0 Good |
| index | 2020-05 | 2020-04 | 2020-03 | 2020-02 | 2020-01 | 2019-12 | 2019-11 | 2019-10 | 2019-09 | 2019-08 | 2019-07 | 2019-06 | 2019-05 | 2019-04 | 2019-03 | 2019-02 | 2019-01 | 2018-12 | 2018-11 | 2018-10 |
|---|---|---|---|---|---|---|---|---|---|---|---|---|---|---|---|---|---|---|---|---|
| pm25 | 27 (Moderate) | 34 (Moderate) | 47 (Unhealthy for Sensitive Groups) | 55 (Unhealthy for Sensitive Groups) | 104 (Very Unhealthy) | 82 (Very Unhealthy) | 55 (Unhealthy for Sensitive Groups) | 24 (Moderate) | 20 (Moderate) | 16 (Moderate) | 15 (Moderate) | 17 (Moderate) | 33 (Moderate) | 42 (Unhealthy for Sensitive Groups) | 43 (Unhealthy for Sensitive Groups) | 101 (Very Unhealthy) | 109 (Very Unhealthy) | 76 (Very Unhealthy) | 53 (Unhealthy for Sensitive Groups) | 40 (Unhealthy for Sensitive Groups) |
| co | 518 (Good) | 454 (Good) | 510 (Good) | 734 (Good) | 1 (Good) | 781 (Good) | 735 (Good) | 514 (Good) | 493 (Good) | 467 (Good) | 461 (Good) | 536 (Good) | 575 (Good) | 826 (Good) | 667 (Good) | 1 (Good) | 970 (Good) | 748 (Good) | 536 (Good) | 369 (Good) |
| no2 | 17 (Good) | 25 (Good) | 31 (Good) | 20 (Good) | 32 (Good) | 41 (Moderate) | 31 (Good) | 24 (Good) | 20 (Good) | 19 (Good) | 15 (Good) | 13 (Good) | 18 (Good) | 23 (Good) | 31 (Good) | 22 (Good) | 38 (Good) | 38 (Good) | 35 (Good) | 32 (Good) |
| o3 | 128 (Unhealthy for Sensitive Groups) | 131 (Unhealthy for Sensitive Groups) | 107 (Moderate) | 94 (Moderate) | 68 (Good) | 66 (Good) | 63 (Good) | 77 (Moderate) | 113 (Moderate) | 133 (Unhealthy for Sensitive Groups) | 137 (Unhealthy for Sensitive Groups) | 127 (Unhealthy for Sensitive Groups) | 121 (Unhealthy for Sensitive Groups) | 119 (Moderate) | 108 (Moderate) | 86 (Moderate) | 80 (Moderate) | 58 (Good) | 69 (Good) | 87 (Moderate) |
| pm10 | 64 (Unhealthy for Sensitive Groups) | 67 (Unhealthy for Sensitive Groups) | 104 (Unhealthy) | 79 (Unhealthy for Sensitive Groups) | 115 (Very Unhealthy) | 114 (Very Unhealthy) | 108 (Unhealthy) | 58 (Unhealthy for Sensitive Groups) | 40 (Moderate) | 38 (Moderate) | 33 (Moderate) | 37 (Moderate) | 88 (Unhealthy) | 74 (Unhealthy for Sensitive Groups) | 87 (Unhealthy) | 130 (Very Unhealthy) | 132 (Very Unhealthy) | 138 (Very Unhealthy) | 107 (Unhealthy) | 76 (Unhealthy for Sensitive Groups) |
| so2 | 5.8 (Good) | 6.4 (Good) | 6.7 (Good) | 7.4 (Good) | 9.3 (Good) | 8.7 (Good) | 6.5 (Good) | 4.9 (Good) | 5.1 (Good) | 5.8 (Good) | 4.8 (Good) | 4.4 (Good) | 5.7 (Good) | 5.4 (Good) | 6.2 (Good) | 8.4 (Good) | 10 (Good) | 9.8 (Good) | 6.7 (Good) | 5.6 (Good) |
PM10 179 (Very bad Hazardous)
particulate matter (PM10) suspended dustPM2,5 35 (Unhealthy for Sensitive Groups)
particulate matter (PM2.5) dustO3 0.04 (Good)
ozone (O3)NO2 0 (Good)
nitrogen dioxide (NO2)SO2 0 (Good)
sulfur dioxide (SO2)竹园沟
| index | 2022-05-27 |
|---|---|
| pm10 | 56 |
| pm25 | 56 |
| o3 | 0.03 |
| no2 | 0 |
| so2 | 0 |
竹园沟

| index | 2020-05 | 2020-04 | 2020-03 | 2020-02 | 2020-01 | 2019-12 | 2019-11 | 2019-10 | 2019-09 | 2019-08 | 2019-07 | 2019-06 | 2019-05 | 2019-04 | 2019-03 | 2019-02 | 2019-01 | 2018-12 | 2018-11 | 2018-10 |
|---|---|---|---|---|---|---|---|---|---|---|---|---|---|---|---|---|---|---|---|---|
| pm25 | 27 | 34 | 47 | 55 | 104 | 82 | 55 | 24 | 20 | 16 | 15 | 17 | 33 | 42 | 43 | 101 | 109 | 76 | 53 | 40 |
| co | 518 | 454 | 510 | 734 | 1 | 781 | 735 | 514 | 493 | 467 | 461 | 536 | 575 | 826 | 667 | 1 | 970 | 748 | 536 | 369 |
| no2 | 17 | 25 | 31 | 20 | 32 | 41 | 31 | 24 | 20 | 19 | 15 | 13 | 18 | 23 | 31 | 22 | 38 | 38 | 35 | 32 |
| o3 | 128 | 131 | 107 | 94 | 68 | 66 | 63 | 77 | 113 | 133 | 137 | 127 | 121 | 119 | 108 | 86 | 80 | 58 | 69 | 87 |
| pm10 | 64 | 67 | 104 | 79 | 115 | 114 | 108 | 58 | 40 | 38 | 33 | 37 | 88 | 74 | 87 | 130 | 132 | 138 | 107 | 76 |
| so2 | 5.8 | 6.4 | 6.7 | 7.4 | 9.3 | 8.7 | 6.5 | 4.9 | 5.1 | 5.8 | 4.8 | 4.4 | 5.7 | 5.4 | 6.2 | 8.4 | 10 | 9.8 | 6.7 | 5.6 |