Air Pollution in Chencang: Real-time Air Quality Index and smog alert.
Pollution and air quality forecast for Chencang. Today is Tuesday, June 2, 2026. The following air pollution values have been recorded for Chencang:- particulate matter (PM10) suspended dust - 179 (Very bad Hazardous)
- particulate matter (PM2.5) dust - 35 (Unhealthy for Sensitive Groups)
- ozone (O3) - 0 (Good)
- nitrogen dioxide (NO2) - 0 (Good)
- sulfur dioxide (SO2) - 0 (Good)

What is the air quality in Chencang today? Is the air polluted in Chencang?. Is there smog?
What is the level of PM10 today in Chencang? (particulate matter (PM10) suspended dust)
The current level of particulate matter PM10 in Chencang is:
179 (Very bad Hazardous)
The highest PM10 values usually occur in month: 153 (December 2018).
The lowest value of particulate matter PM10 pollution in Chencang is usually recorded in: July (41).
What is the current level of PM2.5 in Chencang? (particulate matter (PM2.5) dust)
Today's PM2.5 level is:
35 (Unhealthy for Sensitive Groups)
For comparison, the highest level of PM2.5 in Chencang in the last 7 days was: 56 (Friday, May 27, 2022) and the lowest: 56 (Friday, May 27, 2022).
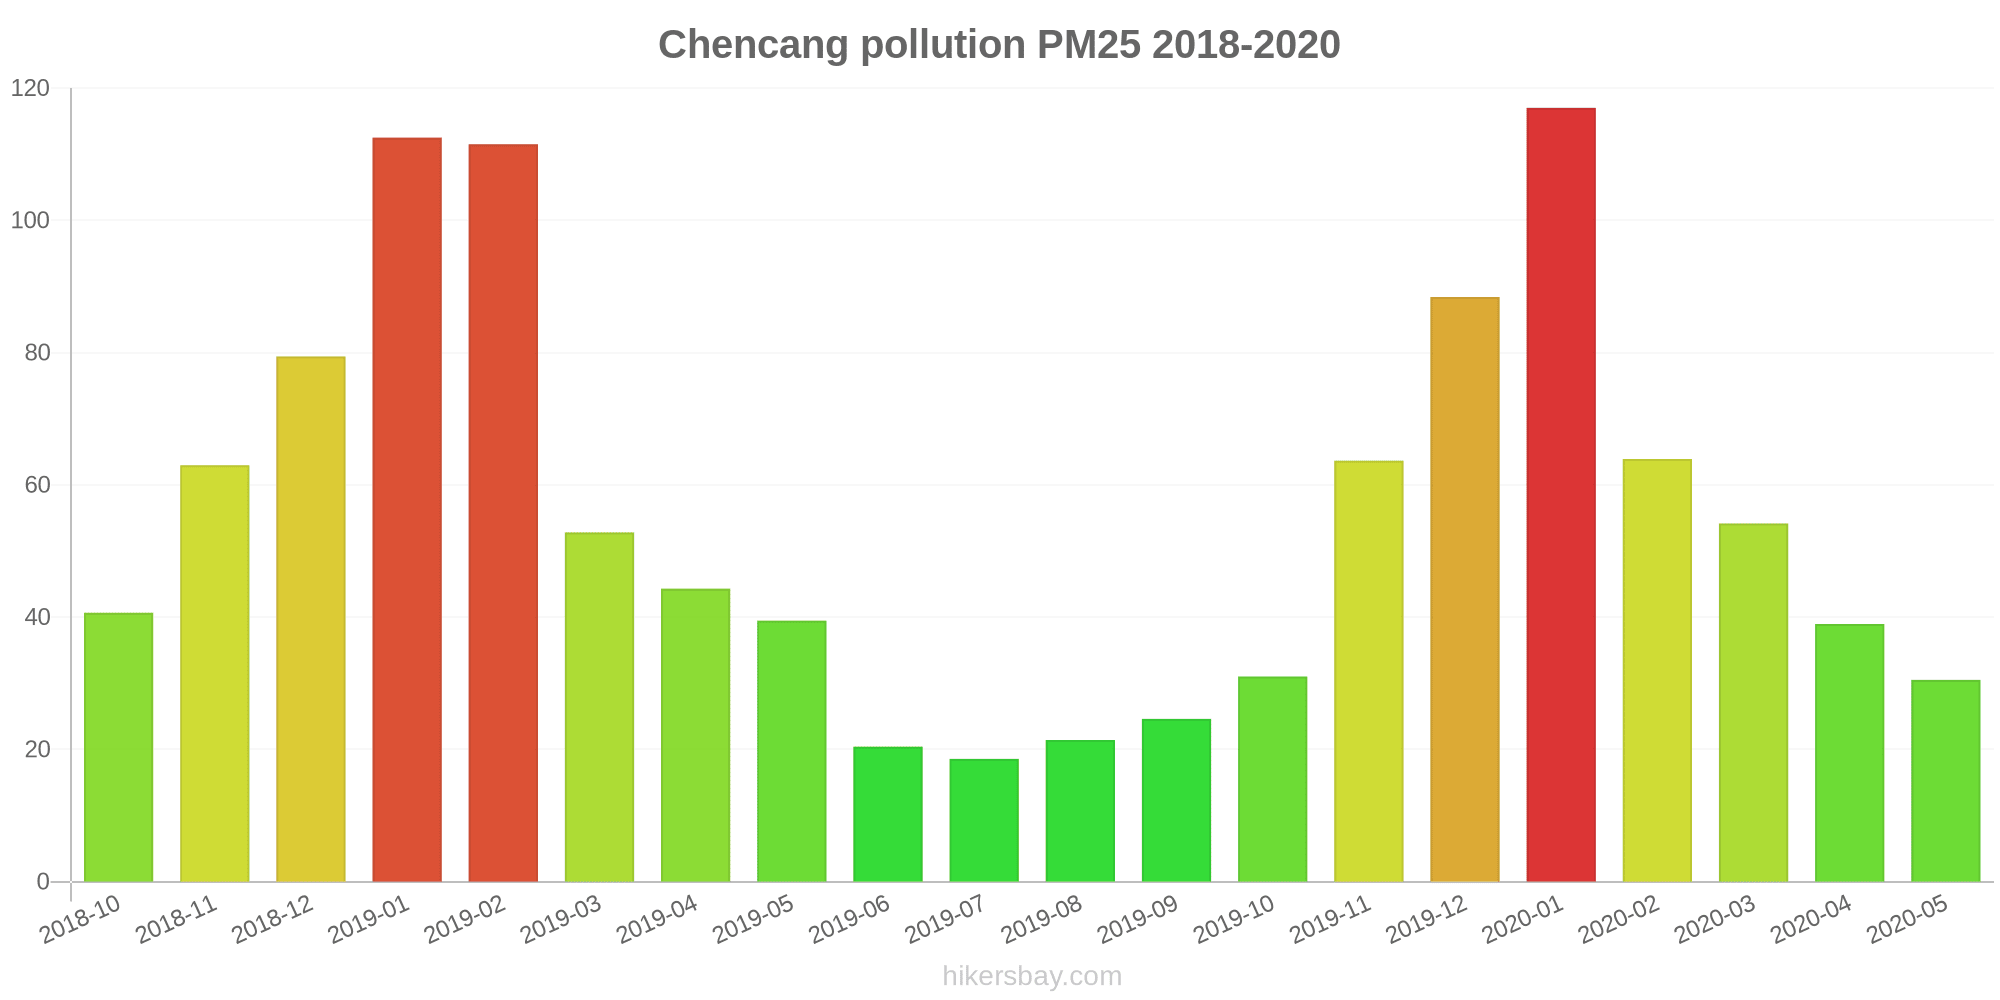
The highest PM2.5 values were recorded: 117 (January 2020).
The lowest level of particulate matter PM2.5 pollution occurs in month: July (19).
How is the O3 level today in Chencang? (ozone (O3))
0 (Good)
How high is the level of NO2? (nitrogen dioxide (NO2))
0 (Good)
What is the level of SO2 pollution? (sulfur dioxide (SO2))
0 (Good)
Current data Friday, May 27, 2022, 12:00 PM
PM10 179 (Very bad Hazardous)
PM2,5 35 (Unhealthy for Sensitive Groups)
O3 0 (Good)
NO2 0 (Good)
SO2 0 (Good)
Data on air pollution from recent days in Chencang
index
2022-05-27
pm10
56
Unhealthy for Sensitive Groups
pm25
56
Unhealthy
o3
0
Good
no2
0
Good
so2
0
Good
data source »
Air pollution in Chencang from October 2018 to May 2020

index
2020-05
2020-04
2020-03
2020-02
2020-01
2019-12
2019-11
2019-10
2019-09
2019-08
2019-07
2019-06
2019-05
2019-04
2019-03
2019-02
2019-01
2018-12
2018-11
2018-10
pm25
31 (Moderate)
39 (Unhealthy for Sensitive Groups)
54 (Unhealthy for Sensitive Groups)
64 (Unhealthy)
117 (Very bad Hazardous)
88 (Very Unhealthy)
64 (Unhealthy)
31 (Moderate)
25 (Moderate)
21 (Moderate)
19 (Moderate)
20 (Moderate)
39 (Unhealthy for Sensitive Groups)
44 (Unhealthy for Sensitive Groups)
53 (Unhealthy for Sensitive Groups)
112 (Very bad Hazardous)
113 (Very bad Hazardous)
79 (Very Unhealthy)
63 (Unhealthy)
41 (Unhealthy for Sensitive Groups)
co
484 (Good)
480 (Good)
520 (Good)
702 (Good)
1 (Good)
952 (Good)
793 (Good)
573 (Good)
471 (Good)
350 (Good)
360 (Good)
564 (Good)
570 (Good)
775 (Good)
835 (Good)
1 (Good)
1 (Good)
948 (Good)
881 (Good)
678 (Good)
no2
29 (Good)
34 (Good)
33 (Good)
21 (Good)
41 (Moderate)
49 (Moderate)
43 (Moderate)
35 (Good)
28 (Good)
24 (Good)
24 (Good)
24 (Good)
31 (Good)
37 (Good)
45 (Moderate)
36 (Good)
56 (Moderate)
50 (Moderate)
51 (Moderate)
46 (Moderate)
o3
129 (Unhealthy for Sensitive Groups)
125 (Unhealthy for Sensitive Groups)
105 (Moderate)
99 (Moderate)
68 (Good)
62 (Good)
61 (Good)
74 (Moderate)
118 (Moderate)
137 (Unhealthy for Sensitive Groups)
144 (Unhealthy for Sensitive Groups)
136 (Unhealthy for Sensitive Groups)
122 (Unhealthy for Sensitive Groups)
125 (Unhealthy for Sensitive Groups)
102 (Moderate)
80 (Moderate)
69 (Good)
49 (Good)
63 (Good)
90 (Moderate)
pm10
73 (Unhealthy for Sensitive Groups)
75 (Unhealthy for Sensitive Groups)
114 (Very Unhealthy)
89 (Unhealthy)
131 (Very Unhealthy)
120 (Very Unhealthy)
106 (Unhealthy)
63 (Unhealthy for Sensitive Groups)
46 (Moderate)
44 (Moderate)
41 (Moderate)
44 (Moderate)
111 (Very Unhealthy)
101 (Unhealthy)
108 (Unhealthy)
142 (Very Unhealthy)
148 (Very Unhealthy)
153 (Very bad Hazardous)
127 (Very Unhealthy)
93 (Unhealthy)
so2
8.3 (Good)
10 (Good)
9.1 (Good)
8 (Good)
9.2 (Good)
10 (Good)
9.6 (Good)
8.1 (Good)
7.1 (Good)
5.6 (Good)
4.8 (Good)
5.2 (Good)
6 (Good)
7 (Good)
9.2 (Good)
8.9 (Good)
12 (Good)
12 (Good)
9.6 (Good)
7.1 (Good)
data source »
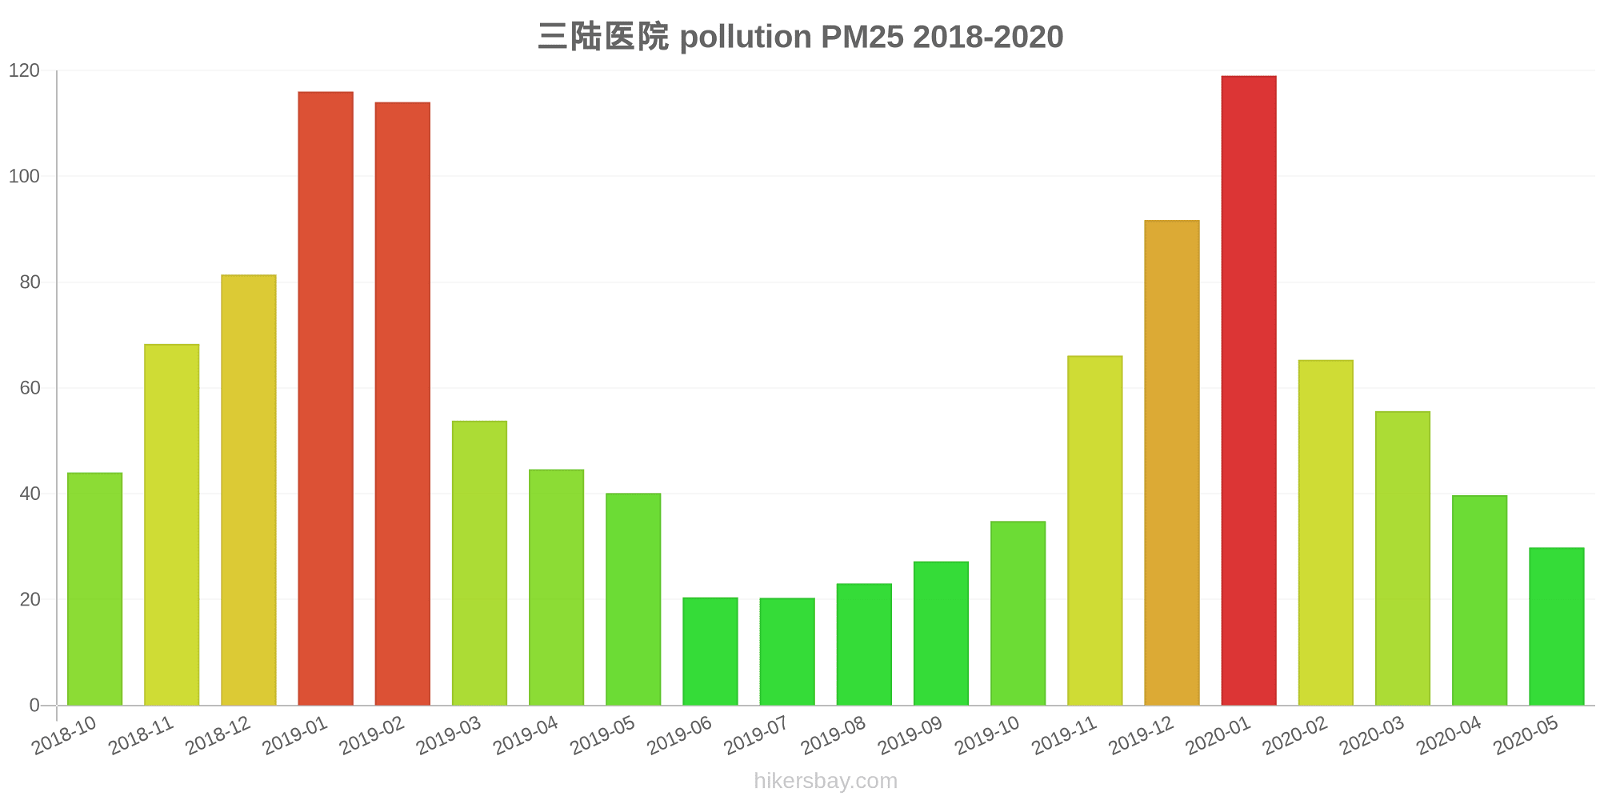
三陆医院
Friday, May 27, 2022, 12:00 PM
PM10 179 (Very bad Hazardous)
particulate matter (PM10) suspended dust
PM2,5 35 (Unhealthy for Sensitive Groups)
particulate matter (PM2.5) dust
O3 0.04 (Good)
ozone (O3)
NO2 0 (Good)
nitrogen dioxide (NO2)
SO2 0 (Good)
sulfur dioxide (SO2)
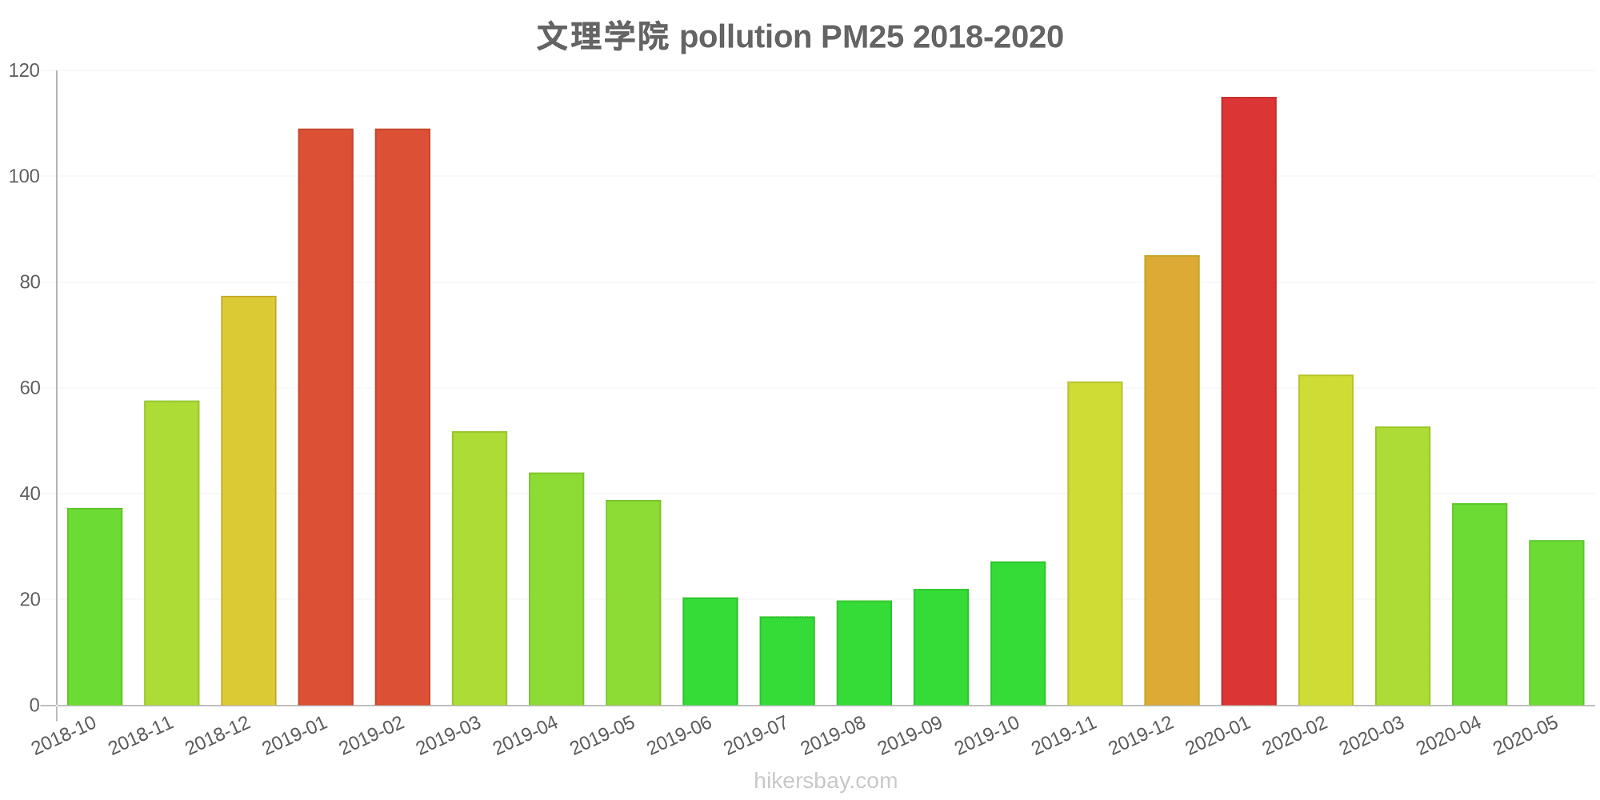
文理学院
Friday, May 27, 2022, 12:00 PM
PM10 179 (Very bad Hazardous)
particulate matter (PM10) suspended dust
PM2,5 35 (Unhealthy for Sensitive Groups)
particulate matter (PM2.5) dust
O3 0.04 (Good)
ozone (O3)
NO2 0 (Good)
nitrogen dioxide (NO2)
SO2 0 (Good)
sulfur dioxide (SO2)
三陆医院
index
2022-05-27
pm10
56
pm25
56
o3
0.03
no2
0
so2
0
文理学院
index
2022-05-27
pm10
56
pm25
56
o3
0.03
no2
0
so2
0
三陆医院
2018-10 2020-05
index
2020-05
2020-04
2020-03
2020-02
2020-01
2019-12
2019-11
2019-10
2019-09
2019-08
2019-07
2019-06
2019-05
2019-04
2019-03
2019-02
2019-01
2018-12
2018-11
2018-10
pm25
30
40
56
65
119
92
66
35
27
23
20
20
40
45
54
114
116
81
68
44
co
508
494
518
727
1
943
775
505
470
320
378
585
598
723
866
1
1
896
894
733
no2
32
36
33
22
41
48
45
36
31
23
22
20
27
38
43
39
54
51
55
47
o3
126
121
101
95
64
60
59
67
113
131
139
129
115
122
98
77
66
47
56
82
pm10
73
75
114
91
129
119
107
65
49
44
43
44
108
101
106
144
147
153
130
96
so2
9.4
12
10
8.3
9.5
10
10
8.6
7.7
5.2
4.3
4.8
6.8
8.1
11
10
14
12
11
8.7
文理学院
2018-10 2020-05
index
2020-05
2020-04
2020-03
2020-02
2020-01
2019-12
2019-11
2019-10
2019-09
2019-08
2019-07
2019-06
2019-05
2019-04
2019-03
2019-02
2019-01
2018-12
2018-11
2018-10
pm25
31
38
53
63
115
85
61
27
22
20
17
20
39
44
52
109
109
77
58
37
co
459
465
522
677
1
960
811
641
471
379
342
542
541
826
804
1
1
999
868
622
no2
26
32
32
19
41
50
40
33
25
24
25
28
35
36
48
34
57
49
48
45
o3
131
128
108
103
73
64
64
80
123
142
149
142
129
128
106
82
72
52
71
97
pm10
73
76
114
88
133
120
104
60
43
45
39
44
113
101
109
139
149
152
123
91
so2
7.2
8.3
7.9
7.7
8.8
9.8
8.9
7.6
6.5
6.1
5.4
5.5
5.2
6
7.7
7.5
11
12
8.5
5.6
* Pollution data source:
https://openaq.org
(ChinaAQIData)
The data is licensed under CC-By 4.0
PM10 179 (Very bad Hazardous)
PM2,5 35 (Unhealthy for Sensitive Groups)
O3 0 (Good)
NO2 0 (Good)
SO2 0 (Good)
Data on air pollution from recent days in Chencang
| index | 2022-05-27 |
|---|---|
| pm10 | 56 Unhealthy for Sensitive Groups |
| pm25 | 56 Unhealthy |
| o3 | 0 Good |
| no2 | 0 Good |
| so2 | 0 Good |
| index | 2020-05 | 2020-04 | 2020-03 | 2020-02 | 2020-01 | 2019-12 | 2019-11 | 2019-10 | 2019-09 | 2019-08 | 2019-07 | 2019-06 | 2019-05 | 2019-04 | 2019-03 | 2019-02 | 2019-01 | 2018-12 | 2018-11 | 2018-10 |
|---|---|---|---|---|---|---|---|---|---|---|---|---|---|---|---|---|---|---|---|---|
| pm25 | 31 (Moderate) | 39 (Unhealthy for Sensitive Groups) | 54 (Unhealthy for Sensitive Groups) | 64 (Unhealthy) | 117 (Very bad Hazardous) | 88 (Very Unhealthy) | 64 (Unhealthy) | 31 (Moderate) | 25 (Moderate) | 21 (Moderate) | 19 (Moderate) | 20 (Moderate) | 39 (Unhealthy for Sensitive Groups) | 44 (Unhealthy for Sensitive Groups) | 53 (Unhealthy for Sensitive Groups) | 112 (Very bad Hazardous) | 113 (Very bad Hazardous) | 79 (Very Unhealthy) | 63 (Unhealthy) | 41 (Unhealthy for Sensitive Groups) |
| co | 484 (Good) | 480 (Good) | 520 (Good) | 702 (Good) | 1 (Good) | 952 (Good) | 793 (Good) | 573 (Good) | 471 (Good) | 350 (Good) | 360 (Good) | 564 (Good) | 570 (Good) | 775 (Good) | 835 (Good) | 1 (Good) | 1 (Good) | 948 (Good) | 881 (Good) | 678 (Good) |
| no2 | 29 (Good) | 34 (Good) | 33 (Good) | 21 (Good) | 41 (Moderate) | 49 (Moderate) | 43 (Moderate) | 35 (Good) | 28 (Good) | 24 (Good) | 24 (Good) | 24 (Good) | 31 (Good) | 37 (Good) | 45 (Moderate) | 36 (Good) | 56 (Moderate) | 50 (Moderate) | 51 (Moderate) | 46 (Moderate) |
| o3 | 129 (Unhealthy for Sensitive Groups) | 125 (Unhealthy for Sensitive Groups) | 105 (Moderate) | 99 (Moderate) | 68 (Good) | 62 (Good) | 61 (Good) | 74 (Moderate) | 118 (Moderate) | 137 (Unhealthy for Sensitive Groups) | 144 (Unhealthy for Sensitive Groups) | 136 (Unhealthy for Sensitive Groups) | 122 (Unhealthy for Sensitive Groups) | 125 (Unhealthy for Sensitive Groups) | 102 (Moderate) | 80 (Moderate) | 69 (Good) | 49 (Good) | 63 (Good) | 90 (Moderate) |
| pm10 | 73 (Unhealthy for Sensitive Groups) | 75 (Unhealthy for Sensitive Groups) | 114 (Very Unhealthy) | 89 (Unhealthy) | 131 (Very Unhealthy) | 120 (Very Unhealthy) | 106 (Unhealthy) | 63 (Unhealthy for Sensitive Groups) | 46 (Moderate) | 44 (Moderate) | 41 (Moderate) | 44 (Moderate) | 111 (Very Unhealthy) | 101 (Unhealthy) | 108 (Unhealthy) | 142 (Very Unhealthy) | 148 (Very Unhealthy) | 153 (Very bad Hazardous) | 127 (Very Unhealthy) | 93 (Unhealthy) |
| so2 | 8.3 (Good) | 10 (Good) | 9.1 (Good) | 8 (Good) | 9.2 (Good) | 10 (Good) | 9.6 (Good) | 8.1 (Good) | 7.1 (Good) | 5.6 (Good) | 4.8 (Good) | 5.2 (Good) | 6 (Good) | 7 (Good) | 9.2 (Good) | 8.9 (Good) | 12 (Good) | 12 (Good) | 9.6 (Good) | 7.1 (Good) |
PM10 179 (Very bad Hazardous)
particulate matter (PM10) suspended dustPM2,5 35 (Unhealthy for Sensitive Groups)
particulate matter (PM2.5) dustO3 0.04 (Good)
ozone (O3)NO2 0 (Good)
nitrogen dioxide (NO2)SO2 0 (Good)
sulfur dioxide (SO2)PM10 179 (Very bad Hazardous)
particulate matter (PM10) suspended dustPM2,5 35 (Unhealthy for Sensitive Groups)
particulate matter (PM2.5) dustO3 0.04 (Good)
ozone (O3)NO2 0 (Good)
nitrogen dioxide (NO2)SO2 0 (Good)
sulfur dioxide (SO2)三陆医院
| index | 2022-05-27 |
|---|---|
| pm10 | 56 |
| pm25 | 56 |
| o3 | 0.03 |
| no2 | 0 |
| so2 | 0 |
文理学院
| index | 2022-05-27 |
|---|---|
| pm10 | 56 |
| pm25 | 56 |
| o3 | 0.03 |
| no2 | 0 |
| so2 | 0 |
三陆医院

| index | 2020-05 | 2020-04 | 2020-03 | 2020-02 | 2020-01 | 2019-12 | 2019-11 | 2019-10 | 2019-09 | 2019-08 | 2019-07 | 2019-06 | 2019-05 | 2019-04 | 2019-03 | 2019-02 | 2019-01 | 2018-12 | 2018-11 | 2018-10 |
|---|---|---|---|---|---|---|---|---|---|---|---|---|---|---|---|---|---|---|---|---|
| pm25 | 30 | 40 | 56 | 65 | 119 | 92 | 66 | 35 | 27 | 23 | 20 | 20 | 40 | 45 | 54 | 114 | 116 | 81 | 68 | 44 |
| co | 508 | 494 | 518 | 727 | 1 | 943 | 775 | 505 | 470 | 320 | 378 | 585 | 598 | 723 | 866 | 1 | 1 | 896 | 894 | 733 |
| no2 | 32 | 36 | 33 | 22 | 41 | 48 | 45 | 36 | 31 | 23 | 22 | 20 | 27 | 38 | 43 | 39 | 54 | 51 | 55 | 47 |
| o3 | 126 | 121 | 101 | 95 | 64 | 60 | 59 | 67 | 113 | 131 | 139 | 129 | 115 | 122 | 98 | 77 | 66 | 47 | 56 | 82 |
| pm10 | 73 | 75 | 114 | 91 | 129 | 119 | 107 | 65 | 49 | 44 | 43 | 44 | 108 | 101 | 106 | 144 | 147 | 153 | 130 | 96 |
| so2 | 9.4 | 12 | 10 | 8.3 | 9.5 | 10 | 10 | 8.6 | 7.7 | 5.2 | 4.3 | 4.8 | 6.8 | 8.1 | 11 | 10 | 14 | 12 | 11 | 8.7 |
文理学院

| index | 2020-05 | 2020-04 | 2020-03 | 2020-02 | 2020-01 | 2019-12 | 2019-11 | 2019-10 | 2019-09 | 2019-08 | 2019-07 | 2019-06 | 2019-05 | 2019-04 | 2019-03 | 2019-02 | 2019-01 | 2018-12 | 2018-11 | 2018-10 |
|---|---|---|---|---|---|---|---|---|---|---|---|---|---|---|---|---|---|---|---|---|
| pm25 | 31 | 38 | 53 | 63 | 115 | 85 | 61 | 27 | 22 | 20 | 17 | 20 | 39 | 44 | 52 | 109 | 109 | 77 | 58 | 37 |
| co | 459 | 465 | 522 | 677 | 1 | 960 | 811 | 641 | 471 | 379 | 342 | 542 | 541 | 826 | 804 | 1 | 1 | 999 | 868 | 622 |
| no2 | 26 | 32 | 32 | 19 | 41 | 50 | 40 | 33 | 25 | 24 | 25 | 28 | 35 | 36 | 48 | 34 | 57 | 49 | 48 | 45 |
| o3 | 131 | 128 | 108 | 103 | 73 | 64 | 64 | 80 | 123 | 142 | 149 | 142 | 129 | 128 | 106 | 82 | 72 | 52 | 71 | 97 |
| pm10 | 73 | 76 | 114 | 88 | 133 | 120 | 104 | 60 | 43 | 45 | 39 | 44 | 113 | 101 | 109 | 139 | 149 | 152 | 123 | 91 |
| so2 | 7.2 | 8.3 | 7.9 | 7.7 | 8.8 | 9.8 | 8.9 | 7.6 | 6.5 | 6.1 | 5.4 | 5.5 | 5.2 | 6 | 7.7 | 7.5 | 11 | 12 | 8.5 | 5.6 |