Air Pollution in Longtang’ancun: Real-time Air Quality Index and smog alert.
Pollution and air quality forecast for Longtang’ancun. Today is Tuesday, June 2, 2026. The following air pollution values have been recorded for Longtang’ancun:- particulate matter (PM10) suspended dust - 179 (Very bad Hazardous)
- particulate matter (PM2.5) dust - 35 (Unhealthy for Sensitive Groups)
- ozone (O3) - 0 (Good)
- nitrogen dioxide (NO2) - 0 (Good)
- sulfur dioxide (SO2) - 0 (Good)

What is the air quality in Longtang’ancun today? Is the air polluted in Longtang’ancun?. Is there smog?
What is the level of PM10 today in Longtang’ancun? (particulate matter (PM10) suspended dust)
The current level of particulate matter PM10 in Longtang’ancun is:
179 (Very bad Hazardous)
The highest PM10 values usually occur in month: 121 (January 2019).
The lowest value of particulate matter PM10 pollution in Longtang’ancun is usually recorded in: February (49).
What is the current level of PM2.5 in Longtang’ancun? (particulate matter (PM2.5) dust)
Today's PM2.5 level is:
35 (Unhealthy for Sensitive Groups)
For comparison, the highest level of PM2.5 in Longtang’ancun in the last 7 days was: 56 (Friday, May 27, 2022) and the lowest: 56 (Friday, May 27, 2022).
The highest PM2.5 values were recorded: 67 (January 2019).
The lowest level of particulate matter PM2.5 pollution occurs in month: August (27).
How is the O3 level today in Longtang’ancun? (ozone (O3))
0 (Good)
How high is the level of NO2? (nitrogen dioxide (NO2))
0 (Good)
What is the level of SO2 pollution? (sulfur dioxide (SO2))
0 (Good)
Current data Friday, May 27, 2022, 12:00 PM
PM10 179 (Very bad Hazardous)
PM2,5 35 (Unhealthy for Sensitive Groups)
O3 0 (Good)
NO2 0 (Good)
SO2 0 (Good)
Data on air pollution from recent days in Longtang’ancun
index
2022-05-27
pm10
56
Unhealthy for Sensitive Groups
pm25
56
Unhealthy
o3
0
Good
no2
0
Good
so2
0
Good
data source »
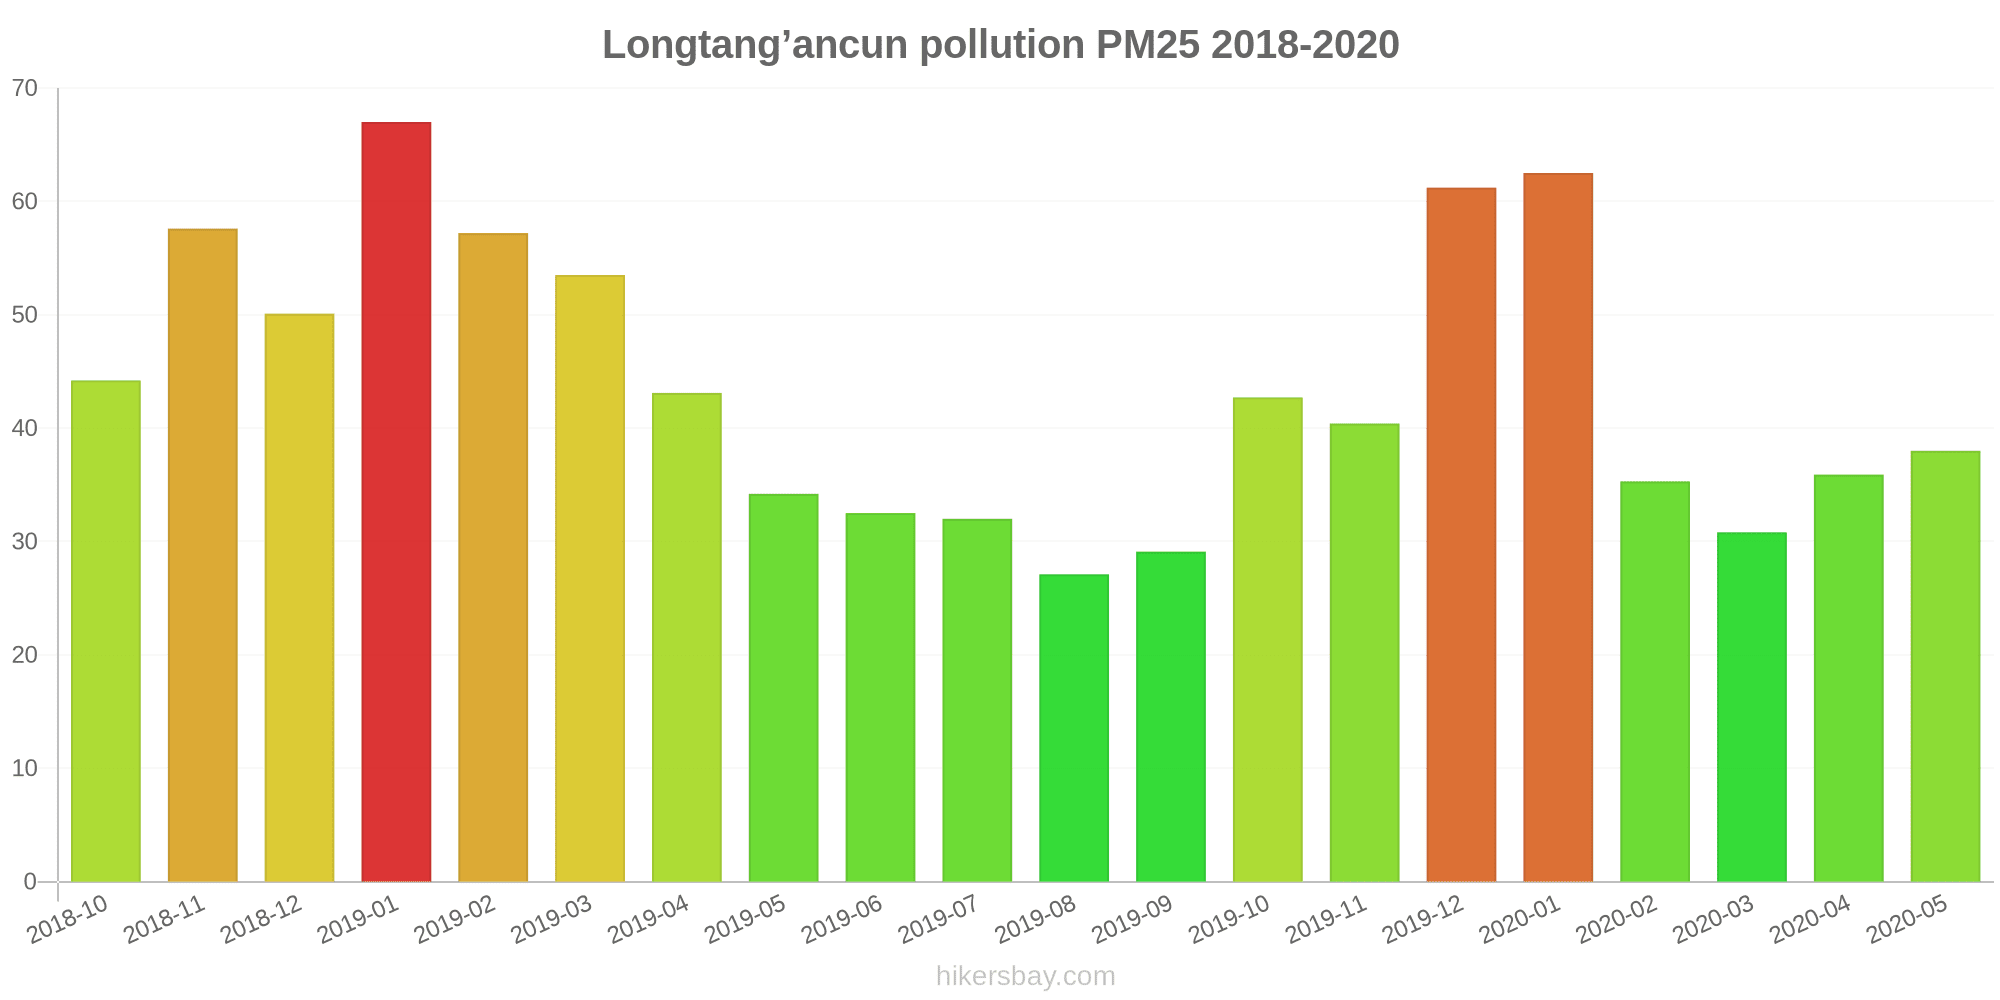
Air pollution in Longtang’ancun from October 2018 to May 2020

index
2020-05
2020-04
2020-03
2020-02
2020-01
2019-12
2019-11
2019-10
2019-09
2019-08
2019-07
2019-06
2019-05
2019-04
2019-03
2019-02
2019-01
2018-12
2018-11
2018-10
pm25
38 (Unhealthy for Sensitive Groups)
36 (Unhealthy for Sensitive Groups)
31 (Moderate)
35 (Unhealthy for Sensitive Groups)
63 (Unhealthy)
61 (Unhealthy)
40 (Unhealthy for Sensitive Groups)
43 (Unhealthy for Sensitive Groups)
29 (Moderate)
27 (Moderate)
32 (Moderate)
33 (Moderate)
34 (Moderate)
43 (Unhealthy for Sensitive Groups)
54 (Unhealthy for Sensitive Groups)
57 (Unhealthy)
67 (Unhealthy)
50 (Unhealthy for Sensitive Groups)
58 (Unhealthy)
44 (Unhealthy for Sensitive Groups)
co
763 (Good)
758 (Good)
861 (Good)
875 (Good)
1 (Good)
1 (Good)
926 (Good)
958 (Good)
902 (Good)
979 (Good)
703 (Good)
785 (Good)
679 (Good)
788 (Good)
927 (Good)
1 (Good)
1 (Good)
1 (Good)
1 (Good)
873 (Good)
no2
34 (Good)
49 (Moderate)
42 (Moderate)
24 (Good)
42 (Moderate)
62 (Moderate)
62 (Moderate)
57 (Moderate)
40 (Good)
31 (Good)
37 (Good)
34 (Good)
46 (Moderate)
49 (Moderate)
57 (Moderate)
37 (Good)
60 (Moderate)
57 (Moderate)
60 (Moderate)
56 (Moderate)
o3
157 (Unhealthy)
144 (Unhealthy for Sensitive Groups)
109 (Moderate)
86 (Moderate)
57 (Good)
61 (Good)
92 (Moderate)
114 (Moderate)
149 (Unhealthy for Sensitive Groups)
161 (Unhealthy)
157 (Unhealthy)
182 (Very Unhealthy)
163 (Unhealthy)
131 (Unhealthy for Sensitive Groups)
109 (Moderate)
72 (Moderate)
52 (Good)
44 (Good)
76 (Moderate)
108 (Moderate)
pm10
71 (Unhealthy for Sensitive Groups)
81 (Unhealthy)
63 (Unhealthy for Sensitive Groups)
49 (Moderate)
88 (Unhealthy)
106 (Unhealthy)
104 (Unhealthy)
99 (Unhealthy)
62 (Unhealthy for Sensitive Groups)
51 (Unhealthy for Sensitive Groups)
57 (Unhealthy for Sensitive Groups)
59 (Unhealthy for Sensitive Groups)
78 (Unhealthy for Sensitive Groups)
83 (Unhealthy)
107 (Unhealthy)
88 (Unhealthy)
121 (Very Unhealthy)
101 (Unhealthy)
106 (Unhealthy)
95 (Unhealthy)
so2
6.4 (Good)
8.3 (Good)
6.5 (Good)
5.5 (Good)
6.7 (Good)
11 (Good)
11 (Good)
11 (Good)
9.4 (Good)
7.5 (Good)
7.3 (Good)
6.5 (Good)
8.7 (Good)
10 (Good)
9.9 (Good)
8.3 (Good)
11 (Good)
10 (Good)
9.4 (Good)
11 (Good)
data source »
黄巷
Friday, May 27, 2022, 12:00 PM
PM10 179 (Very bad Hazardous)
particulate matter (PM10) suspended dust
PM2,5 35 (Unhealthy for Sensitive Groups)
particulate matter (PM2.5) dust
O3 0.04 (Good)
ozone (O3)
NO2 0 (Good)
nitrogen dioxide (NO2)
SO2 0 (Good)
sulfur dioxide (SO2)
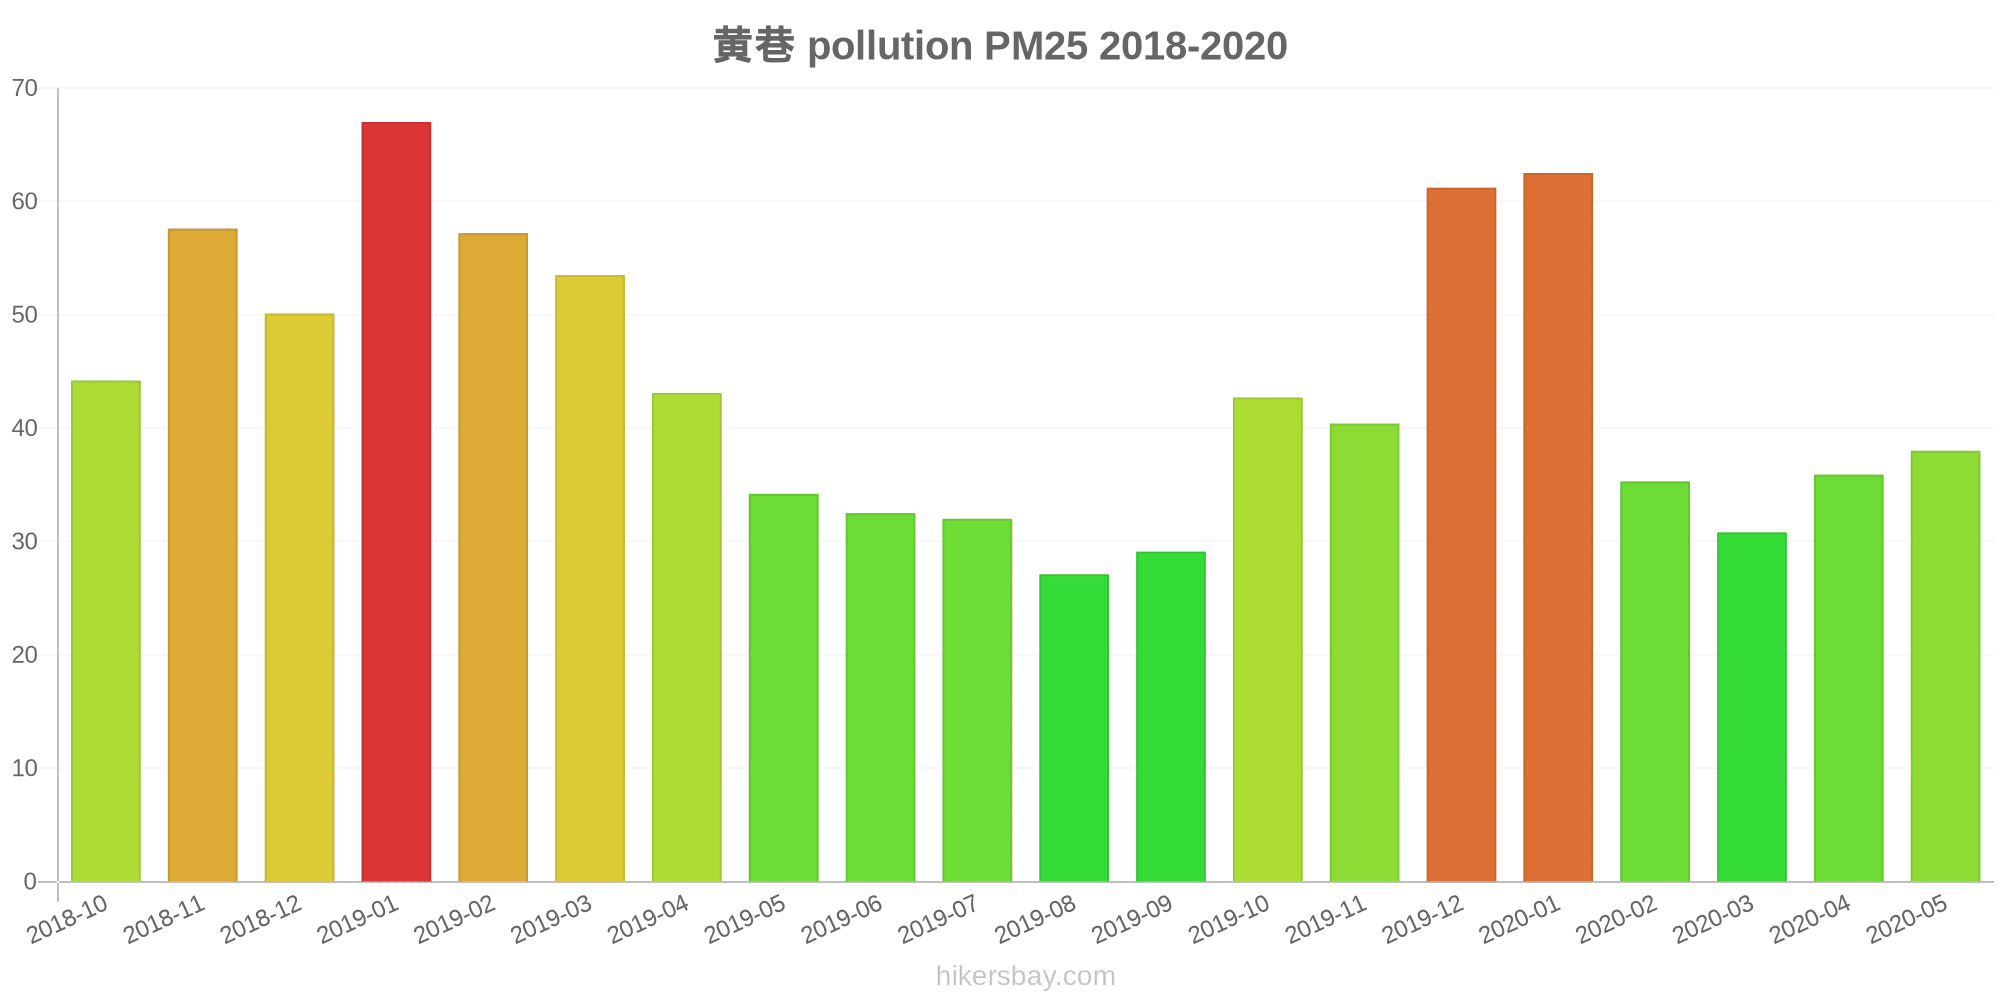
黄巷
index
2022-05-27
pm10
56
pm25
56
o3
0.03
no2
0
so2
0
黄巷
2018-10 2020-05

index
2020-05
2020-04
2020-03
2020-02
2020-01
2019-12
2019-11
2019-10
2019-09
2019-08
2019-07
2019-06
2019-05
2019-04
2019-03
2019-02
2019-01
2018-12
2018-11
2018-10
pm25
38
36
31
35
63
61
40
43
29
27
32
33
34
43
54
57
67
50
58
44
co
763
758
861
875
1
1
926
958
902
979
703
785
679
788
927
1
1
1
1
873
no2
34
49
42
24
42
62
62
57
40
31
37
34
46
49
57
37
60
57
60
56
o3
157
144
109
86
57
61
92
114
149
161
157
182
163
131
109
72
52
44
76
108
pm10
71
81
63
49
88
106
104
99
62
51
57
59
78
83
107
88
121
101
106
95
so2
6.4
8.3
6.5
5.5
6.7
11
11
11
9.4
7.5
7.3
6.5
8.7
10
9.9
8.3
11
10
9.4
11
* Pollution data source:
https://openaq.org
(ChinaAQIData)
The data is licensed under CC-By 4.0
PM10 179 (Very bad Hazardous)
PM2,5 35 (Unhealthy for Sensitive Groups)
O3 0 (Good)
NO2 0 (Good)
SO2 0 (Good)
Data on air pollution from recent days in Longtang’ancun
| index | 2022-05-27 |
|---|---|
| pm10 | 56 Unhealthy for Sensitive Groups |
| pm25 | 56 Unhealthy |
| o3 | 0 Good |
| no2 | 0 Good |
| so2 | 0 Good |
| index | 2020-05 | 2020-04 | 2020-03 | 2020-02 | 2020-01 | 2019-12 | 2019-11 | 2019-10 | 2019-09 | 2019-08 | 2019-07 | 2019-06 | 2019-05 | 2019-04 | 2019-03 | 2019-02 | 2019-01 | 2018-12 | 2018-11 | 2018-10 |
|---|---|---|---|---|---|---|---|---|---|---|---|---|---|---|---|---|---|---|---|---|
| pm25 | 38 (Unhealthy for Sensitive Groups) | 36 (Unhealthy for Sensitive Groups) | 31 (Moderate) | 35 (Unhealthy for Sensitive Groups) | 63 (Unhealthy) | 61 (Unhealthy) | 40 (Unhealthy for Sensitive Groups) | 43 (Unhealthy for Sensitive Groups) | 29 (Moderate) | 27 (Moderate) | 32 (Moderate) | 33 (Moderate) | 34 (Moderate) | 43 (Unhealthy for Sensitive Groups) | 54 (Unhealthy for Sensitive Groups) | 57 (Unhealthy) | 67 (Unhealthy) | 50 (Unhealthy for Sensitive Groups) | 58 (Unhealthy) | 44 (Unhealthy for Sensitive Groups) |
| co | 763 (Good) | 758 (Good) | 861 (Good) | 875 (Good) | 1 (Good) | 1 (Good) | 926 (Good) | 958 (Good) | 902 (Good) | 979 (Good) | 703 (Good) | 785 (Good) | 679 (Good) | 788 (Good) | 927 (Good) | 1 (Good) | 1 (Good) | 1 (Good) | 1 (Good) | 873 (Good) |
| no2 | 34 (Good) | 49 (Moderate) | 42 (Moderate) | 24 (Good) | 42 (Moderate) | 62 (Moderate) | 62 (Moderate) | 57 (Moderate) | 40 (Good) | 31 (Good) | 37 (Good) | 34 (Good) | 46 (Moderate) | 49 (Moderate) | 57 (Moderate) | 37 (Good) | 60 (Moderate) | 57 (Moderate) | 60 (Moderate) | 56 (Moderate) |
| o3 | 157 (Unhealthy) | 144 (Unhealthy for Sensitive Groups) | 109 (Moderate) | 86 (Moderate) | 57 (Good) | 61 (Good) | 92 (Moderate) | 114 (Moderate) | 149 (Unhealthy for Sensitive Groups) | 161 (Unhealthy) | 157 (Unhealthy) | 182 (Very Unhealthy) | 163 (Unhealthy) | 131 (Unhealthy for Sensitive Groups) | 109 (Moderate) | 72 (Moderate) | 52 (Good) | 44 (Good) | 76 (Moderate) | 108 (Moderate) |
| pm10 | 71 (Unhealthy for Sensitive Groups) | 81 (Unhealthy) | 63 (Unhealthy for Sensitive Groups) | 49 (Moderate) | 88 (Unhealthy) | 106 (Unhealthy) | 104 (Unhealthy) | 99 (Unhealthy) | 62 (Unhealthy for Sensitive Groups) | 51 (Unhealthy for Sensitive Groups) | 57 (Unhealthy for Sensitive Groups) | 59 (Unhealthy for Sensitive Groups) | 78 (Unhealthy for Sensitive Groups) | 83 (Unhealthy) | 107 (Unhealthy) | 88 (Unhealthy) | 121 (Very Unhealthy) | 101 (Unhealthy) | 106 (Unhealthy) | 95 (Unhealthy) |
| so2 | 6.4 (Good) | 8.3 (Good) | 6.5 (Good) | 5.5 (Good) | 6.7 (Good) | 11 (Good) | 11 (Good) | 11 (Good) | 9.4 (Good) | 7.5 (Good) | 7.3 (Good) | 6.5 (Good) | 8.7 (Good) | 10 (Good) | 9.9 (Good) | 8.3 (Good) | 11 (Good) | 10 (Good) | 9.4 (Good) | 11 (Good) |
PM10 179 (Very bad Hazardous)
particulate matter (PM10) suspended dustPM2,5 35 (Unhealthy for Sensitive Groups)
particulate matter (PM2.5) dustO3 0.04 (Good)
ozone (O3)NO2 0 (Good)
nitrogen dioxide (NO2)SO2 0 (Good)
sulfur dioxide (SO2)黄巷
| index | 2022-05-27 |
|---|---|
| pm10 | 56 |
| pm25 | 56 |
| o3 | 0.03 |
| no2 | 0 |
| so2 | 0 |
黄巷
| index | 2020-05 | 2020-04 | 2020-03 | 2020-02 | 2020-01 | 2019-12 | 2019-11 | 2019-10 | 2019-09 | 2019-08 | 2019-07 | 2019-06 | 2019-05 | 2019-04 | 2019-03 | 2019-02 | 2019-01 | 2018-12 | 2018-11 | 2018-10 |
|---|---|---|---|---|---|---|---|---|---|---|---|---|---|---|---|---|---|---|---|---|
| pm25 | 38 | 36 | 31 | 35 | 63 | 61 | 40 | 43 | 29 | 27 | 32 | 33 | 34 | 43 | 54 | 57 | 67 | 50 | 58 | 44 |
| co | 763 | 758 | 861 | 875 | 1 | 1 | 926 | 958 | 902 | 979 | 703 | 785 | 679 | 788 | 927 | 1 | 1 | 1 | 1 | 873 |
| no2 | 34 | 49 | 42 | 24 | 42 | 62 | 62 | 57 | 40 | 31 | 37 | 34 | 46 | 49 | 57 | 37 | 60 | 57 | 60 | 56 |
| o3 | 157 | 144 | 109 | 86 | 57 | 61 | 92 | 114 | 149 | 161 | 157 | 182 | 163 | 131 | 109 | 72 | 52 | 44 | 76 | 108 |
| pm10 | 71 | 81 | 63 | 49 | 88 | 106 | 104 | 99 | 62 | 51 | 57 | 59 | 78 | 83 | 107 | 88 | 121 | 101 | 106 | 95 |
| so2 | 6.4 | 8.3 | 6.5 | 5.5 | 6.7 | 11 | 11 | 11 | 9.4 | 7.5 | 7.3 | 6.5 | 8.7 | 10 | 9.9 | 8.3 | 11 | 10 | 9.4 | 11 |