Air Pollution in Caokacun: Real-time Air Quality Index and smog alert.
Pollution and air quality forecast for Caokacun. Today is Tuesday, June 2, 2026. The following air pollution values have been recorded for Caokacun:- particulate matter (PM10) suspended dust - 179 (Very bad Hazardous)
- particulate matter (PM2.5) dust - 35 (Unhealthy for Sensitive Groups)
- ozone (O3) - 0 (Good)
- nitrogen dioxide (NO2) - 0 (Good)
- sulfur dioxide (SO2) - 0 (Good)

What is the air quality in Caokacun today? Is the air polluted in Caokacun?. Is there smog?
What is the level of PM10 today in Caokacun? (particulate matter (PM10) suspended dust)
The current level of particulate matter PM10 in Caokacun is:
179 (Very bad Hazardous)
The highest PM10 values usually occur in month: 78 (March 2019).
The lowest value of particulate matter PM10 pollution in Caokacun is usually recorded in: February (35).
What is the current level of PM2.5 in Caokacun? (particulate matter (PM2.5) dust)
Today's PM2.5 level is:
35 (Unhealthy for Sensitive Groups)
For comparison, the highest level of PM2.5 in Caokacun in the last 7 days was: 56 (Friday, May 27, 2022) and the lowest: 56 (Friday, May 27, 2022).
The highest PM2.5 values were recorded: 63 (January 2019).
The lowest level of particulate matter PM2.5 pollution occurs in month: August (21).
How is the O3 level today in Caokacun? (ozone (O3))
0 (Good)
How high is the level of NO2? (nitrogen dioxide (NO2))
0 (Good)
What is the level of SO2 pollution? (sulfur dioxide (SO2))
0 (Good)
Current data Friday, May 27, 2022, 12:00 PM
PM10 179 (Very bad Hazardous)
PM2,5 35 (Unhealthy for Sensitive Groups)
O3 0 (Good)
NO2 0 (Good)
SO2 0 (Good)
Data on air pollution from recent days in Caokacun
index
2022-05-27
pm10
56
Unhealthy for Sensitive Groups
pm25
56
Unhealthy
o3
0
Good
no2
0
Good
so2
0
Good
data source »
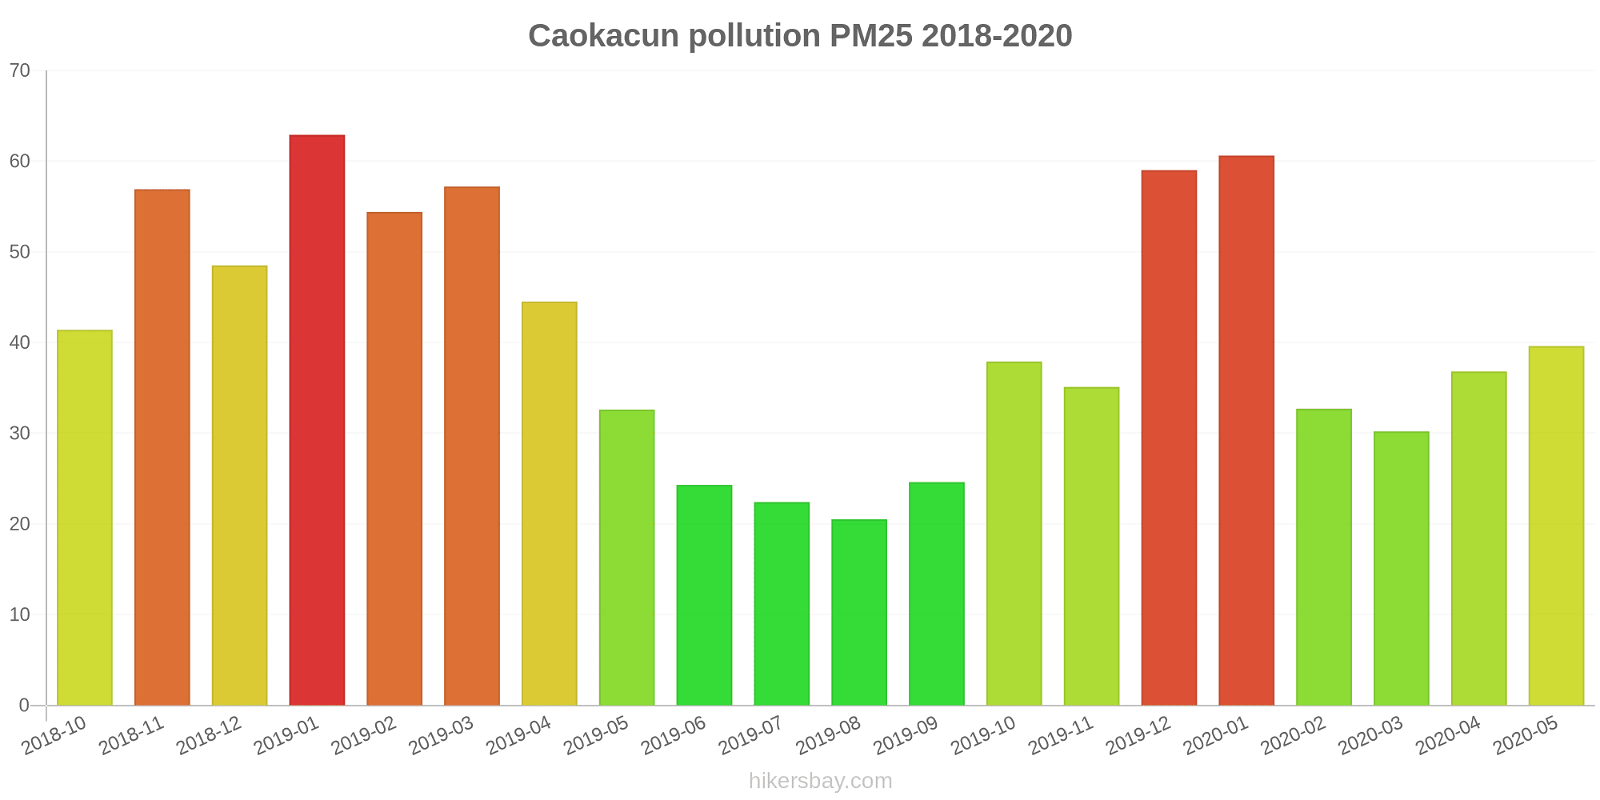
Air pollution in Caokacun from October 2018 to May 2020
index
2020-05
2020-04
2020-03
2020-02
2020-01
2019-12
2019-11
2019-10
2019-09
2019-08
2019-07
2019-06
2019-05
2019-04
2019-03
2019-02
2019-01
2018-12
2018-11
2018-10
pm25
40 (Unhealthy for Sensitive Groups)
37 (Unhealthy for Sensitive Groups)
30 (Moderate)
33 (Moderate)
61 (Unhealthy)
59 (Unhealthy)
35 (Unhealthy for Sensitive Groups)
38 (Unhealthy for Sensitive Groups)
25 (Moderate)
21 (Moderate)
22 (Moderate)
24 (Moderate)
33 (Moderate)
45 (Unhealthy for Sensitive Groups)
57 (Unhealthy)
54 (Unhealthy for Sensitive Groups)
63 (Unhealthy)
49 (Unhealthy for Sensitive Groups)
57 (Unhealthy)
41 (Unhealthy for Sensitive Groups)
co
255 (Good)
420 (Good)
409 (Good)
581 (Good)
865 (Good)
856 (Good)
736 (Good)
680 (Good)
799 (Good)
633 (Good)
506 (Good)
419 (Good)
208 (Good)
405 (Good)
571 (Good)
583 (Good)
712 (Good)
546 (Good)
640 (Good)
481 (Good)
no2
25 (Good)
39 (Good)
31 (Good)
16 (Good)
37 (Good)
59 (Moderate)
50 (Moderate)
44 (Moderate)
36 (Good)
27 (Good)
32 (Good)
26 (Good)
42 (Moderate)
44 (Moderate)
50 (Moderate)
35 (Good)
52 (Moderate)
53 (Moderate)
60 (Moderate)
50 (Moderate)
o3
158 (Unhealthy)
145 (Unhealthy for Sensitive Groups)
107 (Moderate)
107 (Moderate)
76 (Moderate)
76 (Moderate)
102 (Moderate)
129 (Unhealthy for Sensitive Groups)
147 (Unhealthy for Sensitive Groups)
147 (Unhealthy for Sensitive Groups)
159 (Unhealthy)
180 (Very Unhealthy)
180 (Very Unhealthy)
136 (Unhealthy for Sensitive Groups)
108 (Moderate)
81 (Moderate)
63 (Good)
56 (Good)
87 (Moderate)
118 (Moderate)
pm10
51 (Unhealthy for Sensitive Groups)
58 (Unhealthy for Sensitive Groups)
38 (Moderate)
35 (Moderate)
53 (Unhealthy for Sensitive Groups)
63 (Unhealthy for Sensitive Groups)
69 (Unhealthy for Sensitive Groups)
67 (Unhealthy for Sensitive Groups)
42 (Moderate)
43 (Moderate)
53 (Unhealthy for Sensitive Groups)
41 (Moderate)
58 (Unhealthy for Sensitive Groups)
60 (Unhealthy for Sensitive Groups)
78 (Unhealthy for Sensitive Groups)
50 (Unhealthy for Sensitive Groups)
71 (Unhealthy for Sensitive Groups)
65 (Unhealthy for Sensitive Groups)
65 (Unhealthy for Sensitive Groups)
68 (Unhealthy for Sensitive Groups)
so2
5.8 (Good)
5.8 (Good)
3.9 (Good)
2.9 (Good)
2.9 (Good)
4.7 (Good)
3.1 (Good)
3.6 (Good)
4.5 (Good)
5.3 (Good)
5.5 (Good)
4.3 (Good)
5.7 (Good)
5.4 (Good)
5.5 (Good)
3.2 (Good)
5.1 (Good)
5.3 (Good)
3.7 (Good)
3.9 (Good)
data source »
吴中区
Friday, May 27, 2022, 12:00 PM
PM10 179 (Very bad Hazardous)
particulate matter (PM10) suspended dust
PM2,5 35 (Unhealthy for Sensitive Groups)
particulate matter (PM2.5) dust
O3 0.04 (Good)
ozone (O3)
NO2 0 (Good)
nitrogen dioxide (NO2)
SO2 0 (Good)
sulfur dioxide (SO2)
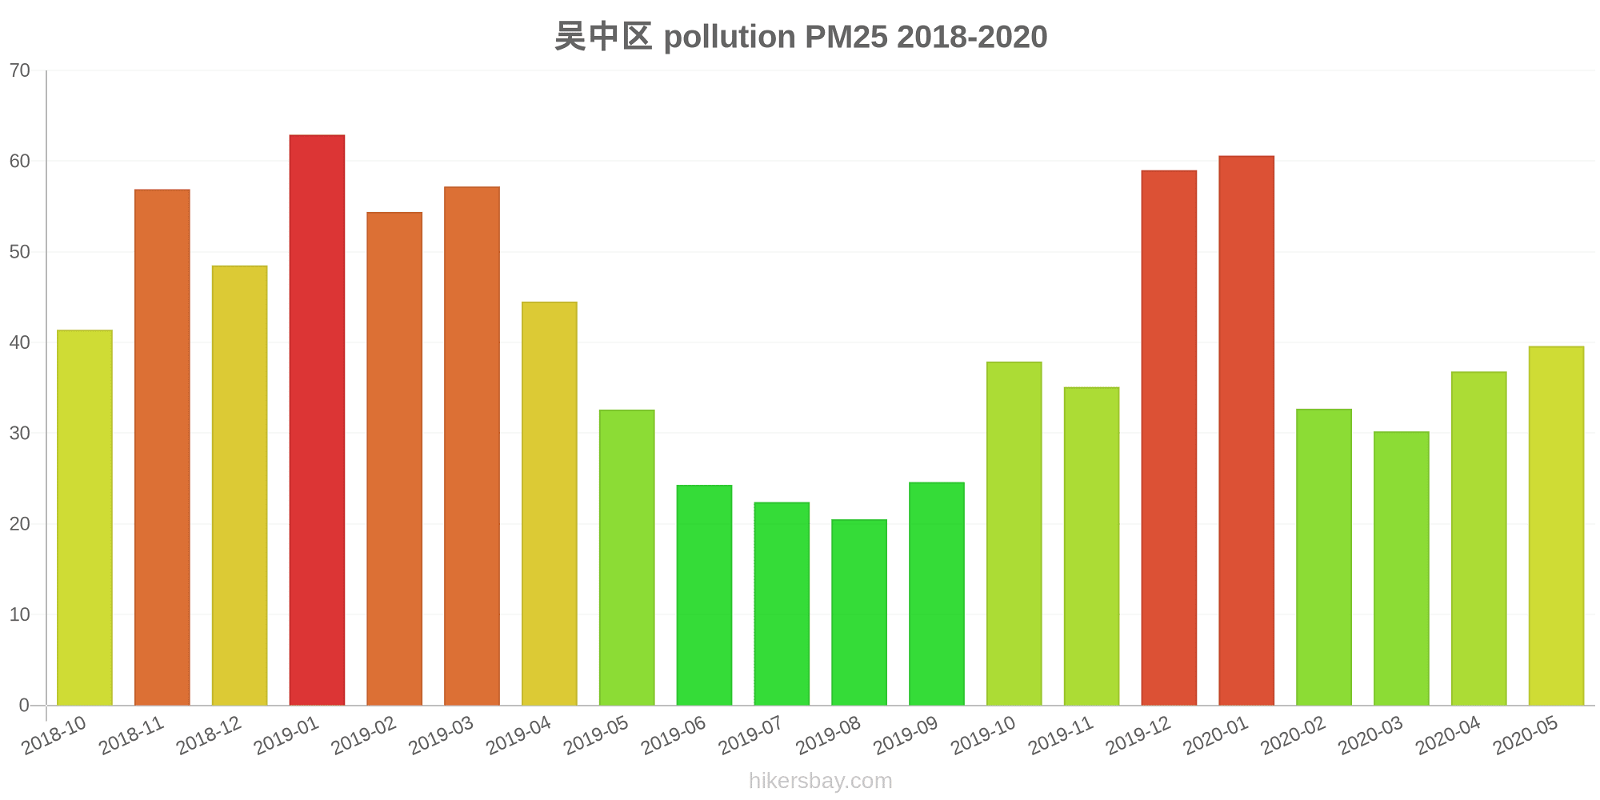
吴中区
index
2022-05-27
pm10
56
pm25
56
o3
0.03
no2
0
so2
0
吴中区
2018-10 2020-05
index
2020-05
2020-04
2020-03
2020-02
2020-01
2019-12
2019-11
2019-10
2019-09
2019-08
2019-07
2019-06
2019-05
2019-04
2019-03
2019-02
2019-01
2018-12
2018-11
2018-10
pm25
40
37
30
33
61
59
35
38
25
21
22
24
33
45
57
54
63
49
57
41
co
255
420
409
581
865
856
736
680
799
633
506
419
208
405
571
583
712
546
640
481
no2
25
39
31
16
37
59
50
44
36
27
32
26
42
44
50
35
52
53
60
50
o3
158
145
107
107
76
76
102
129
147
147
159
180
180
136
108
81
63
56
87
118
pm10
51
58
38
35
53
63
69
67
42
43
53
41
58
60
78
50
71
65
65
68
so2
5.8
5.8
3.9
2.9
2.9
4.7
3.1
3.6
4.5
5.3
5.5
4.3
5.7
5.4
5.5
3.2
5.1
5.3
3.7
3.9
* Pollution data source:
https://openaq.org
(ChinaAQIData)
The data is licensed under CC-By 4.0
PM10 179 (Very bad Hazardous)
PM2,5 35 (Unhealthy for Sensitive Groups)
O3 0 (Good)
NO2 0 (Good)
SO2 0 (Good)
Data on air pollution from recent days in Caokacun
| index | 2022-05-27 |
|---|---|
| pm10 | 56 Unhealthy for Sensitive Groups |
| pm25 | 56 Unhealthy |
| o3 | 0 Good |
| no2 | 0 Good |
| so2 | 0 Good |

| index | 2020-05 | 2020-04 | 2020-03 | 2020-02 | 2020-01 | 2019-12 | 2019-11 | 2019-10 | 2019-09 | 2019-08 | 2019-07 | 2019-06 | 2019-05 | 2019-04 | 2019-03 | 2019-02 | 2019-01 | 2018-12 | 2018-11 | 2018-10 |
|---|---|---|---|---|---|---|---|---|---|---|---|---|---|---|---|---|---|---|---|---|
| pm25 | 40 (Unhealthy for Sensitive Groups) | 37 (Unhealthy for Sensitive Groups) | 30 (Moderate) | 33 (Moderate) | 61 (Unhealthy) | 59 (Unhealthy) | 35 (Unhealthy for Sensitive Groups) | 38 (Unhealthy for Sensitive Groups) | 25 (Moderate) | 21 (Moderate) | 22 (Moderate) | 24 (Moderate) | 33 (Moderate) | 45 (Unhealthy for Sensitive Groups) | 57 (Unhealthy) | 54 (Unhealthy for Sensitive Groups) | 63 (Unhealthy) | 49 (Unhealthy for Sensitive Groups) | 57 (Unhealthy) | 41 (Unhealthy for Sensitive Groups) |
| co | 255 (Good) | 420 (Good) | 409 (Good) | 581 (Good) | 865 (Good) | 856 (Good) | 736 (Good) | 680 (Good) | 799 (Good) | 633 (Good) | 506 (Good) | 419 (Good) | 208 (Good) | 405 (Good) | 571 (Good) | 583 (Good) | 712 (Good) | 546 (Good) | 640 (Good) | 481 (Good) |
| no2 | 25 (Good) | 39 (Good) | 31 (Good) | 16 (Good) | 37 (Good) | 59 (Moderate) | 50 (Moderate) | 44 (Moderate) | 36 (Good) | 27 (Good) | 32 (Good) | 26 (Good) | 42 (Moderate) | 44 (Moderate) | 50 (Moderate) | 35 (Good) | 52 (Moderate) | 53 (Moderate) | 60 (Moderate) | 50 (Moderate) |
| o3 | 158 (Unhealthy) | 145 (Unhealthy for Sensitive Groups) | 107 (Moderate) | 107 (Moderate) | 76 (Moderate) | 76 (Moderate) | 102 (Moderate) | 129 (Unhealthy for Sensitive Groups) | 147 (Unhealthy for Sensitive Groups) | 147 (Unhealthy for Sensitive Groups) | 159 (Unhealthy) | 180 (Very Unhealthy) | 180 (Very Unhealthy) | 136 (Unhealthy for Sensitive Groups) | 108 (Moderate) | 81 (Moderate) | 63 (Good) | 56 (Good) | 87 (Moderate) | 118 (Moderate) |
| pm10 | 51 (Unhealthy for Sensitive Groups) | 58 (Unhealthy for Sensitive Groups) | 38 (Moderate) | 35 (Moderate) | 53 (Unhealthy for Sensitive Groups) | 63 (Unhealthy for Sensitive Groups) | 69 (Unhealthy for Sensitive Groups) | 67 (Unhealthy for Sensitive Groups) | 42 (Moderate) | 43 (Moderate) | 53 (Unhealthy for Sensitive Groups) | 41 (Moderate) | 58 (Unhealthy for Sensitive Groups) | 60 (Unhealthy for Sensitive Groups) | 78 (Unhealthy for Sensitive Groups) | 50 (Unhealthy for Sensitive Groups) | 71 (Unhealthy for Sensitive Groups) | 65 (Unhealthy for Sensitive Groups) | 65 (Unhealthy for Sensitive Groups) | 68 (Unhealthy for Sensitive Groups) |
| so2 | 5.8 (Good) | 5.8 (Good) | 3.9 (Good) | 2.9 (Good) | 2.9 (Good) | 4.7 (Good) | 3.1 (Good) | 3.6 (Good) | 4.5 (Good) | 5.3 (Good) | 5.5 (Good) | 4.3 (Good) | 5.7 (Good) | 5.4 (Good) | 5.5 (Good) | 3.2 (Good) | 5.1 (Good) | 5.3 (Good) | 3.7 (Good) | 3.9 (Good) |
PM10 179 (Very bad Hazardous)
particulate matter (PM10) suspended dustPM2,5 35 (Unhealthy for Sensitive Groups)
particulate matter (PM2.5) dustO3 0.04 (Good)
ozone (O3)NO2 0 (Good)
nitrogen dioxide (NO2)SO2 0 (Good)
sulfur dioxide (SO2)吴中区
| index | 2022-05-27 |
|---|---|
| pm10 | 56 |
| pm25 | 56 |
| o3 | 0.03 |
| no2 | 0 |
| so2 | 0 |
吴中区

| index | 2020-05 | 2020-04 | 2020-03 | 2020-02 | 2020-01 | 2019-12 | 2019-11 | 2019-10 | 2019-09 | 2019-08 | 2019-07 | 2019-06 | 2019-05 | 2019-04 | 2019-03 | 2019-02 | 2019-01 | 2018-12 | 2018-11 | 2018-10 |
|---|---|---|---|---|---|---|---|---|---|---|---|---|---|---|---|---|---|---|---|---|
| pm25 | 40 | 37 | 30 | 33 | 61 | 59 | 35 | 38 | 25 | 21 | 22 | 24 | 33 | 45 | 57 | 54 | 63 | 49 | 57 | 41 |
| co | 255 | 420 | 409 | 581 | 865 | 856 | 736 | 680 | 799 | 633 | 506 | 419 | 208 | 405 | 571 | 583 | 712 | 546 | 640 | 481 |
| no2 | 25 | 39 | 31 | 16 | 37 | 59 | 50 | 44 | 36 | 27 | 32 | 26 | 42 | 44 | 50 | 35 | 52 | 53 | 60 | 50 |
| o3 | 158 | 145 | 107 | 107 | 76 | 76 | 102 | 129 | 147 | 147 | 159 | 180 | 180 | 136 | 108 | 81 | 63 | 56 | 87 | 118 |
| pm10 | 51 | 58 | 38 | 35 | 53 | 63 | 69 | 67 | 42 | 43 | 53 | 41 | 58 | 60 | 78 | 50 | 71 | 65 | 65 | 68 |
| so2 | 5.8 | 5.8 | 3.9 | 2.9 | 2.9 | 4.7 | 3.1 | 3.6 | 4.5 | 5.3 | 5.5 | 4.3 | 5.7 | 5.4 | 5.5 | 3.2 | 5.1 | 5.3 | 3.7 | 3.9 |