Air Pollution in Qianhuxu: Real-time Air Quality Index and smog alert.
Pollution and air quality forecast for Qianhuxu. Today is Tuesday, June 2, 2026. The following air pollution values have been recorded for Qianhuxu:- particulate matter (PM10) suspended dust - 179 (Very bad Hazardous)
- particulate matter (PM2.5) dust - 35 (Unhealthy for Sensitive Groups)
- ozone (O3) - 0 (Good)
- nitrogen dioxide (NO2) - 0 (Good)
- sulfur dioxide (SO2) - 0 (Good)

What is the air quality in Qianhuxu today? Is the air polluted in Qianhuxu?. Is there smog?
What is the level of PM10 today in Qianhuxu? (particulate matter (PM10) suspended dust)
The current level of particulate matter PM10 in Qianhuxu is:
179 (Very bad Hazardous)
The highest PM10 values usually occur in month: 86 (January 2019).
The lowest value of particulate matter PM10 pollution in Qianhuxu is usually recorded in: August (36).
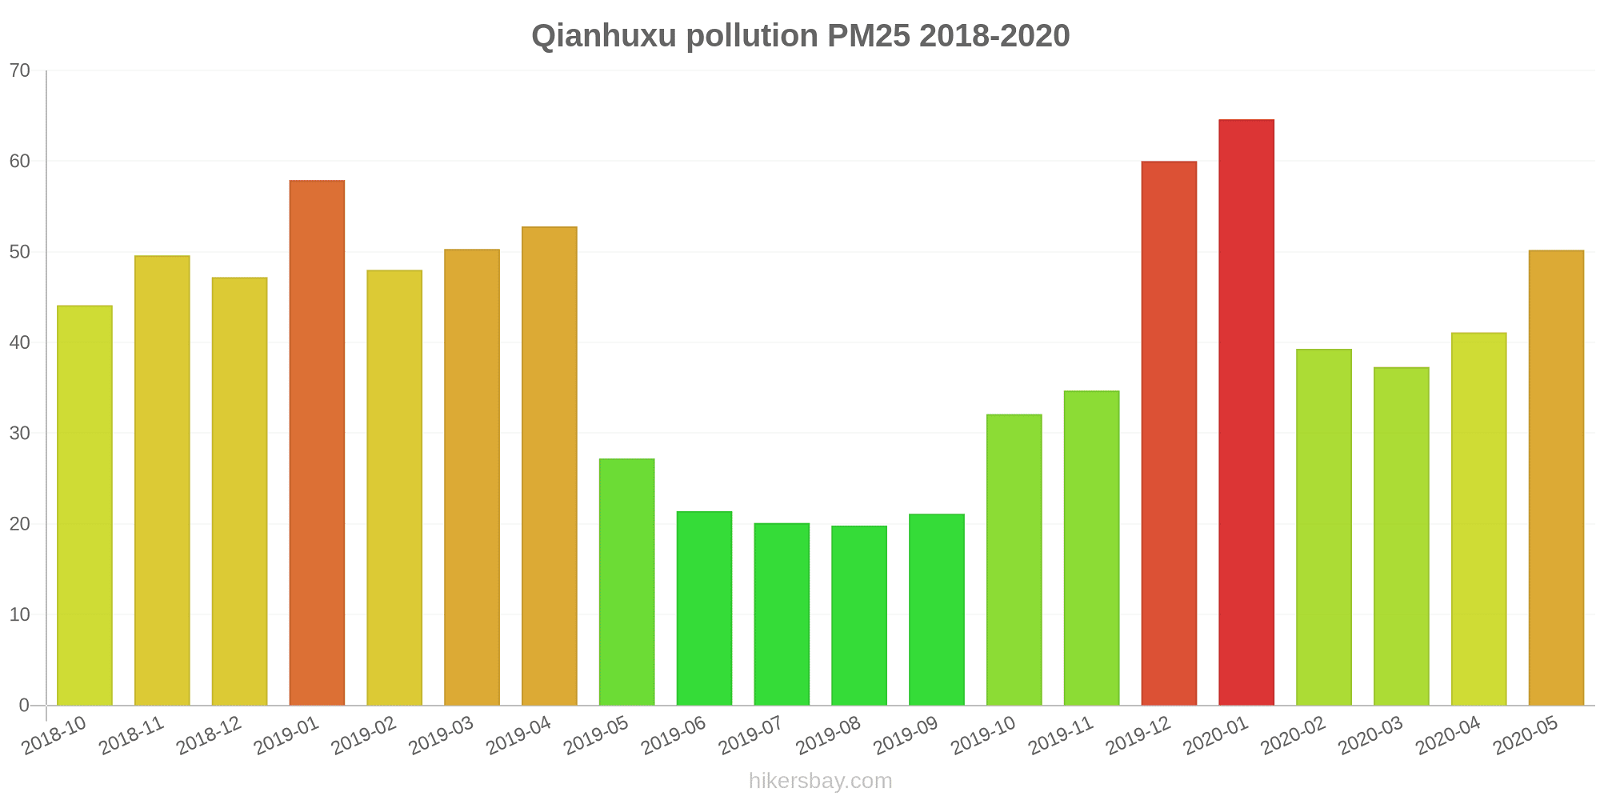
What is the current level of PM2.5 in Qianhuxu? (particulate matter (PM2.5) dust)
Today's PM2.5 level is:
35 (Unhealthy for Sensitive Groups)
For comparison, the highest level of PM2.5 in Qianhuxu in the last 7 days was: 56 (Friday, May 27, 2022) and the lowest: 56 (Friday, May 27, 2022).
The highest PM2.5 values were recorded: 65 (January 2020).
The lowest level of particulate matter PM2.5 pollution occurs in month: August (20).
How is the O3 level today in Qianhuxu? (ozone (O3))
0 (Good)
How high is the level of NO2? (nitrogen dioxide (NO2))
0 (Good)
What is the level of SO2 pollution? (sulfur dioxide (SO2))
0 (Good)
Current data Friday, May 27, 2022, 12:00 PM
PM10 179 (Very bad Hazardous)
PM2,5 35 (Unhealthy for Sensitive Groups)
O3 0 (Good)
NO2 0 (Good)
SO2 0 (Good)
Data on air pollution from recent days in Qianhuxu
index
2022-05-27
pm10
56
Unhealthy for Sensitive Groups
pm25
56
Unhealthy
o3
0
Good
no2
0
Good
so2
0
Good
data source »
Air pollution in Qianhuxu from October 2018 to May 2020
index
2020-05
2020-04
2020-03
2020-02
2020-01
2019-12
2019-11
2019-10
2019-09
2019-08
2019-07
2019-06
2019-05
2019-04
2019-03
2019-02
2019-01
2018-12
2018-11
2018-10
pm25
50 (Unhealthy for Sensitive Groups)
41 (Unhealthy for Sensitive Groups)
37 (Unhealthy for Sensitive Groups)
39 (Unhealthy for Sensitive Groups)
65 (Unhealthy)
60 (Unhealthy)
35 (Moderate)
32 (Moderate)
21 (Moderate)
20 (Moderate)
20 (Moderate)
21 (Moderate)
27 (Moderate)
53 (Unhealthy for Sensitive Groups)
50 (Unhealthy for Sensitive Groups)
48 (Unhealthy for Sensitive Groups)
58 (Unhealthy)
47 (Unhealthy for Sensitive Groups)
50 (Unhealthy for Sensitive Groups)
44 (Unhealthy for Sensitive Groups)
co
397 (Good)
419 (Good)
432 (Good)
490 (Good)
744 (Good)
720 (Good)
515 (Good)
579 (Good)
482 (Good)
526 (Good)
258 (Good)
327 (Good)
308 (Good)
474 (Good)
421 (Good)
492 (Good)
702 (Good)
562 (Good)
446 (Good)
285 (Good)
no2
23 (Good)
35 (Good)
28 (Good)
15 (Good)
35 (Good)
49 (Moderate)
42 (Moderate)
37 (Good)
29 (Good)
21 (Good)
26 (Good)
23 (Good)
29 (Good)
43 (Moderate)
50 (Moderate)
37 (Good)
49 (Moderate)
51 (Moderate)
47 (Moderate)
37 (Good)
o3
160 (Unhealthy)
156 (Unhealthy)
100 (Moderate)
100 (Moderate)
69 (Good)
72 (Moderate)
97 (Moderate)
128 (Unhealthy for Sensitive Groups)
151 (Unhealthy)
149 (Unhealthy for Sensitive Groups)
155 (Unhealthy)
179 (Unhealthy)
163 (Unhealthy)
127 (Unhealthy for Sensitive Groups)
97 (Moderate)
70 (Good)
54 (Good)
50 (Good)
82 (Moderate)
114 (Moderate)
pm10
53 (Unhealthy for Sensitive Groups)
61 (Unhealthy for Sensitive Groups)
43 (Moderate)
38 (Moderate)
66 (Unhealthy for Sensitive Groups)
74 (Unhealthy for Sensitive Groups)
67 (Unhealthy for Sensitive Groups)
65 (Unhealthy for Sensitive Groups)
38 (Moderate)
36 (Moderate)
42 (Moderate)
44 (Moderate)
58 (Unhealthy for Sensitive Groups)
64 (Unhealthy for Sensitive Groups)
77 (Unhealthy for Sensitive Groups)
69 (Unhealthy for Sensitive Groups)
86 (Unhealthy)
66 (Unhealthy for Sensitive Groups)
64 (Unhealthy for Sensitive Groups)
64 (Unhealthy for Sensitive Groups)
so2
2.9 (Good)
4.5 (Good)
4.1 (Good)
3.3 (Good)
5.3 (Good)
5.9 (Good)
5.4 (Good)
5.9 (Good)
4.6 (Good)
3.6 (Good)
6.1 (Good)
6.3 (Good)
8.2 (Good)
8.5 (Good)
11 (Good)
7.8 (Good)
10 (Good)
9.2 (Good)
5.2 (Good)
4.3 (Good)
data source »
上方山
Friday, May 27, 2022, 12:00 PM
PM10 179 (Very bad Hazardous)
particulate matter (PM10) suspended dust
PM2,5 35 (Unhealthy for Sensitive Groups)
particulate matter (PM2.5) dust
O3 0.04 (Good)
ozone (O3)
NO2 0 (Good)
nitrogen dioxide (NO2)
SO2 0 (Good)
sulfur dioxide (SO2)
上方山
index
2022-05-27
pm10
56
pm25
56
o3
0.03
no2
0
so2
0
上方山
2018-10 2020-05

index
2020-05
2020-04
2020-03
2020-02
2020-01
2019-12
2019-11
2019-10
2019-09
2019-08
2019-07
2019-06
2019-05
2019-04
2019-03
2019-02
2019-01
2018-12
2018-11
2018-10
pm25
50
41
37
39
65
60
35
32
21
20
20
21
27
53
50
48
58
47
50
44
co
397
419
432
490
744
720
515
579
482
526
258
327
308
474
421
492
702
562
446
285
no2
23
35
28
15
35
49
42
37
29
21
26
23
29
43
50
37
49
51
47
37
o3
160
156
100
100
69
72
97
128
151
149
155
179
163
127
97
70
54
50
82
114
pm10
53
61
43
38
66
74
67
65
38
36
42
44
58
64
77
69
86
66
64
64
so2
2.9
4.5
4.1
3.3
5.3
5.9
5.4
5.9
4.6
3.6
6.1
6.3
8.2
8.5
11
7.8
10
9.2
5.2
4.3
* Pollution data source:
https://openaq.org
(ChinaAQIData)
The data is licensed under CC-By 4.0
PM10 179 (Very bad Hazardous)
PM2,5 35 (Unhealthy for Sensitive Groups)
O3 0 (Good)
NO2 0 (Good)
SO2 0 (Good)
Data on air pollution from recent days in Qianhuxu
| index | 2022-05-27 |
|---|---|
| pm10 | 56 Unhealthy for Sensitive Groups |
| pm25 | 56 Unhealthy |
| o3 | 0 Good |
| no2 | 0 Good |
| so2 | 0 Good |

| index | 2020-05 | 2020-04 | 2020-03 | 2020-02 | 2020-01 | 2019-12 | 2019-11 | 2019-10 | 2019-09 | 2019-08 | 2019-07 | 2019-06 | 2019-05 | 2019-04 | 2019-03 | 2019-02 | 2019-01 | 2018-12 | 2018-11 | 2018-10 |
|---|---|---|---|---|---|---|---|---|---|---|---|---|---|---|---|---|---|---|---|---|
| pm25 | 50 (Unhealthy for Sensitive Groups) | 41 (Unhealthy for Sensitive Groups) | 37 (Unhealthy for Sensitive Groups) | 39 (Unhealthy for Sensitive Groups) | 65 (Unhealthy) | 60 (Unhealthy) | 35 (Moderate) | 32 (Moderate) | 21 (Moderate) | 20 (Moderate) | 20 (Moderate) | 21 (Moderate) | 27 (Moderate) | 53 (Unhealthy for Sensitive Groups) | 50 (Unhealthy for Sensitive Groups) | 48 (Unhealthy for Sensitive Groups) | 58 (Unhealthy) | 47 (Unhealthy for Sensitive Groups) | 50 (Unhealthy for Sensitive Groups) | 44 (Unhealthy for Sensitive Groups) |
| co | 397 (Good) | 419 (Good) | 432 (Good) | 490 (Good) | 744 (Good) | 720 (Good) | 515 (Good) | 579 (Good) | 482 (Good) | 526 (Good) | 258 (Good) | 327 (Good) | 308 (Good) | 474 (Good) | 421 (Good) | 492 (Good) | 702 (Good) | 562 (Good) | 446 (Good) | 285 (Good) |
| no2 | 23 (Good) | 35 (Good) | 28 (Good) | 15 (Good) | 35 (Good) | 49 (Moderate) | 42 (Moderate) | 37 (Good) | 29 (Good) | 21 (Good) | 26 (Good) | 23 (Good) | 29 (Good) | 43 (Moderate) | 50 (Moderate) | 37 (Good) | 49 (Moderate) | 51 (Moderate) | 47 (Moderate) | 37 (Good) |
| o3 | 160 (Unhealthy) | 156 (Unhealthy) | 100 (Moderate) | 100 (Moderate) | 69 (Good) | 72 (Moderate) | 97 (Moderate) | 128 (Unhealthy for Sensitive Groups) | 151 (Unhealthy) | 149 (Unhealthy for Sensitive Groups) | 155 (Unhealthy) | 179 (Unhealthy) | 163 (Unhealthy) | 127 (Unhealthy for Sensitive Groups) | 97 (Moderate) | 70 (Good) | 54 (Good) | 50 (Good) | 82 (Moderate) | 114 (Moderate) |
| pm10 | 53 (Unhealthy for Sensitive Groups) | 61 (Unhealthy for Sensitive Groups) | 43 (Moderate) | 38 (Moderate) | 66 (Unhealthy for Sensitive Groups) | 74 (Unhealthy for Sensitive Groups) | 67 (Unhealthy for Sensitive Groups) | 65 (Unhealthy for Sensitive Groups) | 38 (Moderate) | 36 (Moderate) | 42 (Moderate) | 44 (Moderate) | 58 (Unhealthy for Sensitive Groups) | 64 (Unhealthy for Sensitive Groups) | 77 (Unhealthy for Sensitive Groups) | 69 (Unhealthy for Sensitive Groups) | 86 (Unhealthy) | 66 (Unhealthy for Sensitive Groups) | 64 (Unhealthy for Sensitive Groups) | 64 (Unhealthy for Sensitive Groups) |
| so2 | 2.9 (Good) | 4.5 (Good) | 4.1 (Good) | 3.3 (Good) | 5.3 (Good) | 5.9 (Good) | 5.4 (Good) | 5.9 (Good) | 4.6 (Good) | 3.6 (Good) | 6.1 (Good) | 6.3 (Good) | 8.2 (Good) | 8.5 (Good) | 11 (Good) | 7.8 (Good) | 10 (Good) | 9.2 (Good) | 5.2 (Good) | 4.3 (Good) |
PM10 179 (Very bad Hazardous)
particulate matter (PM10) suspended dustPM2,5 35 (Unhealthy for Sensitive Groups)
particulate matter (PM2.5) dustO3 0.04 (Good)
ozone (O3)NO2 0 (Good)
nitrogen dioxide (NO2)SO2 0 (Good)
sulfur dioxide (SO2)上方山
| index | 2022-05-27 |
|---|---|
| pm10 | 56 |
| pm25 | 56 |
| o3 | 0.03 |
| no2 | 0 |
| so2 | 0 |
上方山

| index | 2020-05 | 2020-04 | 2020-03 | 2020-02 | 2020-01 | 2019-12 | 2019-11 | 2019-10 | 2019-09 | 2019-08 | 2019-07 | 2019-06 | 2019-05 | 2019-04 | 2019-03 | 2019-02 | 2019-01 | 2018-12 | 2018-11 | 2018-10 |
|---|---|---|---|---|---|---|---|---|---|---|---|---|---|---|---|---|---|---|---|---|
| pm25 | 50 | 41 | 37 | 39 | 65 | 60 | 35 | 32 | 21 | 20 | 20 | 21 | 27 | 53 | 50 | 48 | 58 | 47 | 50 | 44 |
| co | 397 | 419 | 432 | 490 | 744 | 720 | 515 | 579 | 482 | 526 | 258 | 327 | 308 | 474 | 421 | 492 | 702 | 562 | 446 | 285 |
| no2 | 23 | 35 | 28 | 15 | 35 | 49 | 42 | 37 | 29 | 21 | 26 | 23 | 29 | 43 | 50 | 37 | 49 | 51 | 47 | 37 |
| o3 | 160 | 156 | 100 | 100 | 69 | 72 | 97 | 128 | 151 | 149 | 155 | 179 | 163 | 127 | 97 | 70 | 54 | 50 | 82 | 114 |
| pm10 | 53 | 61 | 43 | 38 | 66 | 74 | 67 | 65 | 38 | 36 | 42 | 44 | 58 | 64 | 77 | 69 | 86 | 66 | 64 | 64 |
| so2 | 2.9 | 4.5 | 4.1 | 3.3 | 5.3 | 5.9 | 5.4 | 5.9 | 4.6 | 3.6 | 6.1 | 6.3 | 8.2 | 8.5 | 11 | 7.8 | 10 | 9.2 | 5.2 | 4.3 |