Air Pollution in Zhangqiaocun: Real-time Air Quality Index and smog alert.
Pollution and air quality forecast for Zhangqiaocun. Today is Tuesday, June 2, 2026. The following air pollution values have been recorded for Zhangqiaocun:- particulate matter (PM10) suspended dust - 179 (Very bad Hazardous)
- particulate matter (PM2.5) dust - 35 (Unhealthy for Sensitive Groups)
- ozone (O3) - 0 (Good)
- nitrogen dioxide (NO2) - 0 (Good)
- sulfur dioxide (SO2) - 0 (Good)

What is the air quality in Zhangqiaocun today? Is the air polluted in Zhangqiaocun?. Is there smog?
What is the level of PM10 today in Zhangqiaocun? (particulate matter (PM10) suspended dust)
The current level of particulate matter PM10 in Zhangqiaocun is:
179 (Very bad Hazardous)
The highest PM10 values usually occur in month: 101 (January 2019).
The lowest value of particulate matter PM10 pollution in Zhangqiaocun is usually recorded in: August (39).
What is the current level of PM2.5 in Zhangqiaocun? (particulate matter (PM2.5) dust)
Today's PM2.5 level is:
35 (Unhealthy for Sensitive Groups)
For comparison, the highest level of PM2.5 in Zhangqiaocun in the last 7 days was: 56 (Friday, May 27, 2022) and the lowest: 56 (Friday, May 27, 2022).
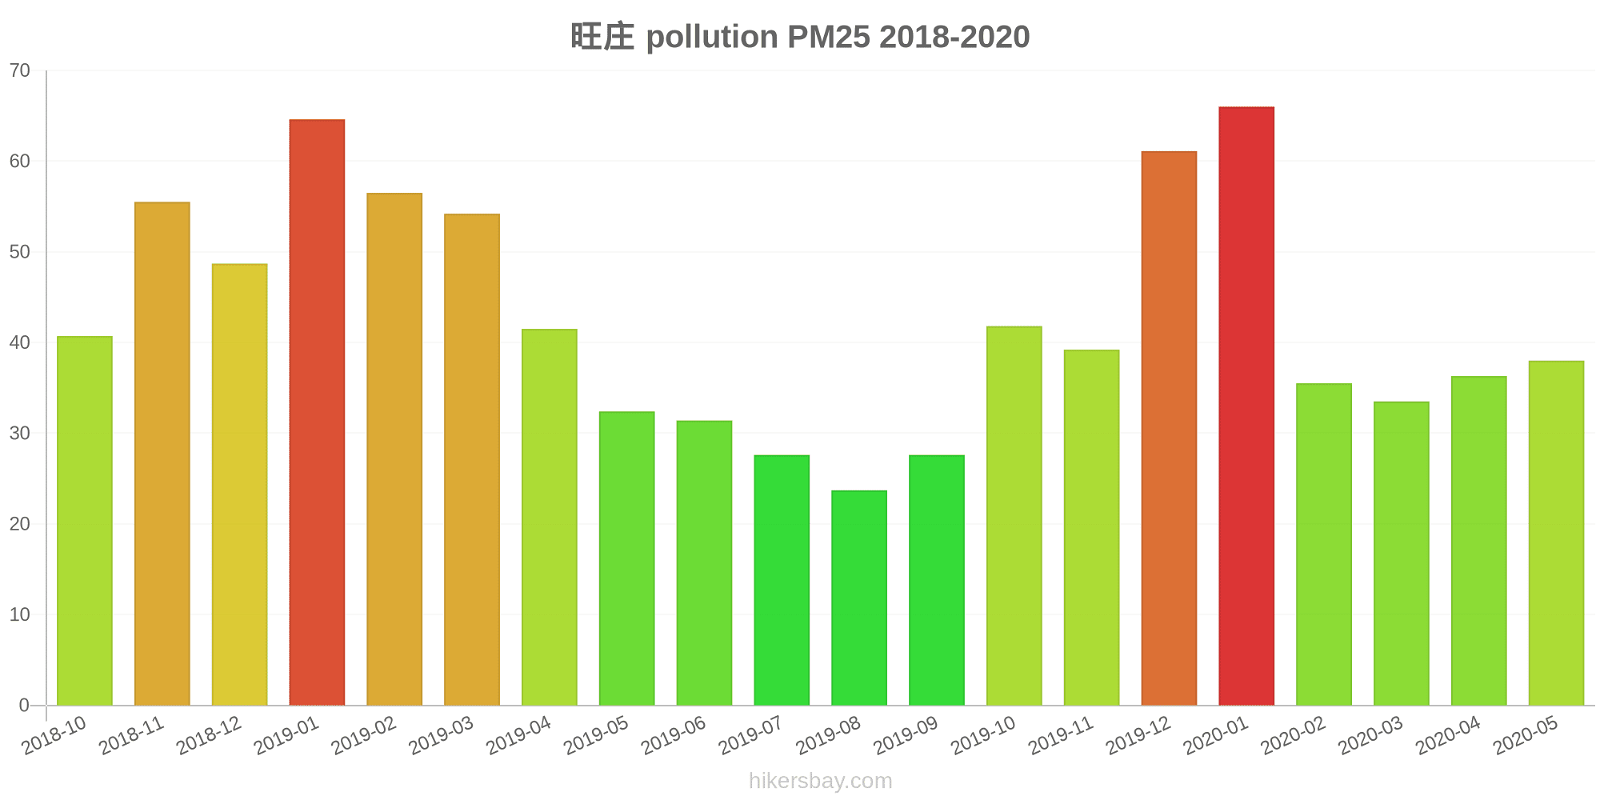
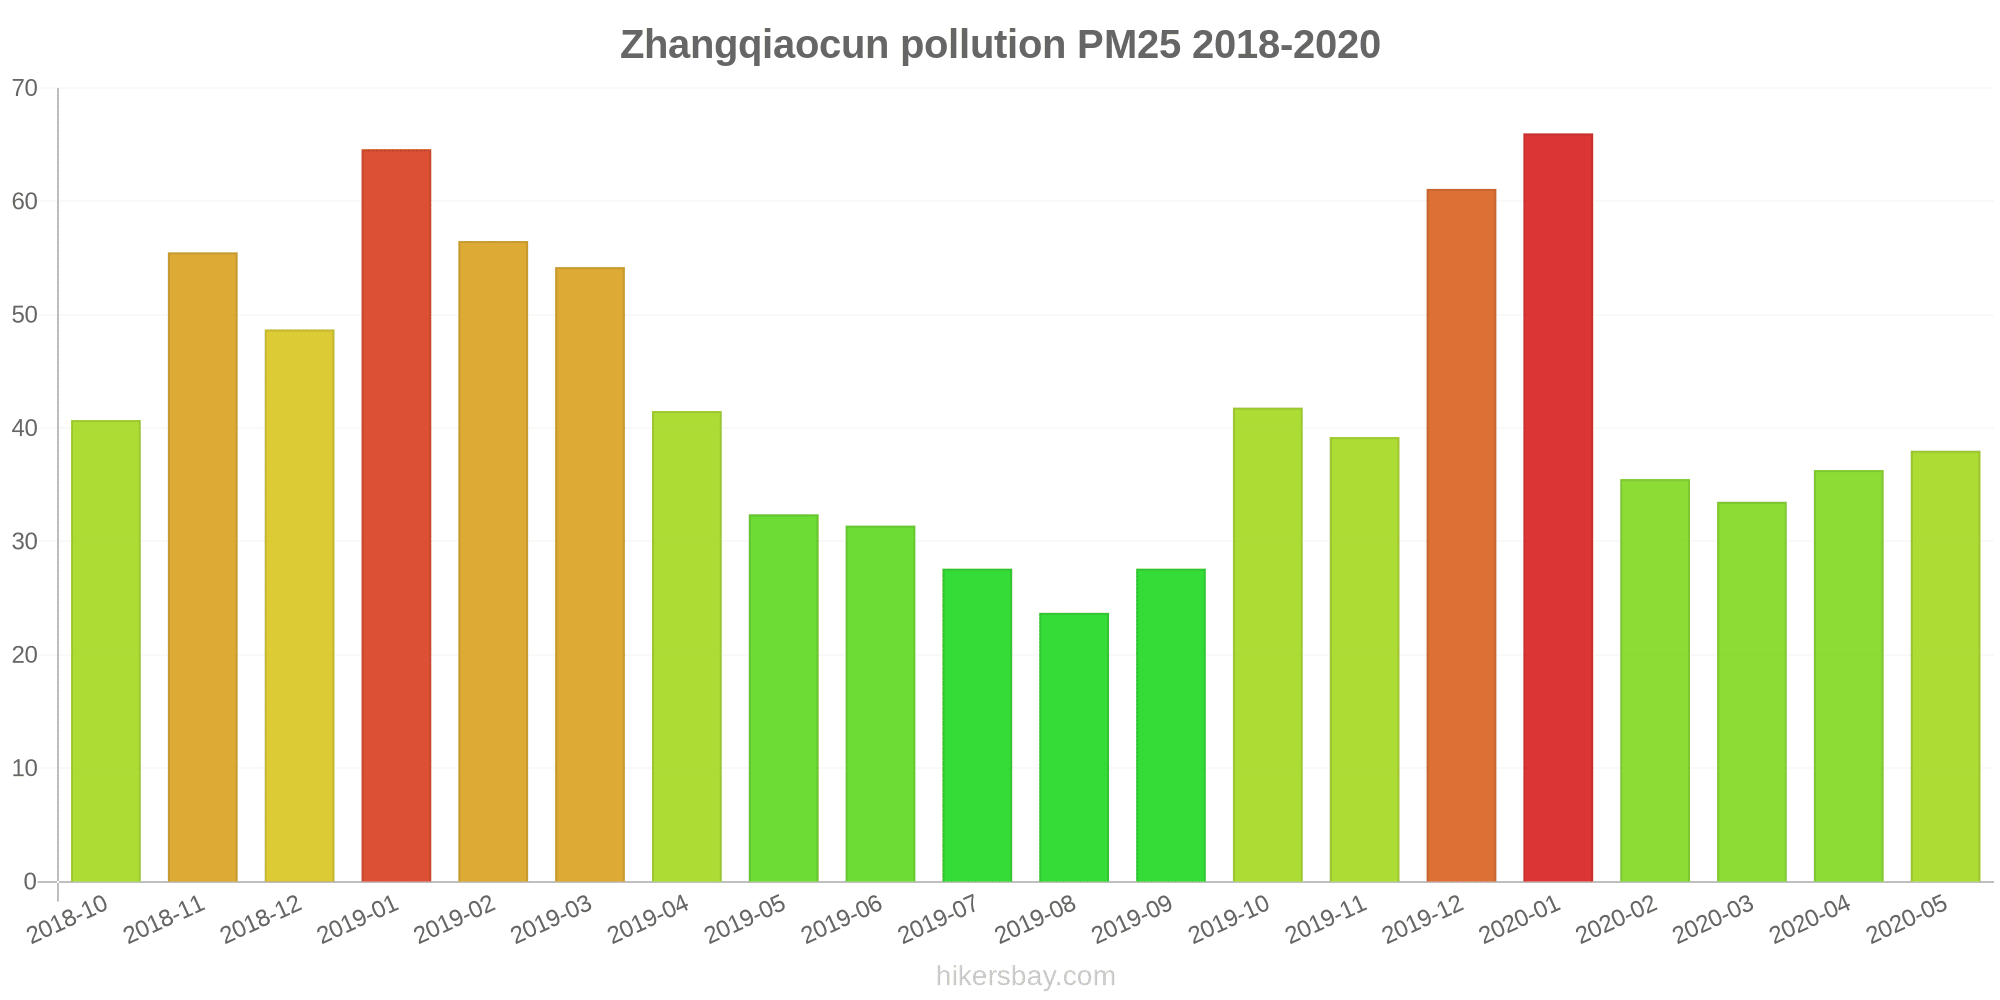
The highest PM2.5 values were recorded: 66 (January 2020).
The lowest level of particulate matter PM2.5 pollution occurs in month: August (24).
How is the O3 level today in Zhangqiaocun? (ozone (O3))
0 (Good)
How high is the level of NO2? (nitrogen dioxide (NO2))
0 (Good)
What is the level of SO2 pollution? (sulfur dioxide (SO2))
0 (Good)
Current data Friday, May 27, 2022, 12:00 PM
PM10 179 (Very bad Hazardous)
PM2,5 35 (Unhealthy for Sensitive Groups)
O3 0 (Good)
NO2 0 (Good)
SO2 0 (Good)
Data on air pollution from recent days in Zhangqiaocun
index
2022-05-27
pm10
56
Unhealthy for Sensitive Groups
pm25
56
Unhealthy
o3
0
Good
no2
0
Good
so2
0
Good
data source »
Air pollution in Zhangqiaocun from October 2018 to May 2020

index
2020-05
2020-04
2020-03
2020-02
2020-01
2019-12
2019-11
2019-10
2019-09
2019-08
2019-07
2019-06
2019-05
2019-04
2019-03
2019-02
2019-01
2018-12
2018-11
2018-10
pm25
38 (Unhealthy for Sensitive Groups)
36 (Unhealthy for Sensitive Groups)
34 (Moderate)
36 (Unhealthy for Sensitive Groups)
66 (Unhealthy)
61 (Unhealthy)
39 (Unhealthy for Sensitive Groups)
42 (Unhealthy for Sensitive Groups)
28 (Moderate)
24 (Moderate)
28 (Moderate)
31 (Moderate)
32 (Moderate)
42 (Unhealthy for Sensitive Groups)
54 (Unhealthy for Sensitive Groups)
57 (Unhealthy)
65 (Unhealthy)
49 (Unhealthy for Sensitive Groups)
56 (Unhealthy)
41 (Unhealthy for Sensitive Groups)
co
842 (Good)
662 (Good)
578 (Good)
594 (Good)
860 (Good)
892 (Good)
782 (Good)
788 (Good)
900 (Good)
682 (Good)
611 (Good)
664 (Good)
675 (Good)
816 (Good)
943 (Good)
1 (Good)
1 (Good)
877 (Good)
1 (Good)
1 (Good)
no2
30 (Good)
46 (Moderate)
40 (Moderate)
24 (Good)
38 (Good)
58 (Moderate)
57 (Moderate)
49 (Moderate)
34 (Good)
25 (Good)
29 (Good)
27 (Good)
43 (Moderate)
48 (Moderate)
55 (Moderate)
40 (Moderate)
61 (Moderate)
54 (Moderate)
63 (Moderate)
55 (Moderate)
o3
158 (Unhealthy)
145 (Unhealthy for Sensitive Groups)
106 (Moderate)
94 (Moderate)
67 (Good)
73 (Moderate)
100 (Moderate)
124 (Unhealthy for Sensitive Groups)
155 (Unhealthy)
164 (Unhealthy)
163 (Unhealthy)
182 (Very Unhealthy)
163 (Unhealthy)
136 (Unhealthy for Sensitive Groups)
116 (Moderate)
73 (Moderate)
51 (Good)
48 (Good)
81 (Moderate)
113 (Moderate)
pm10
62 (Unhealthy for Sensitive Groups)
69 (Unhealthy for Sensitive Groups)
55 (Unhealthy for Sensitive Groups)
45 (Moderate)
81 (Unhealthy)
89 (Unhealthy)
88 (Unhealthy)
83 (Unhealthy)
49 (Moderate)
39 (Moderate)
45 (Moderate)
47 (Moderate)
65 (Unhealthy for Sensitive Groups)
70 (Unhealthy for Sensitive Groups)
89 (Unhealthy)
77 (Unhealthy for Sensitive Groups)
101 (Unhealthy)
83 (Unhealthy)
83 (Unhealthy)
76 (Unhealthy for Sensitive Groups)
so2
4.6 (Good)
7 (Good)
4.8 (Good)
6.3 (Good)
6.7 (Good)
9.4 (Good)
8.2 (Good)
7.8 (Good)
8.8 (Good)
7.9 (Good)
6.5 (Good)
6.1 (Good)
7.7 (Good)
9.4 (Good)
7.4 (Good)
6.1 (Good)
10 (Good)
13 (Good)
12 (Good)
14 (Good)
data source »
旺庄
Friday, May 27, 2022, 12:00 PM
PM10 179 (Very bad Hazardous)
particulate matter (PM10) suspended dust
PM2,5 35 (Unhealthy for Sensitive Groups)
particulate matter (PM2.5) dust
O3 0.04 (Good)
ozone (O3)
NO2 0 (Good)
nitrogen dioxide (NO2)
SO2 0 (Good)
sulfur dioxide (SO2)
旺庄
index
2022-05-27
pm10
56
pm25
56
o3
0.03
no2
0
so2
0
旺庄
2018-10 2020-05
index
2020-05
2020-04
2020-03
2020-02
2020-01
2019-12
2019-11
2019-10
2019-09
2019-08
2019-07
2019-06
2019-05
2019-04
2019-03
2019-02
2019-01
2018-12
2018-11
2018-10
pm25
38
36
34
36
66
61
39
42
28
24
28
31
32
42
54
57
65
49
56
41
co
842
662
578
594
860
892
782
788
900
682
611
664
675
816
943
1
1
877
1
1
no2
30
46
40
24
38
58
57
49
34
25
29
27
43
48
55
40
61
54
63
55
o3
158
145
106
94
67
73
100
124
155
164
163
182
163
136
116
73
51
48
81
113
pm10
62
69
55
45
81
89
88
83
49
39
45
47
65
70
89
77
101
83
83
76
so2
4.6
7
4.8
6.3
6.7
9.4
8.2
7.8
8.8
7.9
6.5
6.1
7.7
9.4
7.4
6.1
10
13
12
14
* Pollution data source:
https://openaq.org
(ChinaAQIData)
The data is licensed under CC-By 4.0
PM10 179 (Very bad Hazardous)
PM2,5 35 (Unhealthy for Sensitive Groups)
O3 0 (Good)
NO2 0 (Good)
SO2 0 (Good)
Data on air pollution from recent days in Zhangqiaocun
| index | 2022-05-27 |
|---|---|
| pm10 | 56 Unhealthy for Sensitive Groups |
| pm25 | 56 Unhealthy |
| o3 | 0 Good |
| no2 | 0 Good |
| so2 | 0 Good |
| index | 2020-05 | 2020-04 | 2020-03 | 2020-02 | 2020-01 | 2019-12 | 2019-11 | 2019-10 | 2019-09 | 2019-08 | 2019-07 | 2019-06 | 2019-05 | 2019-04 | 2019-03 | 2019-02 | 2019-01 | 2018-12 | 2018-11 | 2018-10 |
|---|---|---|---|---|---|---|---|---|---|---|---|---|---|---|---|---|---|---|---|---|
| pm25 | 38 (Unhealthy for Sensitive Groups) | 36 (Unhealthy for Sensitive Groups) | 34 (Moderate) | 36 (Unhealthy for Sensitive Groups) | 66 (Unhealthy) | 61 (Unhealthy) | 39 (Unhealthy for Sensitive Groups) | 42 (Unhealthy for Sensitive Groups) | 28 (Moderate) | 24 (Moderate) | 28 (Moderate) | 31 (Moderate) | 32 (Moderate) | 42 (Unhealthy for Sensitive Groups) | 54 (Unhealthy for Sensitive Groups) | 57 (Unhealthy) | 65 (Unhealthy) | 49 (Unhealthy for Sensitive Groups) | 56 (Unhealthy) | 41 (Unhealthy for Sensitive Groups) |
| co | 842 (Good) | 662 (Good) | 578 (Good) | 594 (Good) | 860 (Good) | 892 (Good) | 782 (Good) | 788 (Good) | 900 (Good) | 682 (Good) | 611 (Good) | 664 (Good) | 675 (Good) | 816 (Good) | 943 (Good) | 1 (Good) | 1 (Good) | 877 (Good) | 1 (Good) | 1 (Good) |
| no2 | 30 (Good) | 46 (Moderate) | 40 (Moderate) | 24 (Good) | 38 (Good) | 58 (Moderate) | 57 (Moderate) | 49 (Moderate) | 34 (Good) | 25 (Good) | 29 (Good) | 27 (Good) | 43 (Moderate) | 48 (Moderate) | 55 (Moderate) | 40 (Moderate) | 61 (Moderate) | 54 (Moderate) | 63 (Moderate) | 55 (Moderate) |
| o3 | 158 (Unhealthy) | 145 (Unhealthy for Sensitive Groups) | 106 (Moderate) | 94 (Moderate) | 67 (Good) | 73 (Moderate) | 100 (Moderate) | 124 (Unhealthy for Sensitive Groups) | 155 (Unhealthy) | 164 (Unhealthy) | 163 (Unhealthy) | 182 (Very Unhealthy) | 163 (Unhealthy) | 136 (Unhealthy for Sensitive Groups) | 116 (Moderate) | 73 (Moderate) | 51 (Good) | 48 (Good) | 81 (Moderate) | 113 (Moderate) |
| pm10 | 62 (Unhealthy for Sensitive Groups) | 69 (Unhealthy for Sensitive Groups) | 55 (Unhealthy for Sensitive Groups) | 45 (Moderate) | 81 (Unhealthy) | 89 (Unhealthy) | 88 (Unhealthy) | 83 (Unhealthy) | 49 (Moderate) | 39 (Moderate) | 45 (Moderate) | 47 (Moderate) | 65 (Unhealthy for Sensitive Groups) | 70 (Unhealthy for Sensitive Groups) | 89 (Unhealthy) | 77 (Unhealthy for Sensitive Groups) | 101 (Unhealthy) | 83 (Unhealthy) | 83 (Unhealthy) | 76 (Unhealthy for Sensitive Groups) |
| so2 | 4.6 (Good) | 7 (Good) | 4.8 (Good) | 6.3 (Good) | 6.7 (Good) | 9.4 (Good) | 8.2 (Good) | 7.8 (Good) | 8.8 (Good) | 7.9 (Good) | 6.5 (Good) | 6.1 (Good) | 7.7 (Good) | 9.4 (Good) | 7.4 (Good) | 6.1 (Good) | 10 (Good) | 13 (Good) | 12 (Good) | 14 (Good) |
PM10 179 (Very bad Hazardous)
particulate matter (PM10) suspended dustPM2,5 35 (Unhealthy for Sensitive Groups)
particulate matter (PM2.5) dustO3 0.04 (Good)
ozone (O3)NO2 0 (Good)
nitrogen dioxide (NO2)SO2 0 (Good)
sulfur dioxide (SO2)旺庄
| index | 2022-05-27 |
|---|---|
| pm10 | 56 |
| pm25 | 56 |
| o3 | 0.03 |
| no2 | 0 |
| so2 | 0 |
旺庄

| index | 2020-05 | 2020-04 | 2020-03 | 2020-02 | 2020-01 | 2019-12 | 2019-11 | 2019-10 | 2019-09 | 2019-08 | 2019-07 | 2019-06 | 2019-05 | 2019-04 | 2019-03 | 2019-02 | 2019-01 | 2018-12 | 2018-11 | 2018-10 |
|---|---|---|---|---|---|---|---|---|---|---|---|---|---|---|---|---|---|---|---|---|
| pm25 | 38 | 36 | 34 | 36 | 66 | 61 | 39 | 42 | 28 | 24 | 28 | 31 | 32 | 42 | 54 | 57 | 65 | 49 | 56 | 41 |
| co | 842 | 662 | 578 | 594 | 860 | 892 | 782 | 788 | 900 | 682 | 611 | 664 | 675 | 816 | 943 | 1 | 1 | 877 | 1 | 1 |
| no2 | 30 | 46 | 40 | 24 | 38 | 58 | 57 | 49 | 34 | 25 | 29 | 27 | 43 | 48 | 55 | 40 | 61 | 54 | 63 | 55 |
| o3 | 158 | 145 | 106 | 94 | 67 | 73 | 100 | 124 | 155 | 164 | 163 | 182 | 163 | 136 | 116 | 73 | 51 | 48 | 81 | 113 |
| pm10 | 62 | 69 | 55 | 45 | 81 | 89 | 88 | 83 | 49 | 39 | 45 | 47 | 65 | 70 | 89 | 77 | 101 | 83 | 83 | 76 |
| so2 | 4.6 | 7 | 4.8 | 6.3 | 6.7 | 9.4 | 8.2 | 7.8 | 8.8 | 7.9 | 6.5 | 6.1 | 7.7 | 9.4 | 7.4 | 6.1 | 10 | 13 | 12 | 14 |