Air Pollution in Tang’ancun: Real-time Air Quality Index and smog alert.
Pollution and air quality forecast for Tang’ancun. Today is Tuesday, June 2, 2026. The following air pollution values have been recorded for Tang’ancun:- particulate matter (PM10) suspended dust - 179 (Very bad Hazardous)
- particulate matter (PM2.5) dust - 35 (Unhealthy for Sensitive Groups)
- ozone (O3) - 0 (Good)
- nitrogen dioxide (NO2) - 0 (Good)
- sulfur dioxide (SO2) - 0 (Good)

What is the air quality in Tang’ancun today? Is the air polluted in Tang’ancun?. Is there smog?
What is the level of PM10 today in Tang’ancun? (particulate matter (PM10) suspended dust)
The current level of particulate matter PM10 in Tang’ancun is:
179 (Very bad Hazardous)
The highest PM10 values usually occur in month: 79 (January 2019).
The lowest value of particulate matter PM10 pollution in Tang’ancun is usually recorded in: October (22).
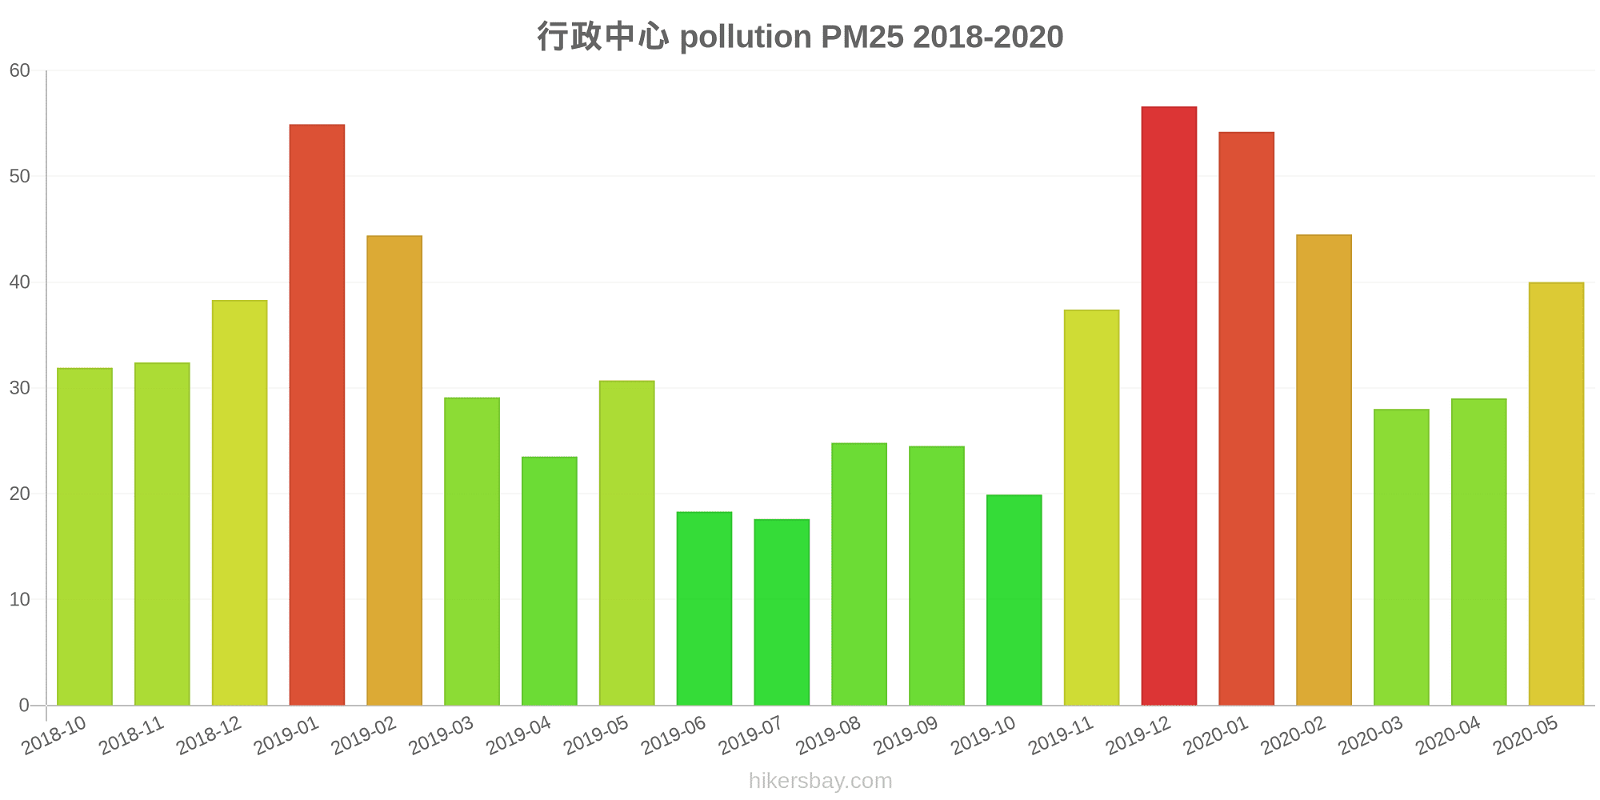
What is the current level of PM2.5 in Tang’ancun? (particulate matter (PM2.5) dust)
Today's PM2.5 level is:
35 (Unhealthy for Sensitive Groups)
For comparison, the highest level of PM2.5 in Tang’ancun in the last 7 days was: 56 (Friday, May 27, 2022) and the lowest: 56 (Friday, May 27, 2022).
The highest PM2.5 values were recorded: 57 (December 2019).
The lowest level of particulate matter PM2.5 pollution occurs in month: July (18).
How is the O3 level today in Tang’ancun? (ozone (O3))
0 (Good)
How high is the level of NO2? (nitrogen dioxide (NO2))
0 (Good)
What is the level of SO2 pollution? (sulfur dioxide (SO2))
0 (Good)
Current data Friday, May 27, 2022, 12:00 PM
PM10 179 (Very bad Hazardous)
PM2,5 35 (Unhealthy for Sensitive Groups)
O3 0 (Good)
NO2 0 (Good)
SO2 0 (Good)
Data on air pollution from recent days in Tang’ancun
index
2022-05-27
pm10
56
Unhealthy for Sensitive Groups
pm25
56
Unhealthy
o3
0
Good
no2
0
Good
so2
0
Good
data source »
Air pollution in Tang’ancun from October 2018 to May 2020

index
2020-05
2020-04
2020-03
2020-02
2020-01
2019-12
2019-11
2019-10
2019-09
2019-08
2019-07
2019-06
2019-05
2019-04
2019-03
2019-02
2019-01
2018-12
2018-11
2018-10
pm25
40 (Unhealthy for Sensitive Groups)
29 (Moderate)
28 (Moderate)
45 (Unhealthy for Sensitive Groups)
54 (Unhealthy for Sensitive Groups)
57 (Unhealthy)
37 (Unhealthy for Sensitive Groups)
20 (Moderate)
25 (Moderate)
25 (Moderate)
18 (Moderate)
18 (Moderate)
31 (Moderate)
24 (Moderate)
29 (Moderate)
44 (Unhealthy for Sensitive Groups)
55 (Unhealthy for Sensitive Groups)
38 (Unhealthy for Sensitive Groups)
32 (Moderate)
32 (Moderate)
co
636 (Good)
662 (Good)
642 (Good)
831 (Good)
1 (Good)
712 (Good)
657 (Good)
631 (Good)
671 (Good)
693 (Good)
758 (Good)
653 (Good)
680 (Good)
643 (Good)
726 (Good)
803 (Good)
662 (Good)
804 (Good)
667 (Good)
528 (Good)
no2
20 (Good)
19 (Good)
19 (Good)
12 (Good)
23 (Good)
30 (Good)
24 (Good)
17 (Good)
17 (Good)
18 (Good)
17 (Good)
16 (Good)
17 (Good)
23 (Good)
26 (Good)
21 (Good)
31 (Good)
28 (Good)
30 (Good)
32 (Good)
o3
151 (Unhealthy)
118 (Moderate)
102 (Moderate)
78 (Moderate)
63 (Good)
50 (Good)
48 (Good)
70 (Moderate)
97 (Moderate)
143 (Unhealthy for Sensitive Groups)
105 (Moderate)
113 (Moderate)
107 (Moderate)
122 (Unhealthy for Sensitive Groups)
89 (Moderate)
72 (Moderate)
58 (Good)
47 (Good)
61 (Good)
72 (Moderate)
pm10
75 (Unhealthy for Sensitive Groups)
45 (Moderate)
51 (Unhealthy for Sensitive Groups)
66 (Unhealthy for Sensitive Groups)
73 (Unhealthy for Sensitive Groups)
71 (Unhealthy for Sensitive Groups)
50 (Unhealthy for Sensitive Groups)
22 (Moderate)
33 (Moderate)
38 (Moderate)
27 (Moderate)
28 (Moderate)
47 (Moderate)
42 (Moderate)
48 (Moderate)
64 (Unhealthy for Sensitive Groups)
79 (Unhealthy for Sensitive Groups)
60 (Unhealthy for Sensitive Groups)
48 (Moderate)
49 (Moderate)
so2
7.7 (Good)
7.7 (Good)
8.7 (Good)
7.6 (Good)
9 (Good)
8.3 (Good)
9.7 (Good)
7.3 (Good)
8.3 (Good)
8.2 (Good)
6.9 (Good)
11 (Good)
9 (Good)
9.9 (Good)
11 (Good)
13 (Good)
13 (Good)
10 (Good)
11 (Good)
12 (Good)
data source »
行政中心
Friday, May 27, 2022, 12:00 PM
PM10 179 (Very bad Hazardous)
particulate matter (PM10) suspended dust
PM2,5 35 (Unhealthy for Sensitive Groups)
particulate matter (PM2.5) dust
O3 0.04 (Good)
ozone (O3)
NO2 0 (Good)
nitrogen dioxide (NO2)
SO2 0 (Good)
sulfur dioxide (SO2)
行政中心
index
2022-05-27
pm10
56
pm25
56
o3
0.03
no2
0
so2
0
行政中心
2018-10 2020-05
index
2020-05
2020-04
2020-03
2020-02
2020-01
2019-12
2019-11
2019-10
2019-09
2019-08
2019-07
2019-06
2019-05
2019-04
2019-03
2019-02
2019-01
2018-12
2018-11
2018-10
pm25
40
29
28
45
54
57
37
20
25
25
18
18
31
24
29
44
55
38
32
32
co
636
662
642
831
1
712
657
631
671
693
758
653
680
643
726
803
662
804
667
528
no2
20
19
19
12
23
30
24
17
17
18
17
16
17
23
26
21
31
28
30
32
o3
151
118
102
78
63
50
48
70
97
143
105
113
107
122
89
72
58
47
61
72
pm10
75
45
51
66
73
71
50
22
33
38
27
28
47
42
48
64
79
60
48
49
so2
7.7
7.7
8.7
7.6
9
8.3
9.7
7.3
8.3
8.2
6.9
11
9
9.9
11
13
13
10
11
12
* Pollution data source:
https://openaq.org
(ChinaAQIData)
The data is licensed under CC-By 4.0
PM10 179 (Very bad Hazardous)
PM2,5 35 (Unhealthy for Sensitive Groups)
O3 0 (Good)
NO2 0 (Good)
SO2 0 (Good)
Data on air pollution from recent days in Tang’ancun
| index | 2022-05-27 |
|---|---|
| pm10 | 56 Unhealthy for Sensitive Groups |
| pm25 | 56 Unhealthy |
| o3 | 0 Good |
| no2 | 0 Good |
| so2 | 0 Good |

| index | 2020-05 | 2020-04 | 2020-03 | 2020-02 | 2020-01 | 2019-12 | 2019-11 | 2019-10 | 2019-09 | 2019-08 | 2019-07 | 2019-06 | 2019-05 | 2019-04 | 2019-03 | 2019-02 | 2019-01 | 2018-12 | 2018-11 | 2018-10 |
|---|---|---|---|---|---|---|---|---|---|---|---|---|---|---|---|---|---|---|---|---|
| pm25 | 40 (Unhealthy for Sensitive Groups) | 29 (Moderate) | 28 (Moderate) | 45 (Unhealthy for Sensitive Groups) | 54 (Unhealthy for Sensitive Groups) | 57 (Unhealthy) | 37 (Unhealthy for Sensitive Groups) | 20 (Moderate) | 25 (Moderate) | 25 (Moderate) | 18 (Moderate) | 18 (Moderate) | 31 (Moderate) | 24 (Moderate) | 29 (Moderate) | 44 (Unhealthy for Sensitive Groups) | 55 (Unhealthy for Sensitive Groups) | 38 (Unhealthy for Sensitive Groups) | 32 (Moderate) | 32 (Moderate) |
| co | 636 (Good) | 662 (Good) | 642 (Good) | 831 (Good) | 1 (Good) | 712 (Good) | 657 (Good) | 631 (Good) | 671 (Good) | 693 (Good) | 758 (Good) | 653 (Good) | 680 (Good) | 643 (Good) | 726 (Good) | 803 (Good) | 662 (Good) | 804 (Good) | 667 (Good) | 528 (Good) |
| no2 | 20 (Good) | 19 (Good) | 19 (Good) | 12 (Good) | 23 (Good) | 30 (Good) | 24 (Good) | 17 (Good) | 17 (Good) | 18 (Good) | 17 (Good) | 16 (Good) | 17 (Good) | 23 (Good) | 26 (Good) | 21 (Good) | 31 (Good) | 28 (Good) | 30 (Good) | 32 (Good) |
| o3 | 151 (Unhealthy) | 118 (Moderate) | 102 (Moderate) | 78 (Moderate) | 63 (Good) | 50 (Good) | 48 (Good) | 70 (Moderate) | 97 (Moderate) | 143 (Unhealthy for Sensitive Groups) | 105 (Moderate) | 113 (Moderate) | 107 (Moderate) | 122 (Unhealthy for Sensitive Groups) | 89 (Moderate) | 72 (Moderate) | 58 (Good) | 47 (Good) | 61 (Good) | 72 (Moderate) |
| pm10 | 75 (Unhealthy for Sensitive Groups) | 45 (Moderate) | 51 (Unhealthy for Sensitive Groups) | 66 (Unhealthy for Sensitive Groups) | 73 (Unhealthy for Sensitive Groups) | 71 (Unhealthy for Sensitive Groups) | 50 (Unhealthy for Sensitive Groups) | 22 (Moderate) | 33 (Moderate) | 38 (Moderate) | 27 (Moderate) | 28 (Moderate) | 47 (Moderate) | 42 (Moderate) | 48 (Moderate) | 64 (Unhealthy for Sensitive Groups) | 79 (Unhealthy for Sensitive Groups) | 60 (Unhealthy for Sensitive Groups) | 48 (Moderate) | 49 (Moderate) |
| so2 | 7.7 (Good) | 7.7 (Good) | 8.7 (Good) | 7.6 (Good) | 9 (Good) | 8.3 (Good) | 9.7 (Good) | 7.3 (Good) | 8.3 (Good) | 8.2 (Good) | 6.9 (Good) | 11 (Good) | 9 (Good) | 9.9 (Good) | 11 (Good) | 13 (Good) | 13 (Good) | 10 (Good) | 11 (Good) | 12 (Good) |
PM10 179 (Very bad Hazardous)
particulate matter (PM10) suspended dustPM2,5 35 (Unhealthy for Sensitive Groups)
particulate matter (PM2.5) dustO3 0.04 (Good)
ozone (O3)NO2 0 (Good)
nitrogen dioxide (NO2)SO2 0 (Good)
sulfur dioxide (SO2)行政中心
| index | 2022-05-27 |
|---|---|
| pm10 | 56 |
| pm25 | 56 |
| o3 | 0.03 |
| no2 | 0 |
| so2 | 0 |
行政中心

| index | 2020-05 | 2020-04 | 2020-03 | 2020-02 | 2020-01 | 2019-12 | 2019-11 | 2019-10 | 2019-09 | 2019-08 | 2019-07 | 2019-06 | 2019-05 | 2019-04 | 2019-03 | 2019-02 | 2019-01 | 2018-12 | 2018-11 | 2018-10 |
|---|---|---|---|---|---|---|---|---|---|---|---|---|---|---|---|---|---|---|---|---|
| pm25 | 40 | 29 | 28 | 45 | 54 | 57 | 37 | 20 | 25 | 25 | 18 | 18 | 31 | 24 | 29 | 44 | 55 | 38 | 32 | 32 |
| co | 636 | 662 | 642 | 831 | 1 | 712 | 657 | 631 | 671 | 693 | 758 | 653 | 680 | 643 | 726 | 803 | 662 | 804 | 667 | 528 |
| no2 | 20 | 19 | 19 | 12 | 23 | 30 | 24 | 17 | 17 | 18 | 17 | 16 | 17 | 23 | 26 | 21 | 31 | 28 | 30 | 32 |
| o3 | 151 | 118 | 102 | 78 | 63 | 50 | 48 | 70 | 97 | 143 | 105 | 113 | 107 | 122 | 89 | 72 | 58 | 47 | 61 | 72 |
| pm10 | 75 | 45 | 51 | 66 | 73 | 71 | 50 | 22 | 33 | 38 | 27 | 28 | 47 | 42 | 48 | 64 | 79 | 60 | 48 | 49 |
| so2 | 7.7 | 7.7 | 8.7 | 7.6 | 9 | 8.3 | 9.7 | 7.3 | 8.3 | 8.2 | 6.9 | 11 | 9 | 9.9 | 11 | 13 | 13 | 10 | 11 | 12 |