Air Pollution in Qinglan Nongchang: Real-time Air Quality Index and smog alert.
Pollution and air quality forecast for Qinglan Nongchang. Today is Tuesday, June 2, 2026. The following air pollution values have been recorded for Qinglan Nongchang:- particulate matter (PM10) suspended dust - 179 (Very bad Hazardous)
- particulate matter (PM2.5) dust - 35 (Unhealthy for Sensitive Groups)
- ozone (O3) - 0 (Good)
- nitrogen dioxide (NO2) - 0 (Good)
- sulfur dioxide (SO2) - 0 (Good)

What is the air quality in Qinglan Nongchang today? Is the air polluted in Qinglan Nongchang?. Is there smog?
What is the level of PM10 today in Qinglan Nongchang? (particulate matter (PM10) suspended dust)
The current level of particulate matter PM10 in Qinglan Nongchang is:
179 (Very bad Hazardous)
The highest PM10 values usually occur in month: 81 (January 2019).
The lowest value of particulate matter PM10 pollution in Qinglan Nongchang is usually recorded in: February (32).
What is the current level of PM2.5 in Qinglan Nongchang? (particulate matter (PM2.5) dust)
Today's PM2.5 level is:
35 (Unhealthy for Sensitive Groups)
For comparison, the highest level of PM2.5 in Qinglan Nongchang in the last 7 days was: 56 (Friday, May 27, 2022) and the lowest: 56 (Friday, May 27, 2022).
The highest PM2.5 values were recorded: 68 (January 2019).
The lowest level of particulate matter PM2.5 pollution occurs in month: June (20).
How is the O3 level today in Qinglan Nongchang? (ozone (O3))
0 (Good)
How high is the level of NO2? (nitrogen dioxide (NO2))
0 (Good)
What is the level of SO2 pollution? (sulfur dioxide (SO2))
0 (Good)
Current data Friday, May 27, 2022, 12:00 PM
PM10 179 (Very bad Hazardous)
PM2,5 35 (Unhealthy for Sensitive Groups)
O3 0 (Good)
NO2 0 (Good)
SO2 0 (Good)
Data on air pollution from recent days in Qinglan Nongchang
index
2022-05-27
pm10
56
Unhealthy for Sensitive Groups
pm25
56
Unhealthy
o3
0
Good
no2
0
Good
so2
0
Good
data source »
Air pollution in Qinglan Nongchang from October 2018 to May 2020
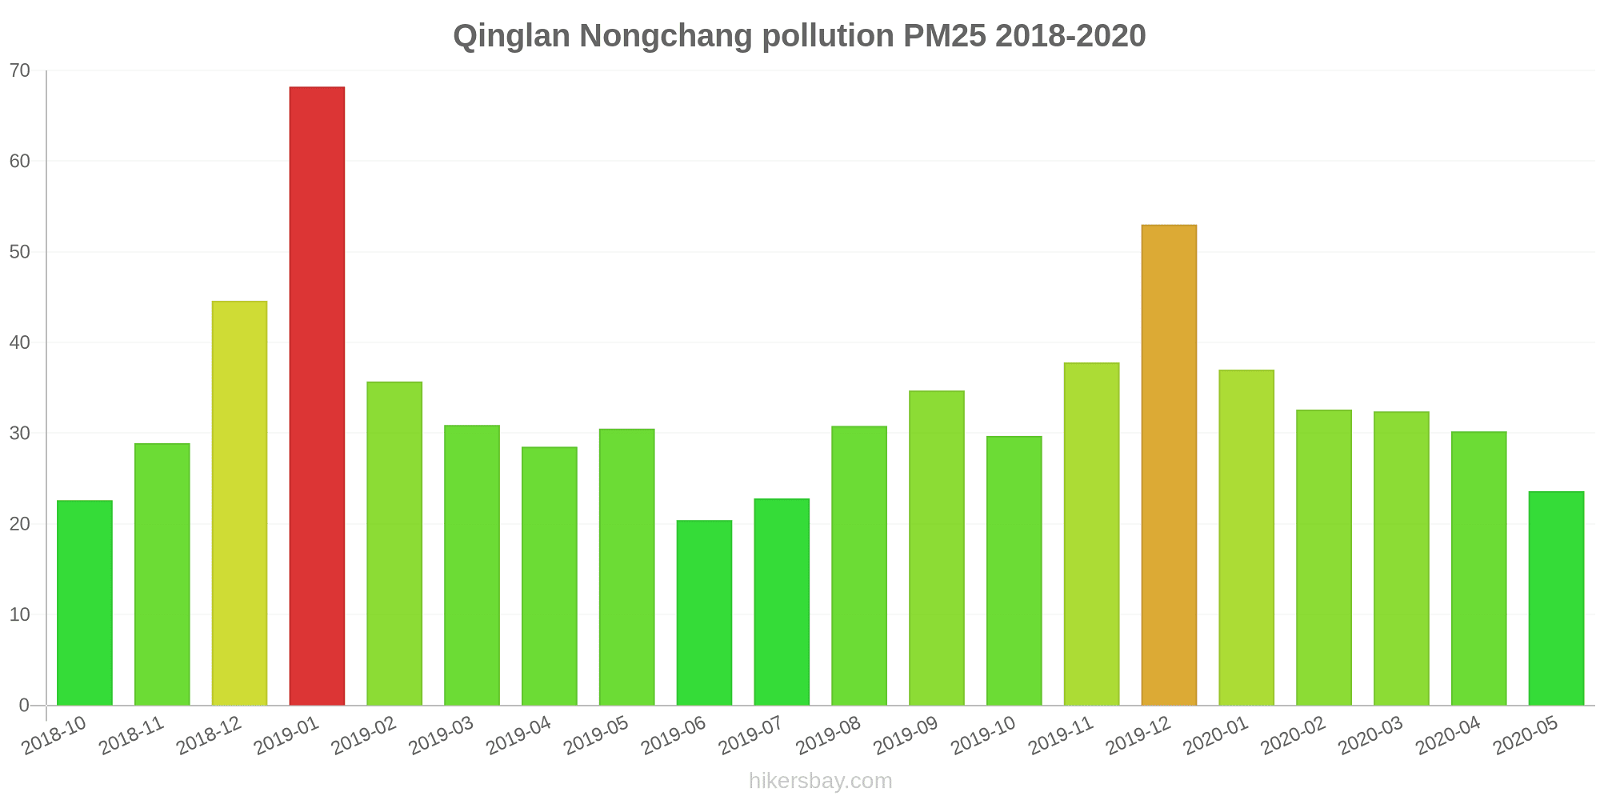
index
2020-05
2020-04
2020-03
2020-02
2020-01
2019-12
2019-11
2019-10
2019-09
2019-08
2019-07
2019-06
2019-05
2019-04
2019-03
2019-02
2019-01
2018-12
2018-11
2018-10
pm25
24 (Moderate)
30 (Moderate)
32 (Moderate)
33 (Moderate)
37 (Unhealthy for Sensitive Groups)
53 (Unhealthy for Sensitive Groups)
38 (Unhealthy for Sensitive Groups)
30 (Moderate)
35 (Moderate)
31 (Moderate)
23 (Moderate)
20 (Moderate)
31 (Moderate)
29 (Moderate)
31 (Moderate)
36 (Unhealthy for Sensitive Groups)
68 (Unhealthy)
45 (Unhealthy for Sensitive Groups)
29 (Moderate)
23 (Moderate)
co
1 (Good)
836 (Good)
862 (Good)
742 (Good)
937 (Good)
937 (Good)
862 (Good)
863 (Good)
1 (Good)
1 (Good)
1 (Good)
1 (Good)
951 (Good)
1 (Good)
696 (Good)
1 (Good)
1 (Good)
949 (Good)
969 (Good)
819 (Good)
no2
7.8 (Good)
12 (Good)
11 (Good)
4.5 (Good)
4.1 (Good)
15 (Good)
11 (Good)
9.2 (Good)
15 (Good)
11 (Good)
6.7 (Good)
5.6 (Good)
11 (Good)
11 (Good)
9.9 (Good)
3.7 (Good)
11 (Good)
12 (Good)
14 (Good)
16 (Good)
o3
97 (Moderate)
110 (Moderate)
79 (Moderate)
68 (Good)
64 (Good)
74 (Moderate)
83 (Moderate)
95 (Moderate)
131 (Unhealthy for Sensitive Groups)
110 (Moderate)
92 (Moderate)
83 (Moderate)
91 (Moderate)
93 (Moderate)
93 (Moderate)
71 (Moderate)
68 (Good)
59 (Good)
85 (Moderate)
91 (Moderate)
pm10
33 (Moderate)
40 (Moderate)
38 (Moderate)
32 (Moderate)
34 (Moderate)
59 (Unhealthy for Sensitive Groups)
50 (Moderate)
49 (Moderate)
52 (Unhealthy for Sensitive Groups)
45 (Moderate)
36 (Moderate)
36 (Moderate)
52 (Unhealthy for Sensitive Groups)
48 (Moderate)
47 (Moderate)
44 (Moderate)
81 (Unhealthy)
62 (Unhealthy for Sensitive Groups)
42 (Moderate)
41 (Moderate)
so2
6.7 (Good)
11 (Good)
6.1 (Good)
4.5 (Good)
5.3 (Good)
9.5 (Good)
10 (Good)
8.4 (Good)
11 (Good)
3.9 (Good)
7.1 (Good)
7.2 (Good)
4.7 (Good)
5.2 (Good)
5.9 (Good)
3.8 (Good)
5.6 (Good)
6.5 (Good)
6 (Good)
6.5 (Good)
data source »
林科所
Friday, May 27, 2022, 12:00 PM
PM10 179 (Very bad Hazardous)
particulate matter (PM10) suspended dust
PM2,5 35 (Unhealthy for Sensitive Groups)
particulate matter (PM2.5) dust
O3 0.04 (Good)
ozone (O3)
NO2 0 (Good)
nitrogen dioxide (NO2)
SO2 0 (Good)
sulfur dioxide (SO2)
林科所
index
2022-05-27
pm10
56
pm25
56
o3
0.03
no2
0
so2
0
林科所
2018-10 2020-05
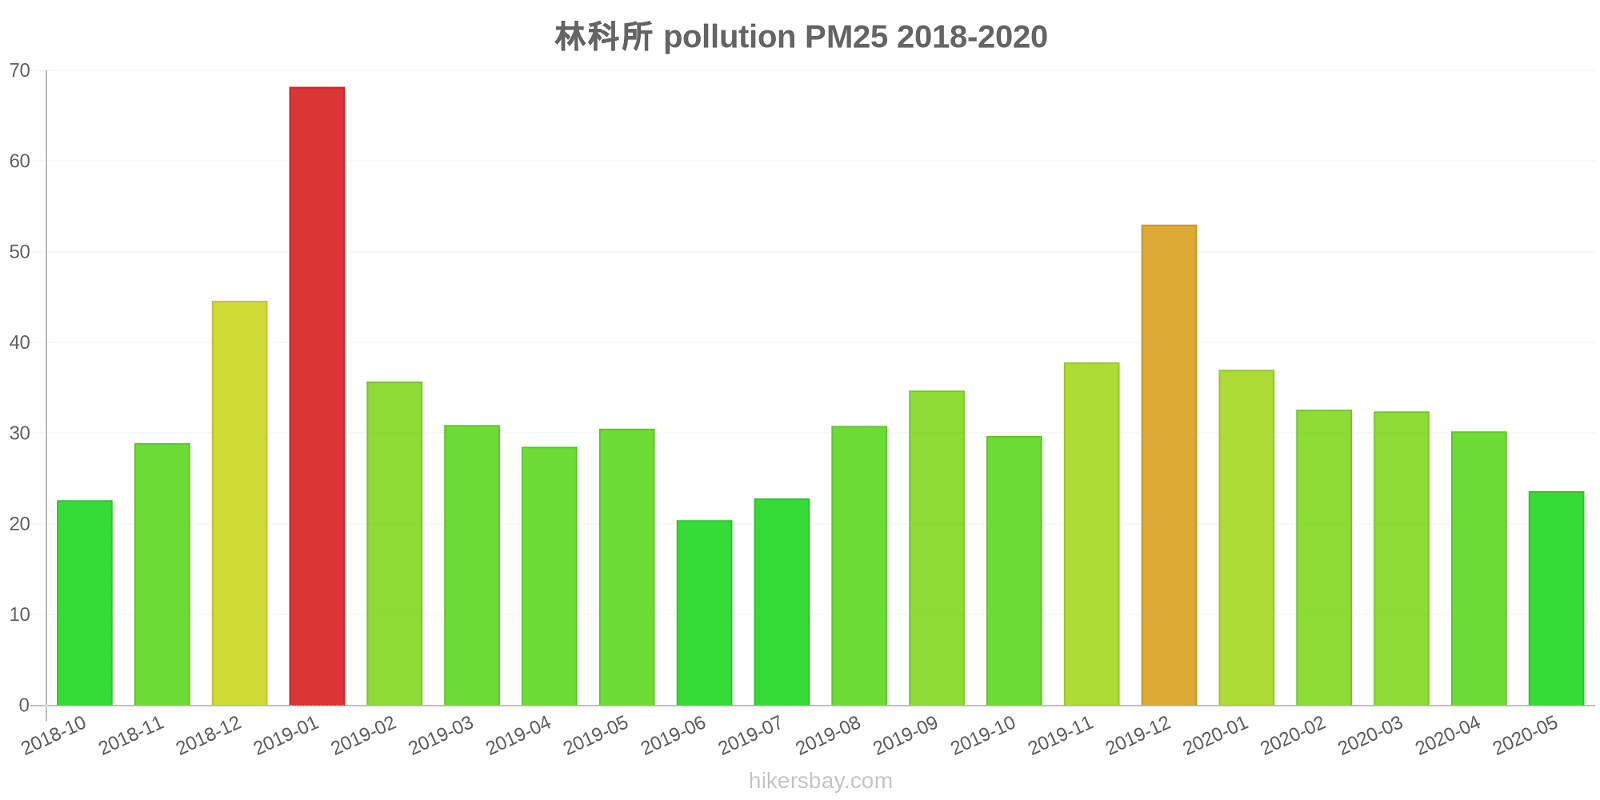
index
2020-05
2020-04
2020-03
2020-02
2020-01
2019-12
2019-11
2019-10
2019-09
2019-08
2019-07
2019-06
2019-05
2019-04
2019-03
2019-02
2019-01
2018-12
2018-11
2018-10
pm25
24
30
32
33
37
53
38
30
35
31
23
20
31
29
31
36
68
45
29
23
co
1
836
862
742
937
937
862
863
1
1
1
1
951
1
696
1
1
949
969
819
no2
7.8
12
11
4.5
4.1
15
11
9.2
15
11
6.7
5.6
11
11
9.9
3.7
11
12
14
16
o3
97
110
79
68
64
74
83
95
131
110
92
83
91
93
93
71
68
59
85
91
pm10
33
40
38
32
34
59
50
49
52
45
36
36
52
48
47
44
81
62
42
41
so2
6.7
11
6.1
4.5
5.3
9.5
10
8.4
11
3.9
7.1
7.2
4.7
5.2
5.9
3.8
5.6
6.5
6
6.5
* Pollution data source:
https://openaq.org
(ChinaAQIData)
The data is licensed under CC-By 4.0
PM10 179 (Very bad Hazardous)
PM2,5 35 (Unhealthy for Sensitive Groups)
O3 0 (Good)
NO2 0 (Good)
SO2 0 (Good)
Data on air pollution from recent days in Qinglan Nongchang
| index | 2022-05-27 |
|---|---|
| pm10 | 56 Unhealthy for Sensitive Groups |
| pm25 | 56 Unhealthy |
| o3 | 0 Good |
| no2 | 0 Good |
| so2 | 0 Good |

| index | 2020-05 | 2020-04 | 2020-03 | 2020-02 | 2020-01 | 2019-12 | 2019-11 | 2019-10 | 2019-09 | 2019-08 | 2019-07 | 2019-06 | 2019-05 | 2019-04 | 2019-03 | 2019-02 | 2019-01 | 2018-12 | 2018-11 | 2018-10 |
|---|---|---|---|---|---|---|---|---|---|---|---|---|---|---|---|---|---|---|---|---|
| pm25 | 24 (Moderate) | 30 (Moderate) | 32 (Moderate) | 33 (Moderate) | 37 (Unhealthy for Sensitive Groups) | 53 (Unhealthy for Sensitive Groups) | 38 (Unhealthy for Sensitive Groups) | 30 (Moderate) | 35 (Moderate) | 31 (Moderate) | 23 (Moderate) | 20 (Moderate) | 31 (Moderate) | 29 (Moderate) | 31 (Moderate) | 36 (Unhealthy for Sensitive Groups) | 68 (Unhealthy) | 45 (Unhealthy for Sensitive Groups) | 29 (Moderate) | 23 (Moderate) |
| co | 1 (Good) | 836 (Good) | 862 (Good) | 742 (Good) | 937 (Good) | 937 (Good) | 862 (Good) | 863 (Good) | 1 (Good) | 1 (Good) | 1 (Good) | 1 (Good) | 951 (Good) | 1 (Good) | 696 (Good) | 1 (Good) | 1 (Good) | 949 (Good) | 969 (Good) | 819 (Good) |
| no2 | 7.8 (Good) | 12 (Good) | 11 (Good) | 4.5 (Good) | 4.1 (Good) | 15 (Good) | 11 (Good) | 9.2 (Good) | 15 (Good) | 11 (Good) | 6.7 (Good) | 5.6 (Good) | 11 (Good) | 11 (Good) | 9.9 (Good) | 3.7 (Good) | 11 (Good) | 12 (Good) | 14 (Good) | 16 (Good) |
| o3 | 97 (Moderate) | 110 (Moderate) | 79 (Moderate) | 68 (Good) | 64 (Good) | 74 (Moderate) | 83 (Moderate) | 95 (Moderate) | 131 (Unhealthy for Sensitive Groups) | 110 (Moderate) | 92 (Moderate) | 83 (Moderate) | 91 (Moderate) | 93 (Moderate) | 93 (Moderate) | 71 (Moderate) | 68 (Good) | 59 (Good) | 85 (Moderate) | 91 (Moderate) |
| pm10 | 33 (Moderate) | 40 (Moderate) | 38 (Moderate) | 32 (Moderate) | 34 (Moderate) | 59 (Unhealthy for Sensitive Groups) | 50 (Moderate) | 49 (Moderate) | 52 (Unhealthy for Sensitive Groups) | 45 (Moderate) | 36 (Moderate) | 36 (Moderate) | 52 (Unhealthy for Sensitive Groups) | 48 (Moderate) | 47 (Moderate) | 44 (Moderate) | 81 (Unhealthy) | 62 (Unhealthy for Sensitive Groups) | 42 (Moderate) | 41 (Moderate) |
| so2 | 6.7 (Good) | 11 (Good) | 6.1 (Good) | 4.5 (Good) | 5.3 (Good) | 9.5 (Good) | 10 (Good) | 8.4 (Good) | 11 (Good) | 3.9 (Good) | 7.1 (Good) | 7.2 (Good) | 4.7 (Good) | 5.2 (Good) | 5.9 (Good) | 3.8 (Good) | 5.6 (Good) | 6.5 (Good) | 6 (Good) | 6.5 (Good) |
PM10 179 (Very bad Hazardous)
particulate matter (PM10) suspended dustPM2,5 35 (Unhealthy for Sensitive Groups)
particulate matter (PM2.5) dustO3 0.04 (Good)
ozone (O3)NO2 0 (Good)
nitrogen dioxide (NO2)SO2 0 (Good)
sulfur dioxide (SO2)林科所
| index | 2022-05-27 |
|---|---|
| pm10 | 56 |
| pm25 | 56 |
| o3 | 0.03 |
| no2 | 0 |
| so2 | 0 |
林科所

| index | 2020-05 | 2020-04 | 2020-03 | 2020-02 | 2020-01 | 2019-12 | 2019-11 | 2019-10 | 2019-09 | 2019-08 | 2019-07 | 2019-06 | 2019-05 | 2019-04 | 2019-03 | 2019-02 | 2019-01 | 2018-12 | 2018-11 | 2018-10 |
|---|---|---|---|---|---|---|---|---|---|---|---|---|---|---|---|---|---|---|---|---|
| pm25 | 24 | 30 | 32 | 33 | 37 | 53 | 38 | 30 | 35 | 31 | 23 | 20 | 31 | 29 | 31 | 36 | 68 | 45 | 29 | 23 |
| co | 1 | 836 | 862 | 742 | 937 | 937 | 862 | 863 | 1 | 1 | 1 | 1 | 951 | 1 | 696 | 1 | 1 | 949 | 969 | 819 |
| no2 | 7.8 | 12 | 11 | 4.5 | 4.1 | 15 | 11 | 9.2 | 15 | 11 | 6.7 | 5.6 | 11 | 11 | 9.9 | 3.7 | 11 | 12 | 14 | 16 |
| o3 | 97 | 110 | 79 | 68 | 64 | 74 | 83 | 95 | 131 | 110 | 92 | 83 | 91 | 93 | 93 | 71 | 68 | 59 | 85 | 91 |
| pm10 | 33 | 40 | 38 | 32 | 34 | 59 | 50 | 49 | 52 | 45 | 36 | 36 | 52 | 48 | 47 | 44 | 81 | 62 | 42 | 41 |
| so2 | 6.7 | 11 | 6.1 | 4.5 | 5.3 | 9.5 | 10 | 8.4 | 11 | 3.9 | 7.1 | 7.2 | 4.7 | 5.2 | 5.9 | 3.8 | 5.6 | 6.5 | 6 | 6.5 |