Air Pollution in Yongrencun: Real-time Air Quality Index and smog alert.
Pollution and air quality forecast for Yongrencun. Today is Tuesday, June 2, 2026. The following air pollution values have been recorded for Yongrencun:- particulate matter (PM10) suspended dust - 179 (Very bad Hazardous)
- particulate matter (PM2.5) dust - 35 (Unhealthy for Sensitive Groups)
- ozone (O3) - 0 (Good)
- nitrogen dioxide (NO2) - 0 (Good)
- sulfur dioxide (SO2) - 0 (Good)

What is the air quality in Yongrencun today? Is the air polluted in Yongrencun?. Is there smog?
What is the level of PM10 today in Yongrencun? (particulate matter (PM10) suspended dust)
The current level of particulate matter PM10 in Yongrencun is:
179 (Very bad Hazardous)
The highest PM10 values usually occur in month: 104 (January 2019).
The lowest value of particulate matter PM10 pollution in Yongrencun is usually recorded in: July (30).
What is the current level of PM2.5 in Yongrencun? (particulate matter (PM2.5) dust)
Today's PM2.5 level is:
35 (Unhealthy for Sensitive Groups)
For comparison, the highest level of PM2.5 in Yongrencun in the last 7 days was: 56 (Friday, May 27, 2022) and the lowest: 56 (Friday, May 27, 2022).
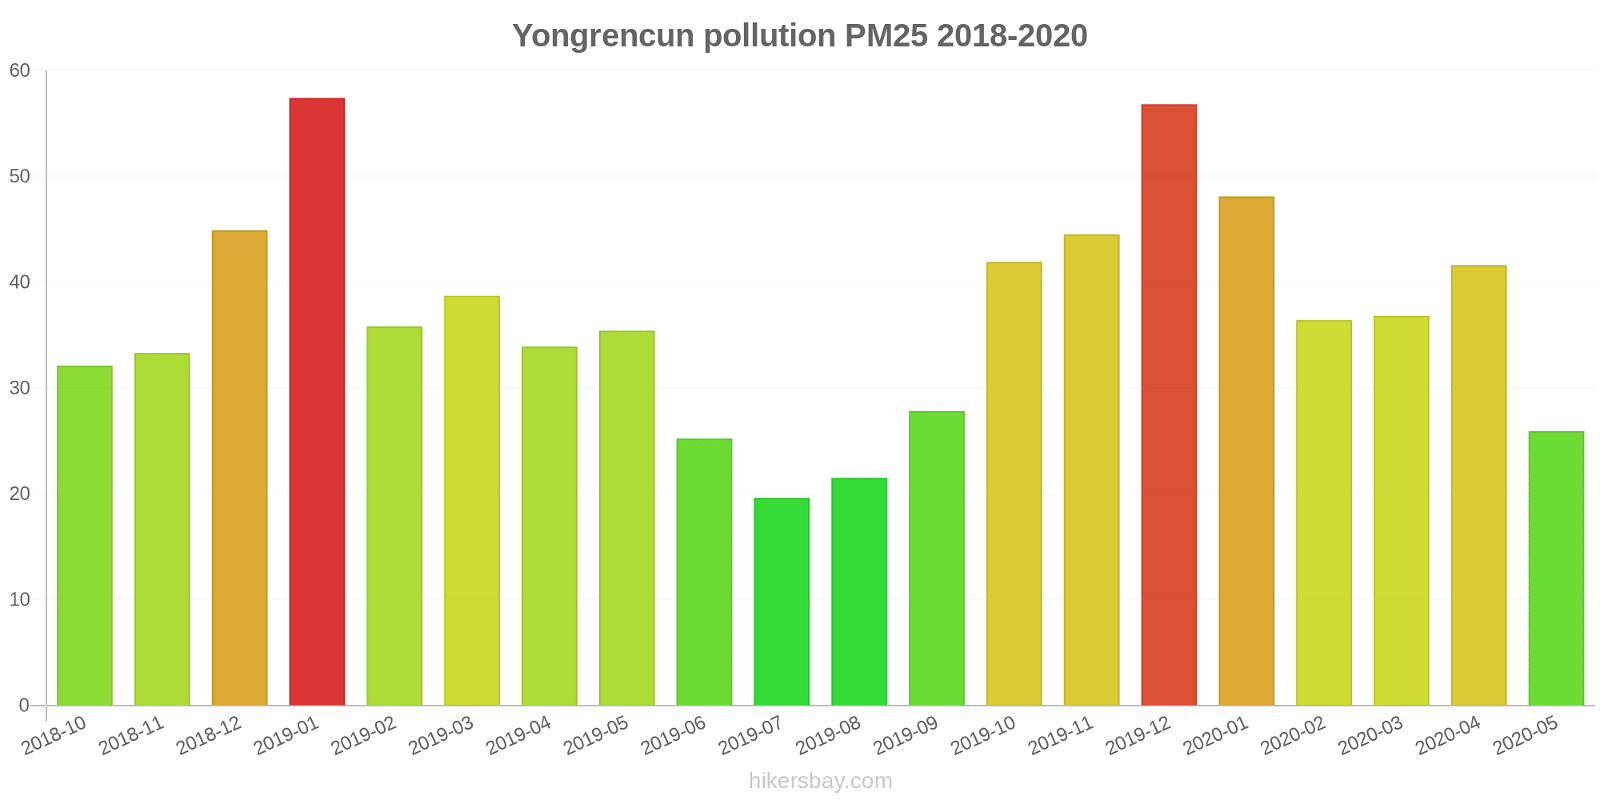
The highest PM2.5 values were recorded: 57 (January 2019).
The lowest level of particulate matter PM2.5 pollution occurs in month: July (20).
How is the O3 level today in Yongrencun? (ozone (O3))
0 (Good)
How high is the level of NO2? (nitrogen dioxide (NO2))
0 (Good)
What is the level of SO2 pollution? (sulfur dioxide (SO2))
0 (Good)
Current data Friday, May 27, 2022, 12:00 PM
PM10 179 (Very bad Hazardous)
PM2,5 35 (Unhealthy for Sensitive Groups)
O3 0 (Good)
NO2 0 (Good)
SO2 0 (Good)
Data on air pollution from recent days in Yongrencun
index
2022-05-27
pm10
56
Unhealthy for Sensitive Groups
pm25
56
Unhealthy
o3
0
Good
no2
0
Good
so2
0
Good
data source »
Air pollution in Yongrencun from October 2018 to May 2020
index
2020-05
2020-04
2020-03
2020-02
2020-01
2019-12
2019-11
2019-10
2019-09
2019-08
2019-07
2019-06
2019-05
2019-04
2019-03
2019-02
2019-01
2018-12
2018-11
2018-10
pm25
26 (Moderate)
42 (Unhealthy for Sensitive Groups)
37 (Unhealthy for Sensitive Groups)
36 (Unhealthy for Sensitive Groups)
48 (Unhealthy for Sensitive Groups)
57 (Unhealthy)
45 (Unhealthy for Sensitive Groups)
42 (Unhealthy for Sensitive Groups)
28 (Moderate)
22 (Moderate)
20 (Moderate)
25 (Moderate)
35 (Unhealthy for Sensitive Groups)
34 (Moderate)
39 (Unhealthy for Sensitive Groups)
36 (Unhealthy for Sensitive Groups)
57 (Unhealthy)
45 (Unhealthy for Sensitive Groups)
33 (Moderate)
32 (Moderate)
co
546 (Good)
568 (Good)
601 (Good)
573 (Good)
936 (Good)
1 (Good)
827 (Good)
778 (Good)
629 (Good)
842 (Good)
872 (Good)
808 (Good)
941 (Good)
1 (Good)
1 (Good)
1 (Good)
1 (Good)
1 (Good)
1 (Good)
578 (Good)
no2
20 (Good)
44 (Moderate)
30 (Good)
16 (Good)
31 (Good)
55 (Moderate)
45 (Moderate)
36 (Good)
23 (Good)
16 (Good)
23 (Good)
25 (Good)
25 (Good)
29 (Good)
31 (Good)
18 (Good)
39 (Good)
29 (Good)
39 (Good)
38 (Good)
o3
135 (Unhealthy for Sensitive Groups)
142 (Unhealthy for Sensitive Groups)
89 (Moderate)
83 (Moderate)
61 (Good)
72 (Moderate)
118 (Moderate)
126 (Unhealthy for Sensitive Groups)
146 (Unhealthy for Sensitive Groups)
142 (Unhealthy for Sensitive Groups)
106 (Moderate)
111 (Moderate)
125 (Unhealthy for Sensitive Groups)
103 (Moderate)
101 (Moderate)
56 (Good)
64 (Good)
50 (Good)
67 (Good)
96 (Moderate)
pm10
45 (Moderate)
67 (Unhealthy for Sensitive Groups)
47 (Moderate)
32 (Moderate)
48 (Moderate)
85 (Unhealthy)
93 (Unhealthy)
80 (Unhealthy for Sensitive Groups)
52 (Unhealthy for Sensitive Groups)
39 (Moderate)
30 (Moderate)
37 (Moderate)
73 (Unhealthy for Sensitive Groups)
55 (Unhealthy for Sensitive Groups)
71 (Unhealthy for Sensitive Groups)
48 (Moderate)
104 (Unhealthy)
86 (Unhealthy)
71 (Unhealthy for Sensitive Groups)
78 (Unhealthy for Sensitive Groups)
so2
14 (Good)
16 (Good)
11 (Good)
7.5 (Good)
7.2 (Good)
11 (Good)
12 (Good)
12 (Good)
9.6 (Good)
8.6 (Good)
5 (Good)
7.5 (Good)
11 (Good)
9 (Good)
7.8 (Good)
2.7 (Good)
6.4 (Good)
8.8 (Good)
10 (Good)
14 (Good)
data source »
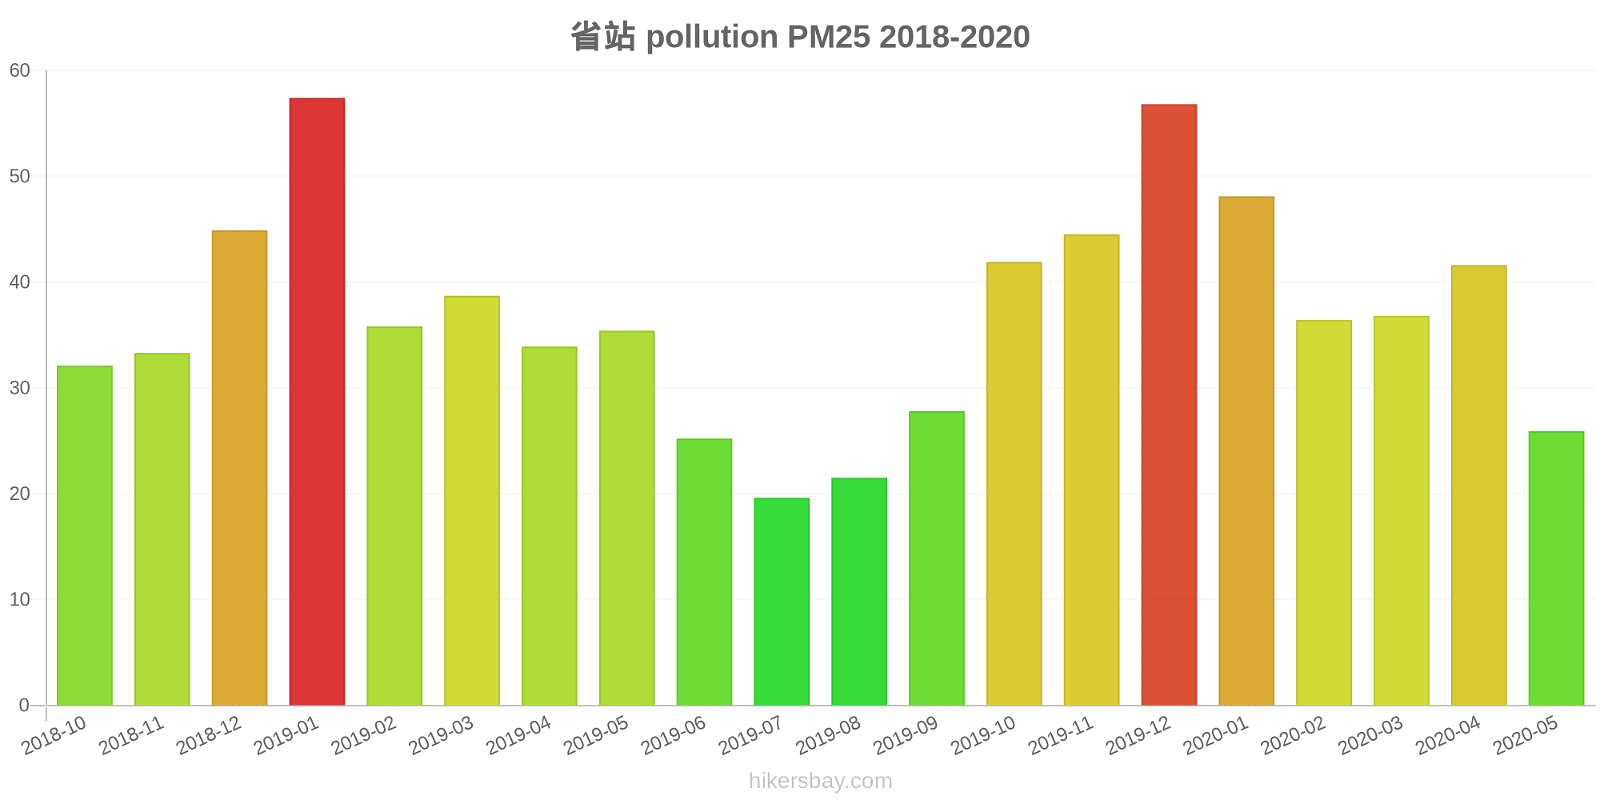
省站
Friday, May 27, 2022, 12:00 PM
PM10 179 (Very bad Hazardous)
particulate matter (PM10) suspended dust
PM2,5 35 (Unhealthy for Sensitive Groups)
particulate matter (PM2.5) dust
O3 0.04 (Good)
ozone (O3)
NO2 0 (Good)
nitrogen dioxide (NO2)
SO2 0 (Good)
sulfur dioxide (SO2)
省站
index
2022-05-27
pm10
56
pm25
56
o3
0.03
no2
0
so2
0
省站
2018-10 2020-05
index
2020-05
2020-04
2020-03
2020-02
2020-01
2019-12
2019-11
2019-10
2019-09
2019-08
2019-07
2019-06
2019-05
2019-04
2019-03
2019-02
2019-01
2018-12
2018-11
2018-10
pm25
26
42
37
36
48
57
45
42
28
22
20
25
35
34
39
36
57
45
33
32
co
546
568
601
573
936
1
827
778
629
842
872
808
941
1
1
1
1
1
1
578
no2
20
44
30
16
31
55
45
36
23
16
23
25
25
29
31
18
39
29
39
38
o3
135
142
89
83
61
72
118
126
146
142
106
111
125
103
101
56
64
50
67
96
pm10
45
67
47
32
48
85
93
80
52
39
30
37
73
55
71
48
104
86
71
78
so2
14
16
11
7.5
7.2
11
12
12
9.6
8.6
5
7.5
11
9
7.8
2.7
6.4
8.8
10
14
* Pollution data source:
https://openaq.org
(ChinaAQIData)
The data is licensed under CC-By 4.0
PM10 179 (Very bad Hazardous)
PM2,5 35 (Unhealthy for Sensitive Groups)
O3 0 (Good)
NO2 0 (Good)
SO2 0 (Good)
Data on air pollution from recent days in Yongrencun
| index | 2022-05-27 |
|---|---|
| pm10 | 56 Unhealthy for Sensitive Groups |
| pm25 | 56 Unhealthy |
| o3 | 0 Good |
| no2 | 0 Good |
| so2 | 0 Good |

| index | 2020-05 | 2020-04 | 2020-03 | 2020-02 | 2020-01 | 2019-12 | 2019-11 | 2019-10 | 2019-09 | 2019-08 | 2019-07 | 2019-06 | 2019-05 | 2019-04 | 2019-03 | 2019-02 | 2019-01 | 2018-12 | 2018-11 | 2018-10 |
|---|---|---|---|---|---|---|---|---|---|---|---|---|---|---|---|---|---|---|---|---|
| pm25 | 26 (Moderate) | 42 (Unhealthy for Sensitive Groups) | 37 (Unhealthy for Sensitive Groups) | 36 (Unhealthy for Sensitive Groups) | 48 (Unhealthy for Sensitive Groups) | 57 (Unhealthy) | 45 (Unhealthy for Sensitive Groups) | 42 (Unhealthy for Sensitive Groups) | 28 (Moderate) | 22 (Moderate) | 20 (Moderate) | 25 (Moderate) | 35 (Unhealthy for Sensitive Groups) | 34 (Moderate) | 39 (Unhealthy for Sensitive Groups) | 36 (Unhealthy for Sensitive Groups) | 57 (Unhealthy) | 45 (Unhealthy for Sensitive Groups) | 33 (Moderate) | 32 (Moderate) |
| co | 546 (Good) | 568 (Good) | 601 (Good) | 573 (Good) | 936 (Good) | 1 (Good) | 827 (Good) | 778 (Good) | 629 (Good) | 842 (Good) | 872 (Good) | 808 (Good) | 941 (Good) | 1 (Good) | 1 (Good) | 1 (Good) | 1 (Good) | 1 (Good) | 1 (Good) | 578 (Good) |
| no2 | 20 (Good) | 44 (Moderate) | 30 (Good) | 16 (Good) | 31 (Good) | 55 (Moderate) | 45 (Moderate) | 36 (Good) | 23 (Good) | 16 (Good) | 23 (Good) | 25 (Good) | 25 (Good) | 29 (Good) | 31 (Good) | 18 (Good) | 39 (Good) | 29 (Good) | 39 (Good) | 38 (Good) |
| o3 | 135 (Unhealthy for Sensitive Groups) | 142 (Unhealthy for Sensitive Groups) | 89 (Moderate) | 83 (Moderate) | 61 (Good) | 72 (Moderate) | 118 (Moderate) | 126 (Unhealthy for Sensitive Groups) | 146 (Unhealthy for Sensitive Groups) | 142 (Unhealthy for Sensitive Groups) | 106 (Moderate) | 111 (Moderate) | 125 (Unhealthy for Sensitive Groups) | 103 (Moderate) | 101 (Moderate) | 56 (Good) | 64 (Good) | 50 (Good) | 67 (Good) | 96 (Moderate) |
| pm10 | 45 (Moderate) | 67 (Unhealthy for Sensitive Groups) | 47 (Moderate) | 32 (Moderate) | 48 (Moderate) | 85 (Unhealthy) | 93 (Unhealthy) | 80 (Unhealthy for Sensitive Groups) | 52 (Unhealthy for Sensitive Groups) | 39 (Moderate) | 30 (Moderate) | 37 (Moderate) | 73 (Unhealthy for Sensitive Groups) | 55 (Unhealthy for Sensitive Groups) | 71 (Unhealthy for Sensitive Groups) | 48 (Moderate) | 104 (Unhealthy) | 86 (Unhealthy) | 71 (Unhealthy for Sensitive Groups) | 78 (Unhealthy for Sensitive Groups) |
| so2 | 14 (Good) | 16 (Good) | 11 (Good) | 7.5 (Good) | 7.2 (Good) | 11 (Good) | 12 (Good) | 12 (Good) | 9.6 (Good) | 8.6 (Good) | 5 (Good) | 7.5 (Good) | 11 (Good) | 9 (Good) | 7.8 (Good) | 2.7 (Good) | 6.4 (Good) | 8.8 (Good) | 10 (Good) | 14 (Good) |
PM10 179 (Very bad Hazardous)
particulate matter (PM10) suspended dustPM2,5 35 (Unhealthy for Sensitive Groups)
particulate matter (PM2.5) dustO3 0.04 (Good)
ozone (O3)NO2 0 (Good)
nitrogen dioxide (NO2)SO2 0 (Good)
sulfur dioxide (SO2)省站
| index | 2022-05-27 |
|---|---|
| pm10 | 56 |
| pm25 | 56 |
| o3 | 0.03 |
| no2 | 0 |
| so2 | 0 |
省站

| index | 2020-05 | 2020-04 | 2020-03 | 2020-02 | 2020-01 | 2019-12 | 2019-11 | 2019-10 | 2019-09 | 2019-08 | 2019-07 | 2019-06 | 2019-05 | 2019-04 | 2019-03 | 2019-02 | 2019-01 | 2018-12 | 2018-11 | 2018-10 |
|---|---|---|---|---|---|---|---|---|---|---|---|---|---|---|---|---|---|---|---|---|
| pm25 | 26 | 42 | 37 | 36 | 48 | 57 | 45 | 42 | 28 | 22 | 20 | 25 | 35 | 34 | 39 | 36 | 57 | 45 | 33 | 32 |
| co | 546 | 568 | 601 | 573 | 936 | 1 | 827 | 778 | 629 | 842 | 872 | 808 | 941 | 1 | 1 | 1 | 1 | 1 | 1 | 578 |
| no2 | 20 | 44 | 30 | 16 | 31 | 55 | 45 | 36 | 23 | 16 | 23 | 25 | 25 | 29 | 31 | 18 | 39 | 29 | 39 | 38 |
| o3 | 135 | 142 | 89 | 83 | 61 | 72 | 118 | 126 | 146 | 142 | 106 | 111 | 125 | 103 | 101 | 56 | 64 | 50 | 67 | 96 |
| pm10 | 45 | 67 | 47 | 32 | 48 | 85 | 93 | 80 | 52 | 39 | 30 | 37 | 73 | 55 | 71 | 48 | 104 | 86 | 71 | 78 |
| so2 | 14 | 16 | 11 | 7.5 | 7.2 | 11 | 12 | 12 | 9.6 | 8.6 | 5 | 7.5 | 11 | 9 | 7.8 | 2.7 | 6.4 | 8.8 | 10 | 14 |