Air Pollution in Zhangjiacun: Real-time Air Quality Index and smog alert.
Pollution and air quality forecast for Zhangjiacun. Today is Tuesday, June 2, 2026. The following air pollution values have been recorded for Zhangjiacun:- particulate matter (PM10) suspended dust - 179 (Very bad Hazardous)
- particulate matter (PM2.5) dust - 35 (Unhealthy for Sensitive Groups)
- ozone (O3) - 0 (Good)
- nitrogen dioxide (NO2) - 0 (Good)
- sulfur dioxide (SO2) - 0 (Good)

What is the air quality in Zhangjiacun today? Is the air polluted in Zhangjiacun?. Is there smog?
What is the level of PM10 today in Zhangjiacun? (particulate matter (PM10) suspended dust)
The current level of particulate matter PM10 in Zhangjiacun is:
179 (Very bad Hazardous)
The highest PM10 values usually occur in month: 76 (November 2019).
The lowest value of particulate matter PM10 pollution in Zhangjiacun is usually recorded in: July (27).
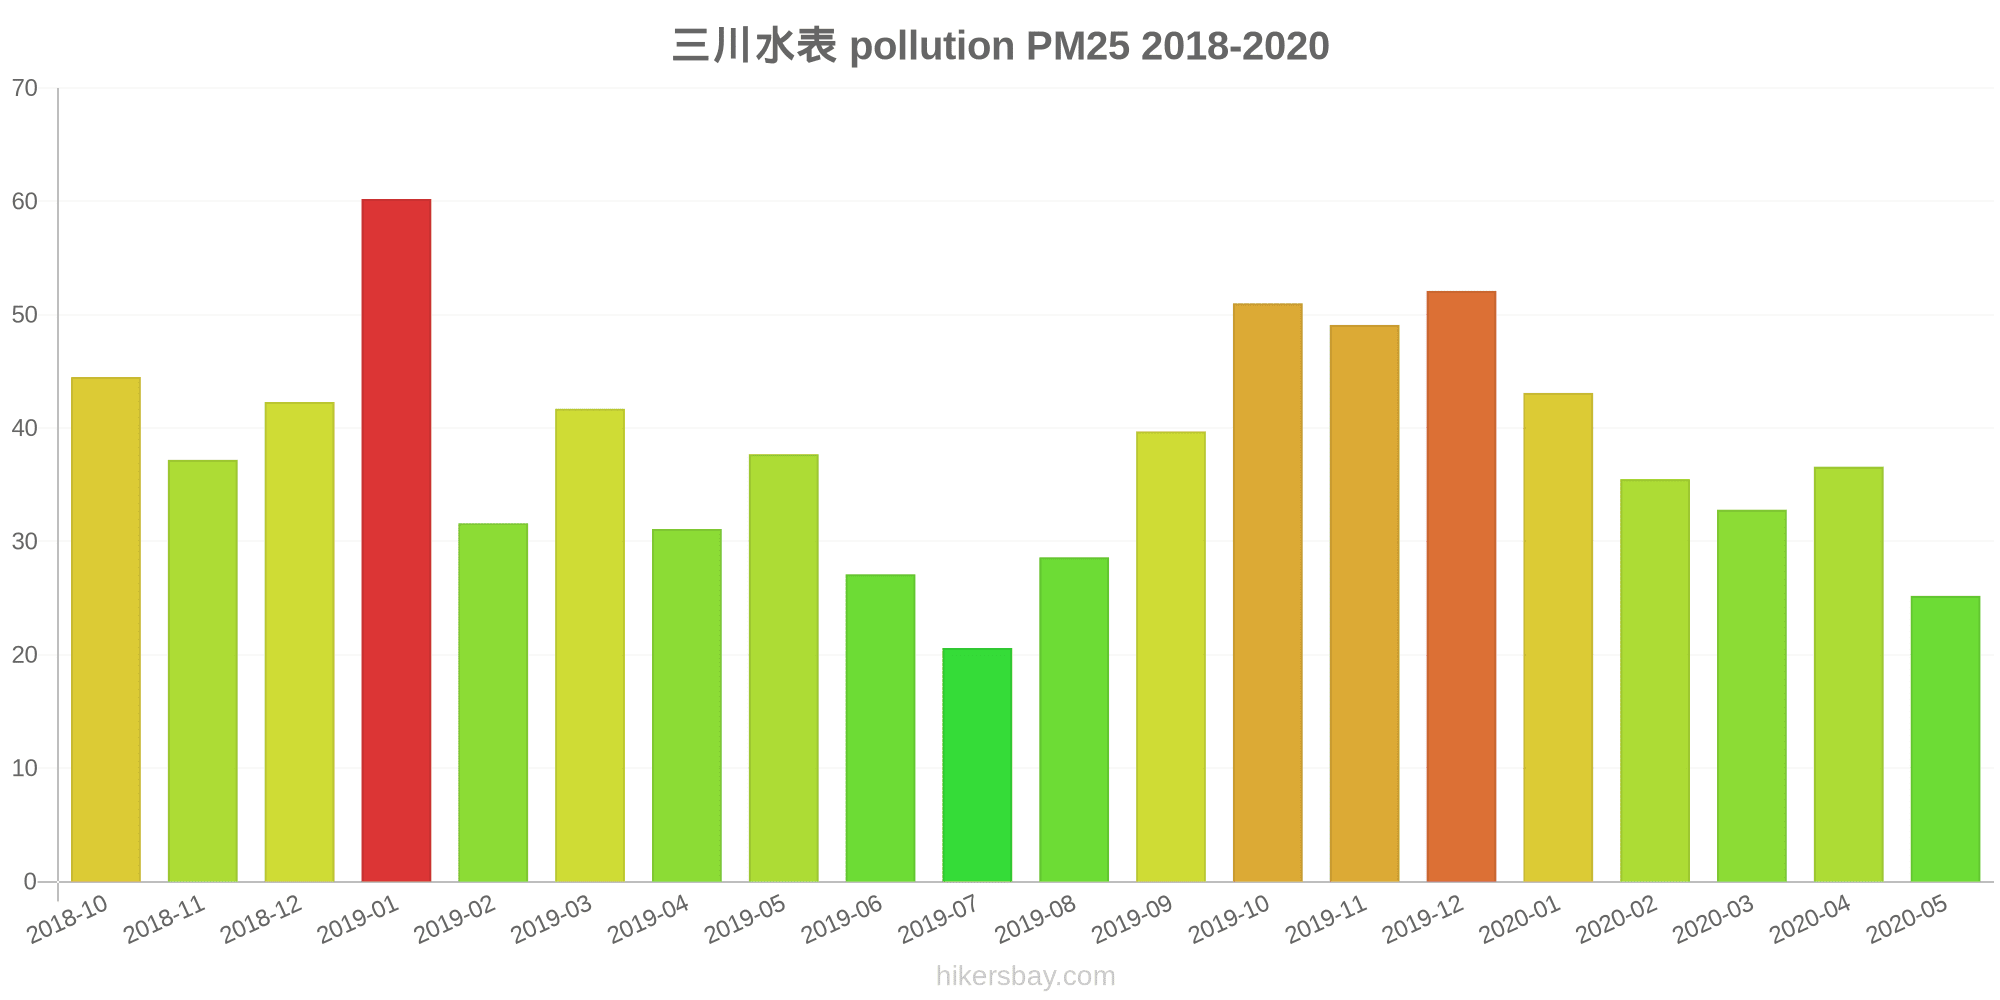
What is the current level of PM2.5 in Zhangjiacun? (particulate matter (PM2.5) dust)
Today's PM2.5 level is:
35 (Unhealthy for Sensitive Groups)
For comparison, the highest level of PM2.5 in Zhangjiacun in the last 7 days was: 56 (Friday, May 27, 2022) and the lowest: 56 (Friday, May 27, 2022).
The highest PM2.5 values were recorded: 60 (January 2019).
The lowest level of particulate matter PM2.5 pollution occurs in month: July (21).
How is the O3 level today in Zhangjiacun? (ozone (O3))
0 (Good)
How high is the level of NO2? (nitrogen dioxide (NO2))
0 (Good)
What is the level of SO2 pollution? (sulfur dioxide (SO2))
0 (Good)
Current data Friday, May 27, 2022, 12:00 PM
PM10 179 (Very bad Hazardous)
PM2,5 35 (Unhealthy for Sensitive Groups)
O3 0 (Good)
NO2 0 (Good)
SO2 0 (Good)
Data on air pollution from recent days in Zhangjiacun
index
2022-05-27
pm10
56
Unhealthy for Sensitive Groups
pm25
56
Unhealthy
o3
0
Good
no2
0
Good
so2
0
Good
data source »
Air pollution in Zhangjiacun from October 2018 to May 2020

index
2020-05
2020-04
2020-03
2020-02
2020-01
2019-12
2019-11
2019-10
2019-09
2019-08
2019-07
2019-06
2019-05
2019-04
2019-03
2019-02
2019-01
2018-12
2018-11
2018-10
pm25
25 (Moderate)
37 (Unhealthy for Sensitive Groups)
33 (Moderate)
36 (Unhealthy for Sensitive Groups)
43 (Unhealthy for Sensitive Groups)
52 (Unhealthy for Sensitive Groups)
49 (Unhealthy for Sensitive Groups)
51 (Unhealthy for Sensitive Groups)
40 (Unhealthy for Sensitive Groups)
29 (Moderate)
21 (Moderate)
27 (Moderate)
38 (Unhealthy for Sensitive Groups)
31 (Moderate)
42 (Unhealthy for Sensitive Groups)
32 (Moderate)
60 (Unhealthy)
42 (Unhealthy for Sensitive Groups)
37 (Unhealthy for Sensitive Groups)
45 (Unhealthy for Sensitive Groups)
co
517 (Good)
458 (Good)
538 (Good)
406 (Good)
699 (Good)
559 (Good)
522 (Good)
749 (Good)
569 (Good)
451 (Good)
367 (Good)
451 (Good)
462 (Good)
550 (Good)
550 (Good)
657 (Good)
719 (Good)
536 (Good)
421 (Good)
619 (Good)
no2
15 (Good)
18 (Good)
18 (Good)
10 (Good)
22 (Good)
38 (Good)
36 (Good)
30 (Good)
25 (Good)
13 (Good)
13 (Good)
18 (Good)
19 (Good)
22 (Good)
30 (Good)
15 (Good)
35 (Good)
32 (Good)
30 (Good)
27 (Good)
o3
131 (Unhealthy for Sensitive Groups)
142 (Unhealthy for Sensitive Groups)
86 (Moderate)
84 (Moderate)
59 (Good)
81 (Moderate)
120 (Unhealthy for Sensitive Groups)
141 (Unhealthy for Sensitive Groups)
163 (Unhealthy)
128 (Unhealthy for Sensitive Groups)
101 (Moderate)
109 (Moderate)
113 (Moderate)
93 (Moderate)
95 (Moderate)
53 (Good)
58 (Good)
50 (Good)
76 (Moderate)
118 (Moderate)
pm10
44 (Moderate)
51 (Unhealthy for Sensitive Groups)
37 (Moderate)
35 (Moderate)
41 (Moderate)
63 (Unhealthy for Sensitive Groups)
76 (Unhealthy for Sensitive Groups)
69 (Unhealthy for Sensitive Groups)
60 (Unhealthy for Sensitive Groups)
43 (Moderate)
27 (Moderate)
38 (Moderate)
56 (Unhealthy for Sensitive Groups)
45 (Moderate)
58 (Unhealthy for Sensitive Groups)
28 (Moderate)
64 (Unhealthy for Sensitive Groups)
51 (Unhealthy for Sensitive Groups)
53 (Unhealthy for Sensitive Groups)
63 (Unhealthy for Sensitive Groups)
so2
16 (Good)
16 (Good)
17 (Good)
14 (Good)
15 (Good)
28 (Good)
23 (Good)
22 (Good)
19 (Good)
10 (Good)
10 (Good)
13 (Good)
11 (Good)
15 (Good)
15 (Good)
10 (Good)
13 (Good)
15 (Good)
16 (Good)
21 (Good)
data source »
三川水表
Friday, May 27, 2022, 12:00 PM
PM10 179 (Very bad Hazardous)
particulate matter (PM10) suspended dust
PM2,5 35 (Unhealthy for Sensitive Groups)
particulate matter (PM2.5) dust
O3 0.04 (Good)
ozone (O3)
NO2 0 (Good)
nitrogen dioxide (NO2)
SO2 0 (Good)
sulfur dioxide (SO2)
三川水表
index
2022-05-27
pm10
56
pm25
56
o3
0.03
no2
0
so2
0
三川水表
2018-10 2020-05

index
2020-05
2020-04
2020-03
2020-02
2020-01
2019-12
2019-11
2019-10
2019-09
2019-08
2019-07
2019-06
2019-05
2019-04
2019-03
2019-02
2019-01
2018-12
2018-11
2018-10
pm25
25
37
33
36
43
52
49
51
40
29
21
27
38
31
42
32
60
42
37
45
co
517
458
538
406
699
559
522
749
569
451
367
451
462
550
550
657
719
536
421
619
no2
15
18
18
10
22
38
36
30
25
13
13
18
19
22
30
15
35
32
30
27
o3
131
142
86
84
59
81
120
141
163
128
101
109
113
93
95
53
58
50
76
118
pm10
44
51
37
35
41
63
76
69
60
43
27
38
56
45
58
28
64
51
53
63
so2
16
16
17
14
15
28
23
22
19
10
10
13
11
15
15
10
13
15
16
21
* Pollution data source:
https://openaq.org
(ChinaAQIData)
The data is licensed under CC-By 4.0
PM10 179 (Very bad Hazardous)
PM2,5 35 (Unhealthy for Sensitive Groups)
O3 0 (Good)
NO2 0 (Good)
SO2 0 (Good)
Data on air pollution from recent days in Zhangjiacun
| index | 2022-05-27 |
|---|---|
| pm10 | 56 Unhealthy for Sensitive Groups |
| pm25 | 56 Unhealthy |
| o3 | 0 Good |
| no2 | 0 Good |
| so2 | 0 Good |

| index | 2020-05 | 2020-04 | 2020-03 | 2020-02 | 2020-01 | 2019-12 | 2019-11 | 2019-10 | 2019-09 | 2019-08 | 2019-07 | 2019-06 | 2019-05 | 2019-04 | 2019-03 | 2019-02 | 2019-01 | 2018-12 | 2018-11 | 2018-10 |
|---|---|---|---|---|---|---|---|---|---|---|---|---|---|---|---|---|---|---|---|---|
| pm25 | 25 (Moderate) | 37 (Unhealthy for Sensitive Groups) | 33 (Moderate) | 36 (Unhealthy for Sensitive Groups) | 43 (Unhealthy for Sensitive Groups) | 52 (Unhealthy for Sensitive Groups) | 49 (Unhealthy for Sensitive Groups) | 51 (Unhealthy for Sensitive Groups) | 40 (Unhealthy for Sensitive Groups) | 29 (Moderate) | 21 (Moderate) | 27 (Moderate) | 38 (Unhealthy for Sensitive Groups) | 31 (Moderate) | 42 (Unhealthy for Sensitive Groups) | 32 (Moderate) | 60 (Unhealthy) | 42 (Unhealthy for Sensitive Groups) | 37 (Unhealthy for Sensitive Groups) | 45 (Unhealthy for Sensitive Groups) |
| co | 517 (Good) | 458 (Good) | 538 (Good) | 406 (Good) | 699 (Good) | 559 (Good) | 522 (Good) | 749 (Good) | 569 (Good) | 451 (Good) | 367 (Good) | 451 (Good) | 462 (Good) | 550 (Good) | 550 (Good) | 657 (Good) | 719 (Good) | 536 (Good) | 421 (Good) | 619 (Good) |
| no2 | 15 (Good) | 18 (Good) | 18 (Good) | 10 (Good) | 22 (Good) | 38 (Good) | 36 (Good) | 30 (Good) | 25 (Good) | 13 (Good) | 13 (Good) | 18 (Good) | 19 (Good) | 22 (Good) | 30 (Good) | 15 (Good) | 35 (Good) | 32 (Good) | 30 (Good) | 27 (Good) |
| o3 | 131 (Unhealthy for Sensitive Groups) | 142 (Unhealthy for Sensitive Groups) | 86 (Moderate) | 84 (Moderate) | 59 (Good) | 81 (Moderate) | 120 (Unhealthy for Sensitive Groups) | 141 (Unhealthy for Sensitive Groups) | 163 (Unhealthy) | 128 (Unhealthy for Sensitive Groups) | 101 (Moderate) | 109 (Moderate) | 113 (Moderate) | 93 (Moderate) | 95 (Moderate) | 53 (Good) | 58 (Good) | 50 (Good) | 76 (Moderate) | 118 (Moderate) |
| pm10 | 44 (Moderate) | 51 (Unhealthy for Sensitive Groups) | 37 (Moderate) | 35 (Moderate) | 41 (Moderate) | 63 (Unhealthy for Sensitive Groups) | 76 (Unhealthy for Sensitive Groups) | 69 (Unhealthy for Sensitive Groups) | 60 (Unhealthy for Sensitive Groups) | 43 (Moderate) | 27 (Moderate) | 38 (Moderate) | 56 (Unhealthy for Sensitive Groups) | 45 (Moderate) | 58 (Unhealthy for Sensitive Groups) | 28 (Moderate) | 64 (Unhealthy for Sensitive Groups) | 51 (Unhealthy for Sensitive Groups) | 53 (Unhealthy for Sensitive Groups) | 63 (Unhealthy for Sensitive Groups) |
| so2 | 16 (Good) | 16 (Good) | 17 (Good) | 14 (Good) | 15 (Good) | 28 (Good) | 23 (Good) | 22 (Good) | 19 (Good) | 10 (Good) | 10 (Good) | 13 (Good) | 11 (Good) | 15 (Good) | 15 (Good) | 10 (Good) | 13 (Good) | 15 (Good) | 16 (Good) | 21 (Good) |
PM10 179 (Very bad Hazardous)
particulate matter (PM10) suspended dustPM2,5 35 (Unhealthy for Sensitive Groups)
particulate matter (PM2.5) dustO3 0.04 (Good)
ozone (O3)NO2 0 (Good)
nitrogen dioxide (NO2)SO2 0 (Good)
sulfur dioxide (SO2)三川水表
| index | 2022-05-27 |
|---|---|
| pm10 | 56 |
| pm25 | 56 |
| o3 | 0.03 |
| no2 | 0 |
| so2 | 0 |
三川水表
| index | 2020-05 | 2020-04 | 2020-03 | 2020-02 | 2020-01 | 2019-12 | 2019-11 | 2019-10 | 2019-09 | 2019-08 | 2019-07 | 2019-06 | 2019-05 | 2019-04 | 2019-03 | 2019-02 | 2019-01 | 2018-12 | 2018-11 | 2018-10 |
|---|---|---|---|---|---|---|---|---|---|---|---|---|---|---|---|---|---|---|---|---|
| pm25 | 25 | 37 | 33 | 36 | 43 | 52 | 49 | 51 | 40 | 29 | 21 | 27 | 38 | 31 | 42 | 32 | 60 | 42 | 37 | 45 |
| co | 517 | 458 | 538 | 406 | 699 | 559 | 522 | 749 | 569 | 451 | 367 | 451 | 462 | 550 | 550 | 657 | 719 | 536 | 421 | 619 |
| no2 | 15 | 18 | 18 | 10 | 22 | 38 | 36 | 30 | 25 | 13 | 13 | 18 | 19 | 22 | 30 | 15 | 35 | 32 | 30 | 27 |
| o3 | 131 | 142 | 86 | 84 | 59 | 81 | 120 | 141 | 163 | 128 | 101 | 109 | 113 | 93 | 95 | 53 | 58 | 50 | 76 | 118 |
| pm10 | 44 | 51 | 37 | 35 | 41 | 63 | 76 | 69 | 60 | 43 | 27 | 38 | 56 | 45 | 58 | 28 | 64 | 51 | 53 | 63 |
| so2 | 16 | 16 | 17 | 14 | 15 | 28 | 23 | 22 | 19 | 10 | 10 | 13 | 11 | 15 | 15 | 10 | 13 | 15 | 16 | 21 |