Air Pollution in Fenghuangcun: Real-time Air Quality Index and smog alert.
Pollution and air quality forecast for Fenghuangcun. Today is Tuesday, June 2, 2026. The following air pollution values have been recorded for Fenghuangcun:- particulate matter (PM10) suspended dust - 179 (Very bad Hazardous)
- particulate matter (PM2.5) dust - 35 (Unhealthy for Sensitive Groups)
- ozone (O3) - 0 (Good)
- nitrogen dioxide (NO2) - 0 (Good)
- sulfur dioxide (SO2) - 0 (Good)

What is the air quality in Fenghuangcun today? Is the air polluted in Fenghuangcun?. Is there smog?
What is the level of PM10 today in Fenghuangcun? (particulate matter (PM10) suspended dust)
The current level of particulate matter PM10 in Fenghuangcun is:
179 (Very bad Hazardous)
The highest PM10 values usually occur in month: 105 (November 2019).
The lowest value of particulate matter PM10 pollution in Fenghuangcun is usually recorded in: July (32).
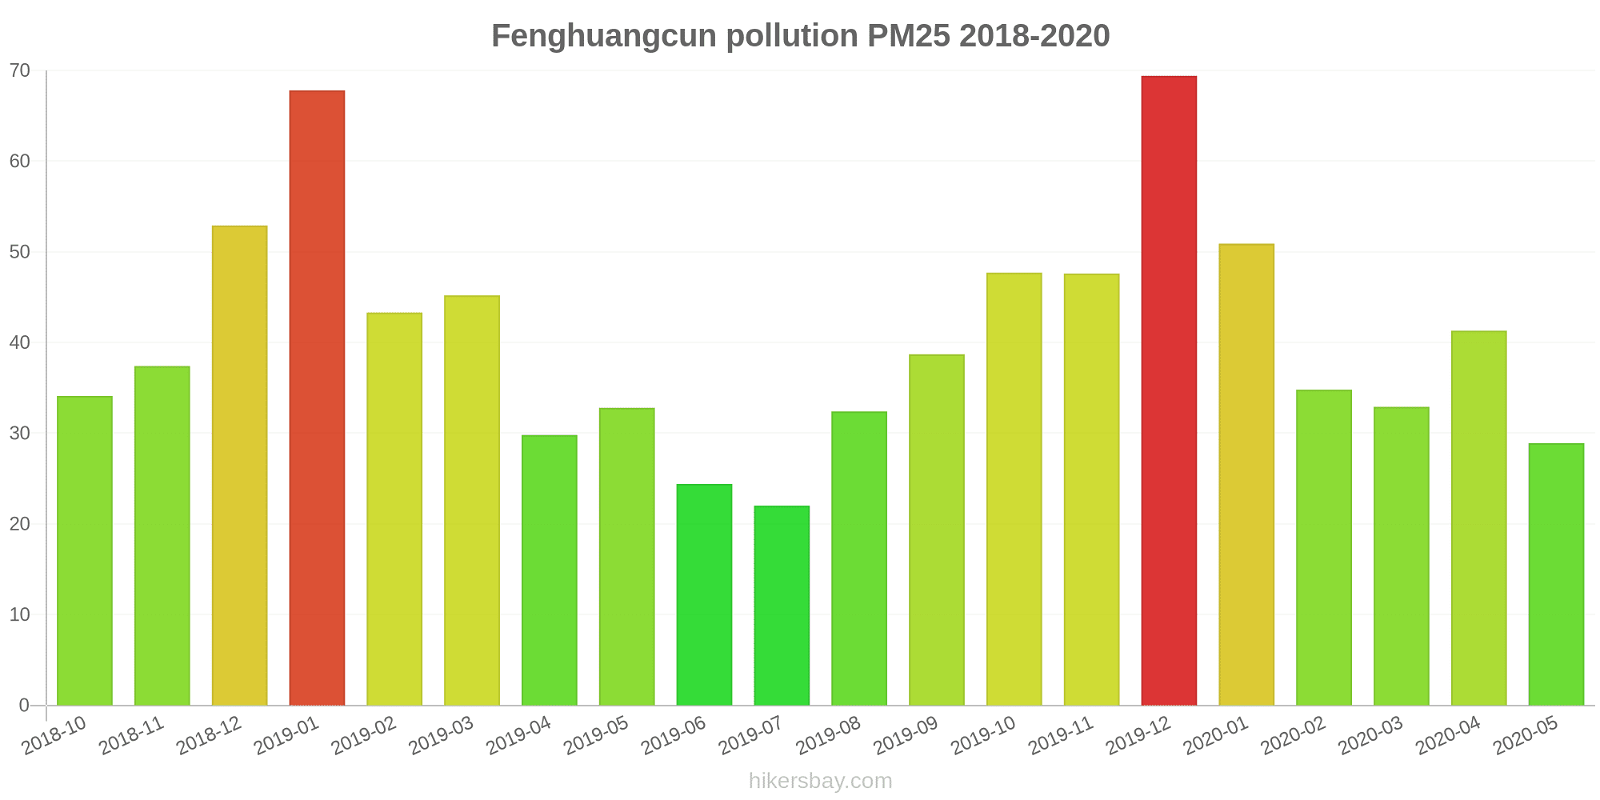
What is the current level of PM2.5 in Fenghuangcun? (particulate matter (PM2.5) dust)
Today's PM2.5 level is:
35 (Unhealthy for Sensitive Groups)
For comparison, the highest level of PM2.5 in Fenghuangcun in the last 7 days was: 56 (Friday, May 27, 2022) and the lowest: 56 (Friday, May 27, 2022).
The highest PM2.5 values were recorded: 69 (December 2019).
The lowest level of particulate matter PM2.5 pollution occurs in month: July (22).
How is the O3 level today in Fenghuangcun? (ozone (O3))
0 (Good)
How high is the level of NO2? (nitrogen dioxide (NO2))
0 (Good)
What is the level of SO2 pollution? (sulfur dioxide (SO2))
0 (Good)
Current data Friday, May 27, 2022, 12:00 PM
PM10 179 (Very bad Hazardous)
PM2,5 35 (Unhealthy for Sensitive Groups)
O3 0 (Good)
NO2 0 (Good)
SO2 0 (Good)
Data on air pollution from recent days in Fenghuangcun
index
2022-05-27
pm10
56
Unhealthy for Sensitive Groups
pm25
56
Unhealthy
o3
0
Good
no2
0
Good
so2
0
Good
data source »
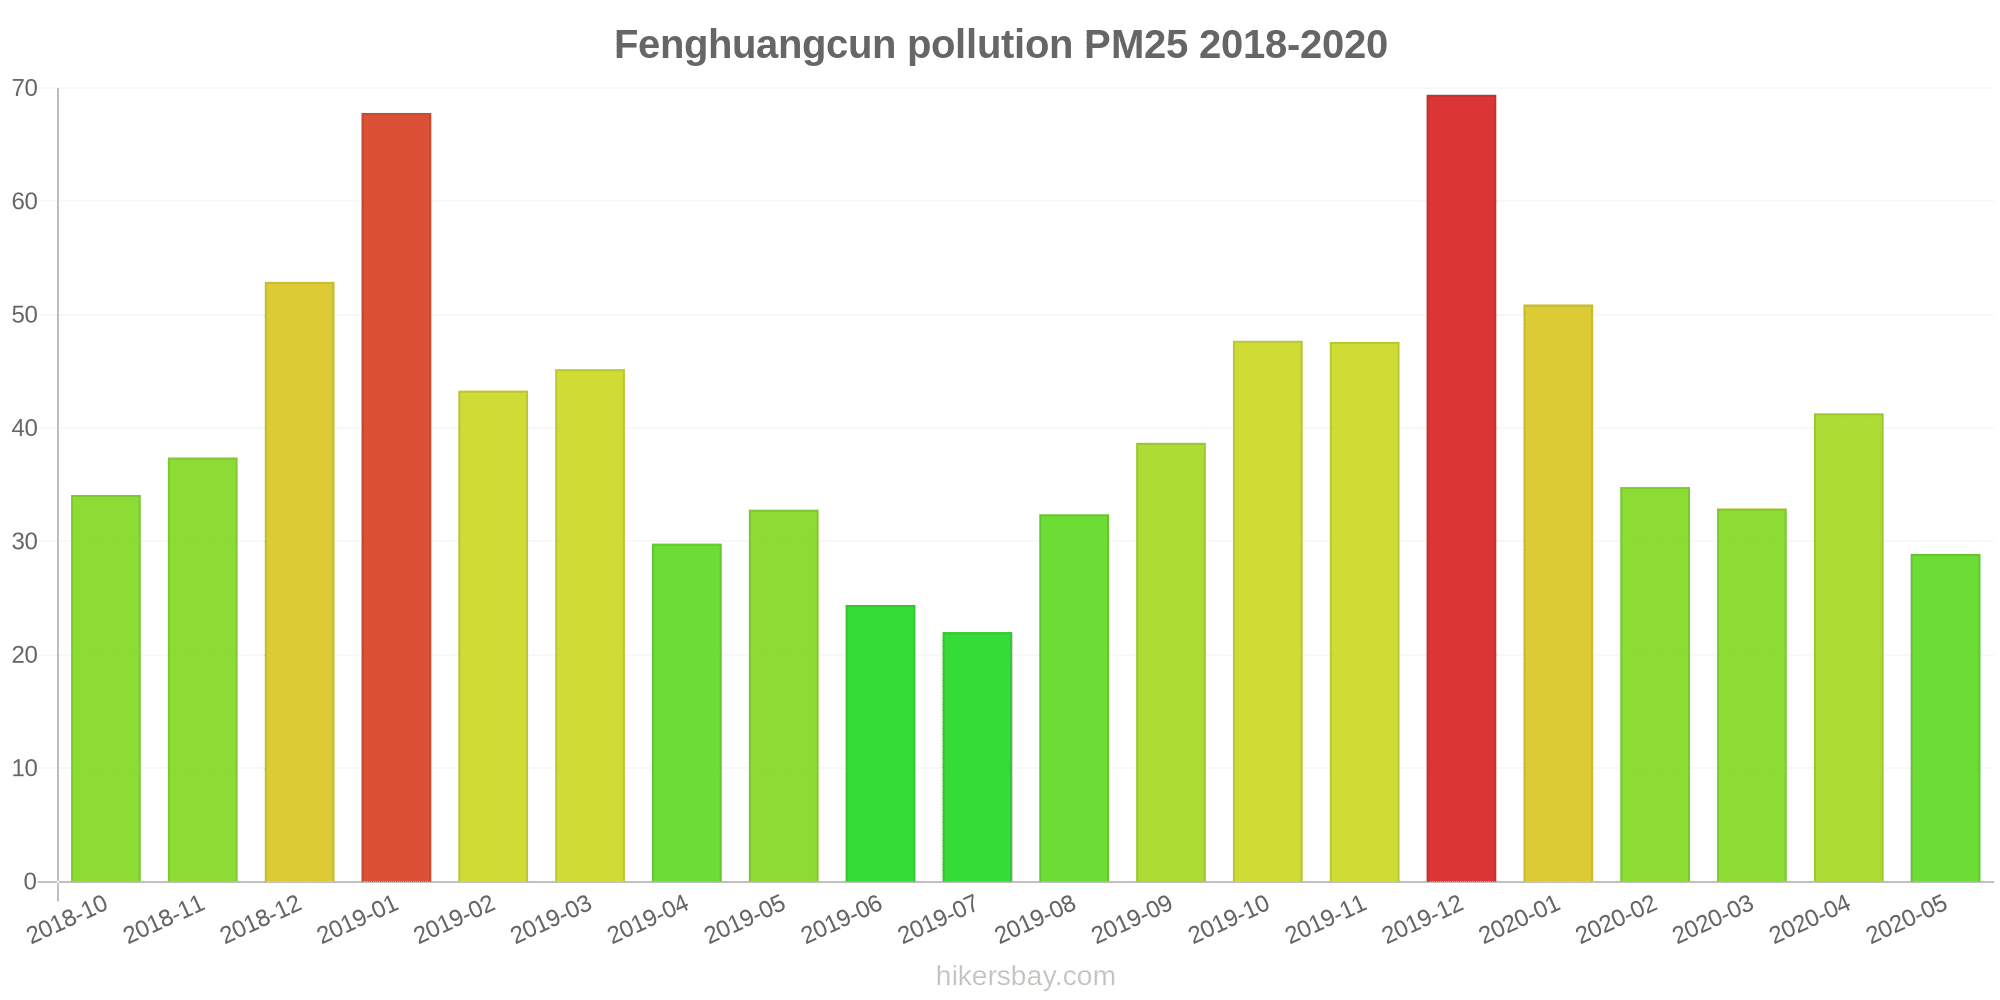
Air pollution in Fenghuangcun from October 2018 to May 2020
index
2020-05
2020-04
2020-03
2020-02
2020-01
2019-12
2019-11
2019-10
2019-09
2019-08
2019-07
2019-06
2019-05
2019-04
2019-03
2019-02
2019-01
2018-12
2018-11
2018-10
pm25
29 (Moderate)
41 (Unhealthy for Sensitive Groups)
33 (Moderate)
35 (Moderate)
51 (Unhealthy for Sensitive Groups)
69 (Unhealthy)
48 (Unhealthy for Sensitive Groups)
48 (Unhealthy for Sensitive Groups)
39 (Unhealthy for Sensitive Groups)
32 (Moderate)
22 (Moderate)
24 (Moderate)
33 (Moderate)
30 (Moderate)
45 (Unhealthy for Sensitive Groups)
43 (Unhealthy for Sensitive Groups)
68 (Unhealthy)
53 (Unhealthy for Sensitive Groups)
37 (Unhealthy for Sensitive Groups)
34 (Moderate)
co
470 (Good)
587 (Good)
616 (Good)
498 (Good)
772 (Good)
923 (Good)
710 (Good)
626 (Good)
600 (Good)
420 (Good)
374 (Good)
631 (Good)
584 (Good)
738 (Good)
688 (Good)
775 (Good)
1 (Good)
845 (Good)
893 (Good)
804 (Good)
no2
28 (Good)
48 (Moderate)
30 (Good)
22 (Good)
37 (Good)
63 (Moderate)
55 (Moderate)
44 (Moderate)
31 (Good)
24 (Good)
24 (Good)
29 (Good)
35 (Good)
37 (Good)
44 (Moderate)
33 (Good)
46 (Moderate)
36 (Good)
43 (Moderate)
45 (Moderate)
o3
139 (Unhealthy for Sensitive Groups)
139 (Unhealthy for Sensitive Groups)
88 (Moderate)
88 (Moderate)
57 (Good)
62 (Good)
106 (Moderate)
121 (Unhealthy for Sensitive Groups)
156 (Unhealthy)
146 (Unhealthy for Sensitive Groups)
129 (Unhealthy for Sensitive Groups)
137 (Unhealthy for Sensitive Groups)
130 (Unhealthy for Sensitive Groups)
97 (Moderate)
83 (Moderate)
51 (Good)
55 (Good)
53 (Good)
75 (Moderate)
106 (Moderate)
pm10
54 (Unhealthy for Sensitive Groups)
76 (Unhealthy for Sensitive Groups)
50 (Unhealthy for Sensitive Groups)
38 (Moderate)
57 (Unhealthy for Sensitive Groups)
100 (Unhealthy)
105 (Unhealthy)
90 (Unhealthy)
66 (Unhealthy for Sensitive Groups)
46 (Moderate)
32 (Moderate)
41 (Moderate)
79 (Unhealthy for Sensitive Groups)
60 (Unhealthy for Sensitive Groups)
74 (Unhealthy for Sensitive Groups)
54 (Unhealthy for Sensitive Groups)
104 (Unhealthy)
80 (Unhealthy for Sensitive Groups)
61 (Unhealthy for Sensitive Groups)
69 (Unhealthy for Sensitive Groups)
so2
11 (Good)
13 (Good)
9.4 (Good)
6.4 (Good)
6.2 (Good)
13 (Good)
14 (Good)
12 (Good)
11 (Good)
7.8 (Good)
10 (Good)
11 (Good)
8.2 (Good)
5.8 (Good)
7.1 (Good)
3.9 (Good)
11 (Good)
6.4 (Good)
6.1 (Good)
9.7 (Good)
data source »
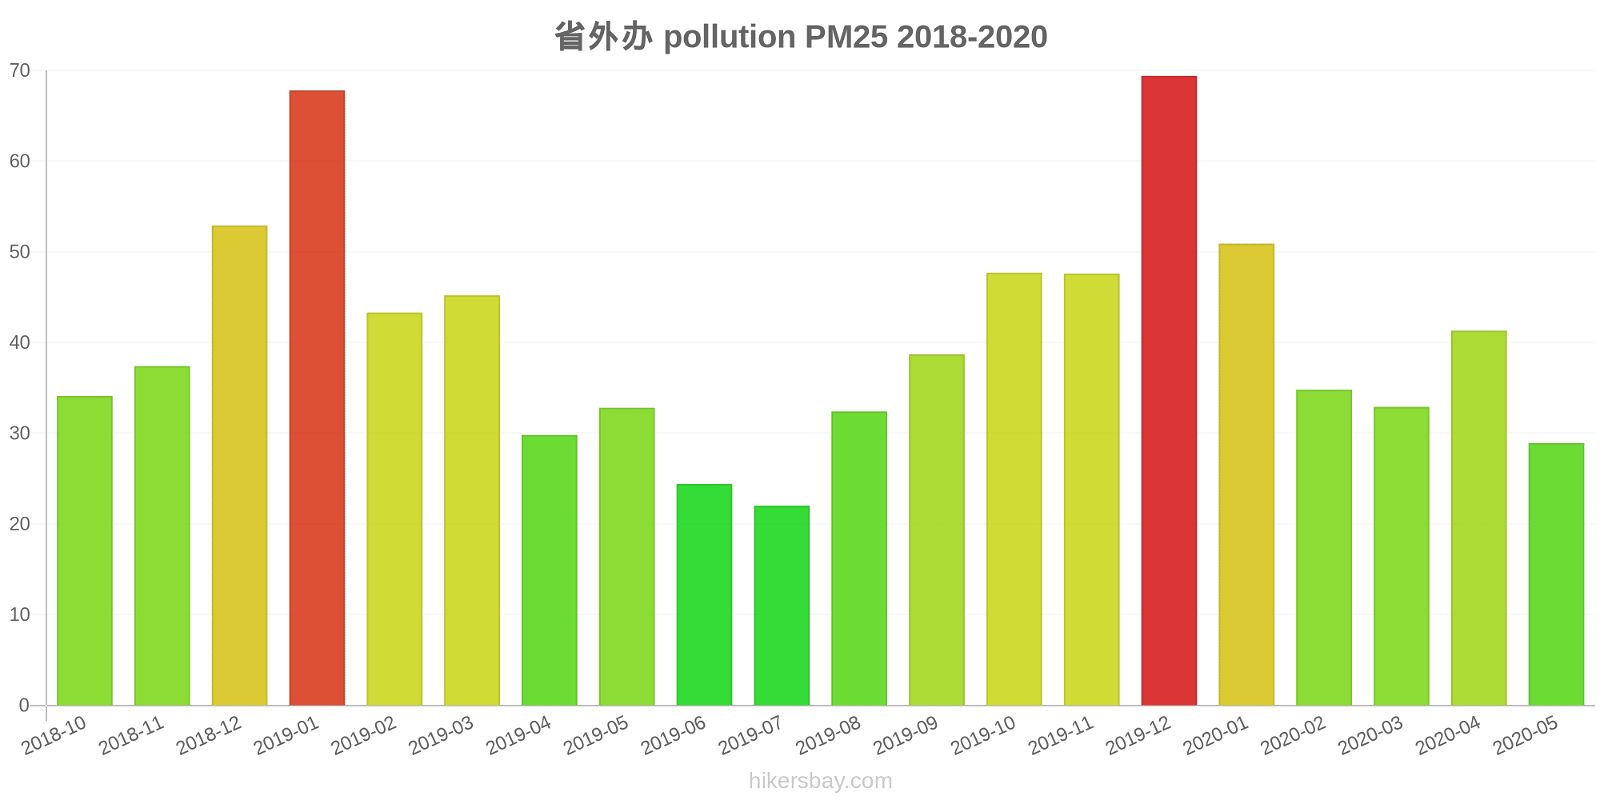
省外办
Friday, May 27, 2022, 12:00 PM
PM10 179 (Very bad Hazardous)
particulate matter (PM10) suspended dust
PM2,5 35 (Unhealthy for Sensitive Groups)
particulate matter (PM2.5) dust
O3 0.04 (Good)
ozone (O3)
NO2 0 (Good)
nitrogen dioxide (NO2)
SO2 0 (Good)
sulfur dioxide (SO2)
省外办
index
2022-05-27
pm10
56
pm25
56
o3
0.03
no2
0
so2
0
省外办
2018-10 2020-05
index
2020-05
2020-04
2020-03
2020-02
2020-01
2019-12
2019-11
2019-10
2019-09
2019-08
2019-07
2019-06
2019-05
2019-04
2019-03
2019-02
2019-01
2018-12
2018-11
2018-10
pm25
29
41
33
35
51
69
48
48
39
32
22
24
33
30
45
43
68
53
37
34
co
470
587
616
498
772
923
710
626
600
420
374
631
584
738
688
775
1
845
893
804
no2
28
48
30
22
37
63
55
44
31
24
24
29
35
37
44
33
46
36
43
45
o3
139
139
88
88
57
62
106
121
156
146
129
137
130
97
83
51
55
53
75
106
pm10
54
76
50
38
57
100
105
90
66
46
32
41
79
60
74
54
104
80
61
69
so2
11
13
9.4
6.4
6.2
13
14
12
11
7.8
10
11
8.2
5.8
7.1
3.9
11
6.4
6.1
9.7
* Pollution data source:
https://openaq.org
(ChinaAQIData)
The data is licensed under CC-By 4.0
PM10 179 (Very bad Hazardous)
PM2,5 35 (Unhealthy for Sensitive Groups)
O3 0 (Good)
NO2 0 (Good)
SO2 0 (Good)
Data on air pollution from recent days in Fenghuangcun
| index | 2022-05-27 |
|---|---|
| pm10 | 56 Unhealthy for Sensitive Groups |
| pm25 | 56 Unhealthy |
| o3 | 0 Good |
| no2 | 0 Good |
| so2 | 0 Good |
| index | 2020-05 | 2020-04 | 2020-03 | 2020-02 | 2020-01 | 2019-12 | 2019-11 | 2019-10 | 2019-09 | 2019-08 | 2019-07 | 2019-06 | 2019-05 | 2019-04 | 2019-03 | 2019-02 | 2019-01 | 2018-12 | 2018-11 | 2018-10 |
|---|---|---|---|---|---|---|---|---|---|---|---|---|---|---|---|---|---|---|---|---|
| pm25 | 29 (Moderate) | 41 (Unhealthy for Sensitive Groups) | 33 (Moderate) | 35 (Moderate) | 51 (Unhealthy for Sensitive Groups) | 69 (Unhealthy) | 48 (Unhealthy for Sensitive Groups) | 48 (Unhealthy for Sensitive Groups) | 39 (Unhealthy for Sensitive Groups) | 32 (Moderate) | 22 (Moderate) | 24 (Moderate) | 33 (Moderate) | 30 (Moderate) | 45 (Unhealthy for Sensitive Groups) | 43 (Unhealthy for Sensitive Groups) | 68 (Unhealthy) | 53 (Unhealthy for Sensitive Groups) | 37 (Unhealthy for Sensitive Groups) | 34 (Moderate) |
| co | 470 (Good) | 587 (Good) | 616 (Good) | 498 (Good) | 772 (Good) | 923 (Good) | 710 (Good) | 626 (Good) | 600 (Good) | 420 (Good) | 374 (Good) | 631 (Good) | 584 (Good) | 738 (Good) | 688 (Good) | 775 (Good) | 1 (Good) | 845 (Good) | 893 (Good) | 804 (Good) |
| no2 | 28 (Good) | 48 (Moderate) | 30 (Good) | 22 (Good) | 37 (Good) | 63 (Moderate) | 55 (Moderate) | 44 (Moderate) | 31 (Good) | 24 (Good) | 24 (Good) | 29 (Good) | 35 (Good) | 37 (Good) | 44 (Moderate) | 33 (Good) | 46 (Moderate) | 36 (Good) | 43 (Moderate) | 45 (Moderate) |
| o3 | 139 (Unhealthy for Sensitive Groups) | 139 (Unhealthy for Sensitive Groups) | 88 (Moderate) | 88 (Moderate) | 57 (Good) | 62 (Good) | 106 (Moderate) | 121 (Unhealthy for Sensitive Groups) | 156 (Unhealthy) | 146 (Unhealthy for Sensitive Groups) | 129 (Unhealthy for Sensitive Groups) | 137 (Unhealthy for Sensitive Groups) | 130 (Unhealthy for Sensitive Groups) | 97 (Moderate) | 83 (Moderate) | 51 (Good) | 55 (Good) | 53 (Good) | 75 (Moderate) | 106 (Moderate) |
| pm10 | 54 (Unhealthy for Sensitive Groups) | 76 (Unhealthy for Sensitive Groups) | 50 (Unhealthy for Sensitive Groups) | 38 (Moderate) | 57 (Unhealthy for Sensitive Groups) | 100 (Unhealthy) | 105 (Unhealthy) | 90 (Unhealthy) | 66 (Unhealthy for Sensitive Groups) | 46 (Moderate) | 32 (Moderate) | 41 (Moderate) | 79 (Unhealthy for Sensitive Groups) | 60 (Unhealthy for Sensitive Groups) | 74 (Unhealthy for Sensitive Groups) | 54 (Unhealthy for Sensitive Groups) | 104 (Unhealthy) | 80 (Unhealthy for Sensitive Groups) | 61 (Unhealthy for Sensitive Groups) | 69 (Unhealthy for Sensitive Groups) |
| so2 | 11 (Good) | 13 (Good) | 9.4 (Good) | 6.4 (Good) | 6.2 (Good) | 13 (Good) | 14 (Good) | 12 (Good) | 11 (Good) | 7.8 (Good) | 10 (Good) | 11 (Good) | 8.2 (Good) | 5.8 (Good) | 7.1 (Good) | 3.9 (Good) | 11 (Good) | 6.4 (Good) | 6.1 (Good) | 9.7 (Good) |
PM10 179 (Very bad Hazardous)
particulate matter (PM10) suspended dustPM2,5 35 (Unhealthy for Sensitive Groups)
particulate matter (PM2.5) dustO3 0.04 (Good)
ozone (O3)NO2 0 (Good)
nitrogen dioxide (NO2)SO2 0 (Good)
sulfur dioxide (SO2)省外办
| index | 2022-05-27 |
|---|---|
| pm10 | 56 |
| pm25 | 56 |
| o3 | 0.03 |
| no2 | 0 |
| so2 | 0 |
省外办

| index | 2020-05 | 2020-04 | 2020-03 | 2020-02 | 2020-01 | 2019-12 | 2019-11 | 2019-10 | 2019-09 | 2019-08 | 2019-07 | 2019-06 | 2019-05 | 2019-04 | 2019-03 | 2019-02 | 2019-01 | 2018-12 | 2018-11 | 2018-10 |
|---|---|---|---|---|---|---|---|---|---|---|---|---|---|---|---|---|---|---|---|---|
| pm25 | 29 | 41 | 33 | 35 | 51 | 69 | 48 | 48 | 39 | 32 | 22 | 24 | 33 | 30 | 45 | 43 | 68 | 53 | 37 | 34 |
| co | 470 | 587 | 616 | 498 | 772 | 923 | 710 | 626 | 600 | 420 | 374 | 631 | 584 | 738 | 688 | 775 | 1 | 845 | 893 | 804 |
| no2 | 28 | 48 | 30 | 22 | 37 | 63 | 55 | 44 | 31 | 24 | 24 | 29 | 35 | 37 | 44 | 33 | 46 | 36 | 43 | 45 |
| o3 | 139 | 139 | 88 | 88 | 57 | 62 | 106 | 121 | 156 | 146 | 129 | 137 | 130 | 97 | 83 | 51 | 55 | 53 | 75 | 106 |
| pm10 | 54 | 76 | 50 | 38 | 57 | 100 | 105 | 90 | 66 | 46 | 32 | 41 | 79 | 60 | 74 | 54 | 104 | 80 | 61 | 69 |
| so2 | 11 | 13 | 9.4 | 6.4 | 6.2 | 13 | 14 | 12 | 11 | 7.8 | 10 | 11 | 8.2 | 5.8 | 7.1 | 3.9 | 11 | 6.4 | 6.1 | 9.7 |