Air Pollution in Waipeng: Real-time Air Quality Index and smog alert.
Pollution and air quality forecast for Waipeng. Today is Tuesday, June 2, 2026. The following air pollution values have been recorded for Waipeng:- particulate matter (PM10) suspended dust - 179 (Very bad Hazardous)
- particulate matter (PM2.5) dust - 35 (Unhealthy for Sensitive Groups)
- ozone (O3) - 0 (Good)
- nitrogen dioxide (NO2) - 0 (Good)
- sulfur dioxide (SO2) - 0 (Good)

What is the air quality in Waipeng today? Is the air polluted in Waipeng?. Is there smog?
What is the level of PM10 today in Waipeng? (particulate matter (PM10) suspended dust)
The current level of particulate matter PM10 in Waipeng is:
179 (Very bad Hazardous)
The highest PM10 values usually occur in month: 105 (November 2019).
The lowest value of particulate matter PM10 pollution in Waipeng is usually recorded in: February (37).
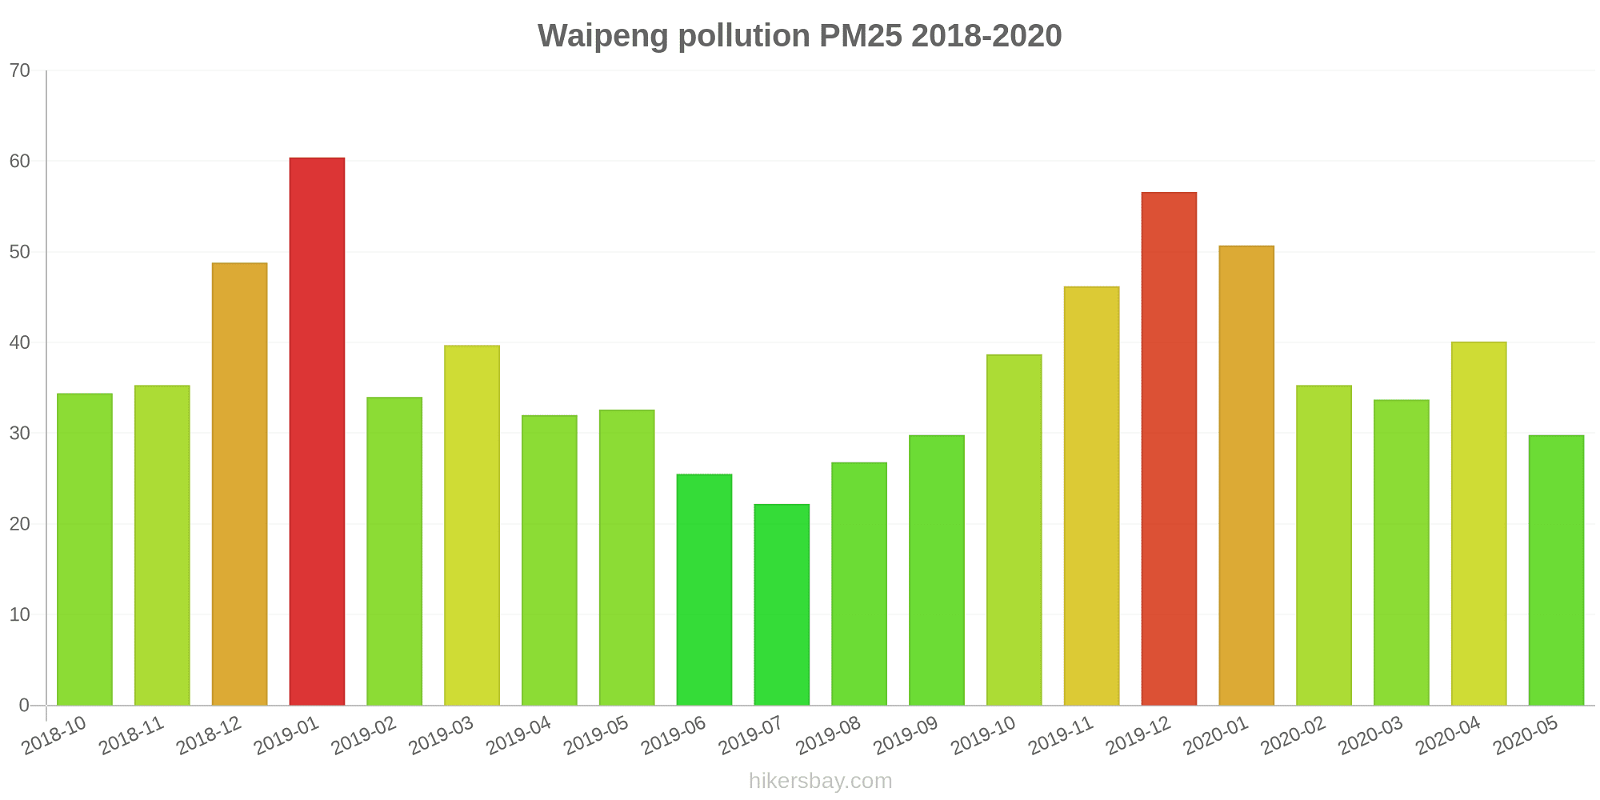
What is the current level of PM2.5 in Waipeng? (particulate matter (PM2.5) dust)
Today's PM2.5 level is:
35 (Unhealthy for Sensitive Groups)
For comparison, the highest level of PM2.5 in Waipeng in the last 7 days was: 56 (Friday, May 27, 2022) and the lowest: 56 (Friday, May 27, 2022).
The highest PM2.5 values were recorded: 60 (January 2019).
The lowest level of particulate matter PM2.5 pollution occurs in month: July (22).
How is the O3 level today in Waipeng? (ozone (O3))
0 (Good)
How high is the level of NO2? (nitrogen dioxide (NO2))
0 (Good)
What is the level of SO2 pollution? (sulfur dioxide (SO2))
0 (Good)
Current data Friday, May 27, 2022, 12:00 PM
PM10 179 (Very bad Hazardous)
PM2,5 35 (Unhealthy for Sensitive Groups)
O3 0 (Good)
NO2 0 (Good)
SO2 0 (Good)
Data on air pollution from recent days in Waipeng
index
2022-05-27
pm10
56
Unhealthy for Sensitive Groups
pm25
56
Unhealthy
o3
0
Good
no2
0
Good
so2
0
Good
data source »
Air pollution in Waipeng from October 2018 to May 2020
index
2020-05
2020-04
2020-03
2020-02
2020-01
2019-12
2019-11
2019-10
2019-09
2019-08
2019-07
2019-06
2019-05
2019-04
2019-03
2019-02
2019-01
2018-12
2018-11
2018-10
pm25
30 (Moderate)
40 (Unhealthy for Sensitive Groups)
34 (Moderate)
35 (Unhealthy for Sensitive Groups)
51 (Unhealthy for Sensitive Groups)
57 (Unhealthy)
46 (Unhealthy for Sensitive Groups)
39 (Unhealthy for Sensitive Groups)
30 (Moderate)
27 (Moderate)
22 (Moderate)
26 (Moderate)
33 (Moderate)
32 (Moderate)
40 (Unhealthy for Sensitive Groups)
34 (Moderate)
60 (Unhealthy)
49 (Unhealthy for Sensitive Groups)
35 (Unhealthy for Sensitive Groups)
34 (Moderate)
co
634 (Good)
627 (Good)
636 (Good)
705 (Good)
948 (Good)
1 (Good)
771 (Good)
744 (Good)
656 (Good)
365 (Good)
256 (Good)
352 (Good)
367 (Good)
511 (Good)
518 (Good)
673 (Good)
849 (Good)
1 (Good)
1 (Good)
975 (Good)
no2
21 (Good)
45 (Moderate)
31 (Good)
21 (Good)
35 (Good)
61 (Moderate)
54 (Moderate)
41 (Moderate)
31 (Good)
26 (Good)
24 (Good)
29 (Good)
38 (Good)
40 (Moderate)
45 (Moderate)
25 (Good)
48 (Moderate)
40 (Moderate)
46 (Moderate)
49 (Moderate)
o3
155 (Unhealthy)
151 (Unhealthy)
100 (Moderate)
94 (Moderate)
64 (Good)
71 (Moderate)
110 (Moderate)
121 (Unhealthy for Sensitive Groups)
148 (Unhealthy for Sensitive Groups)
137 (Unhealthy for Sensitive Groups)
114 (Moderate)
122 (Unhealthy for Sensitive Groups)
130 (Unhealthy for Sensitive Groups)
106 (Moderate)
94 (Moderate)
53 (Good)
61 (Good)
44 (Good)
65 (Good)
90 (Moderate)
pm10
54 (Unhealthy for Sensitive Groups)
76 (Unhealthy for Sensitive Groups)
53 (Unhealthy for Sensitive Groups)
37 (Moderate)
55 (Unhealthy for Sensitive Groups)
99 (Unhealthy)
105 (Unhealthy)
93 (Unhealthy)
69 (Unhealthy for Sensitive Groups)
57 (Unhealthy for Sensitive Groups)
40 (Moderate)
53 (Unhealthy for Sensitive Groups)
92 (Unhealthy)
64 (Unhealthy for Sensitive Groups)
82 (Unhealthy)
46 (Moderate)
105 (Unhealthy)
81 (Unhealthy)
73 (Unhealthy for Sensitive Groups)
89 (Unhealthy)
so2
11 (Good)
12 (Good)
8.7 (Good)
6.3 (Good)
5.7 (Good)
12 (Good)
13 (Good)
11 (Good)
9.7 (Good)
8.8 (Good)
11 (Good)
11 (Good)
12 (Good)
12 (Good)
12 (Good)
5.6 (Good)
12 (Good)
11 (Good)
11 (Good)
15 (Good)
data source »
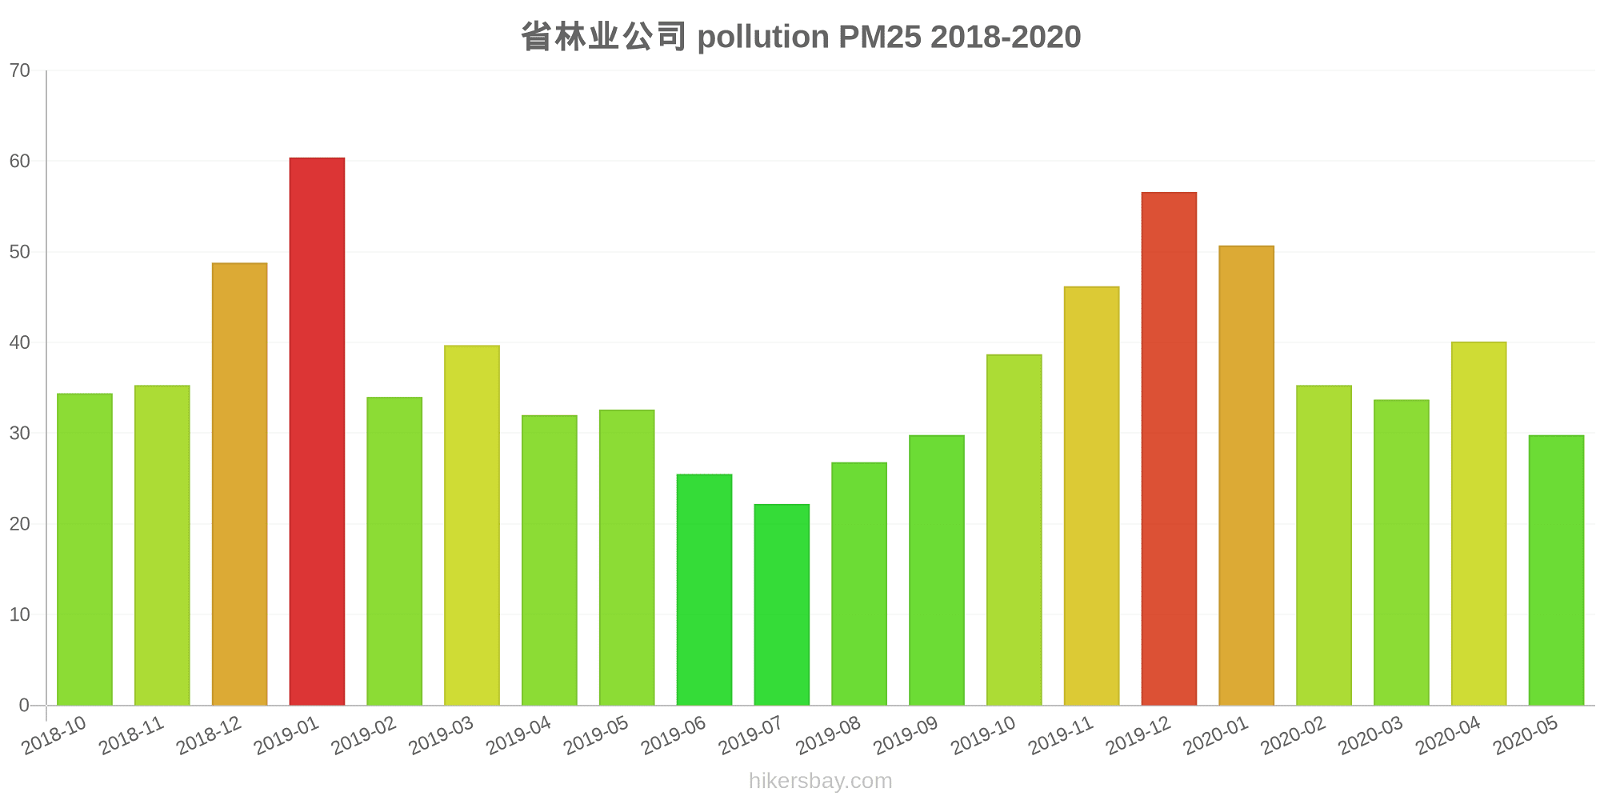
省林业公司
Friday, May 27, 2022, 12:00 PM
PM10 179 (Very bad Hazardous)
particulate matter (PM10) suspended dust
PM2,5 35 (Unhealthy for Sensitive Groups)
particulate matter (PM2.5) dust
O3 0.04 (Good)
ozone (O3)
NO2 0 (Good)
nitrogen dioxide (NO2)
SO2 0 (Good)
sulfur dioxide (SO2)
省林业公司
index
2022-05-27
pm10
56
pm25
56
o3
0.03
no2
0
so2
0
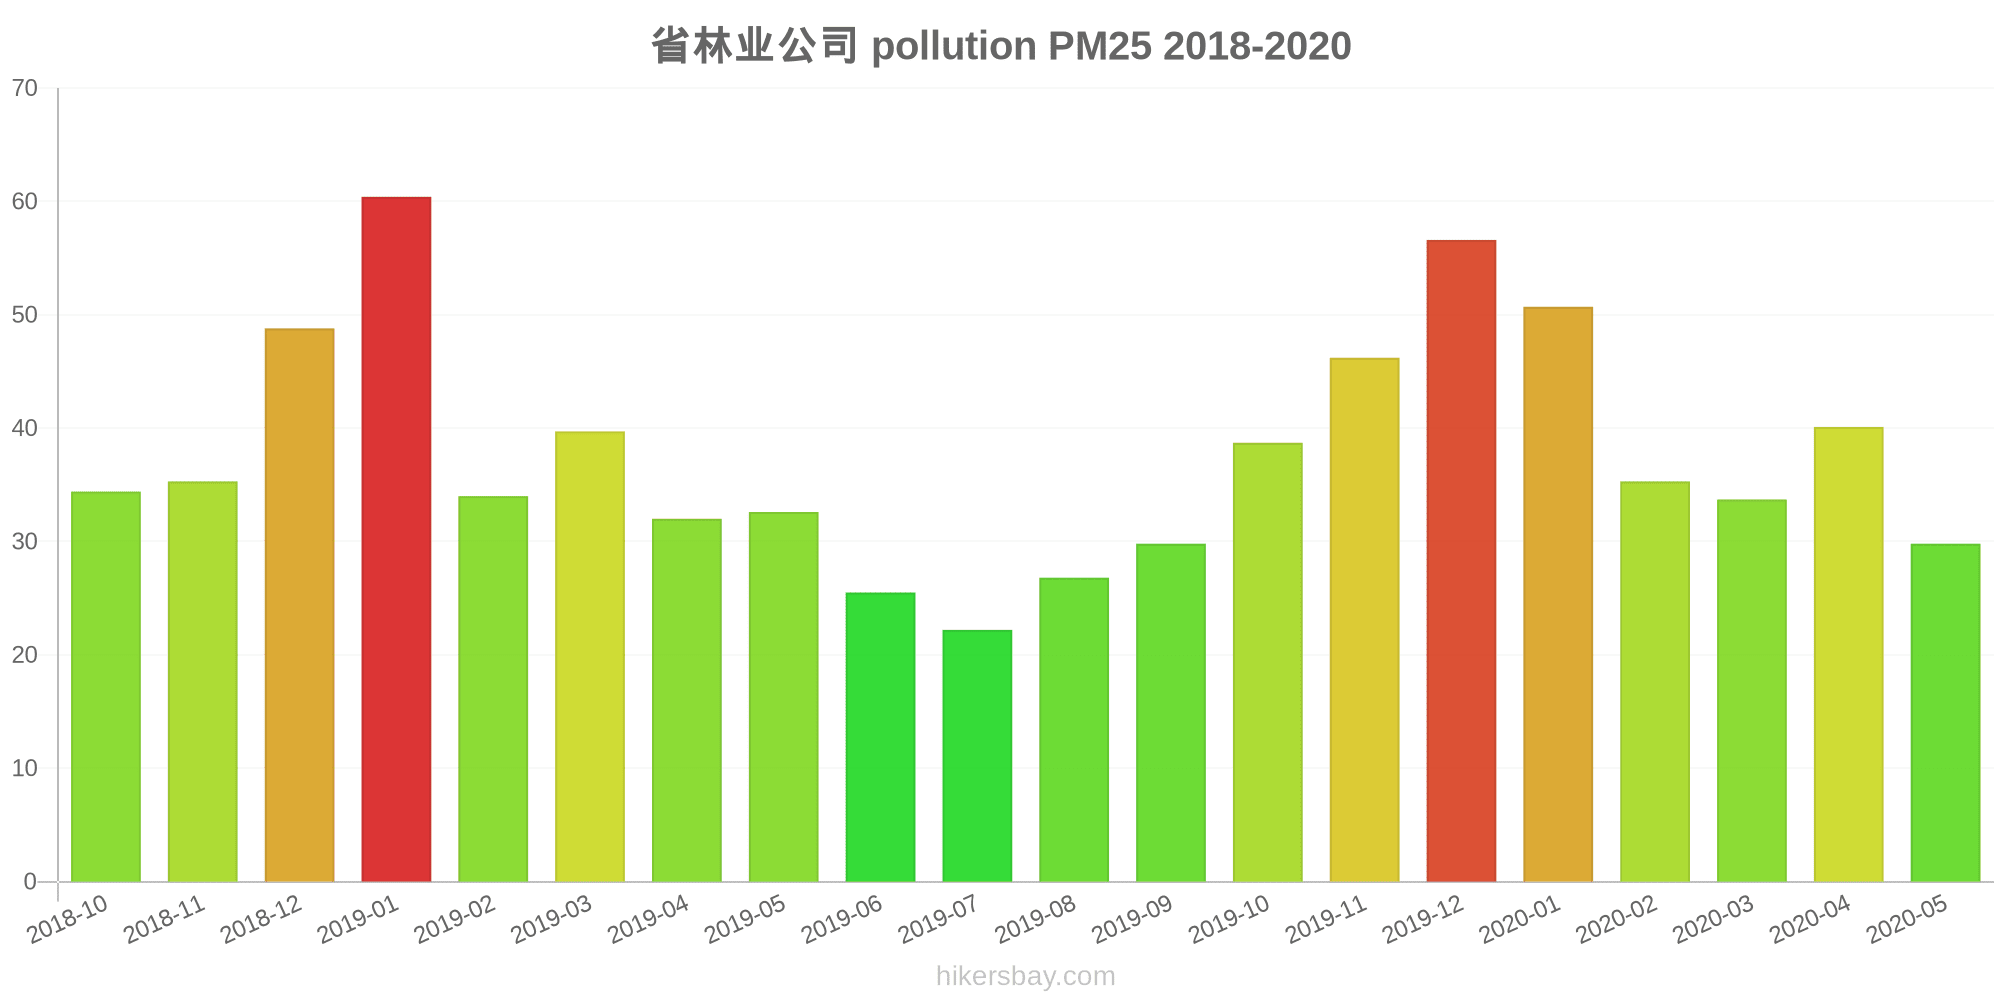
省林业公司
2018-10 2020-05
index
2020-05
2020-04
2020-03
2020-02
2020-01
2019-12
2019-11
2019-10
2019-09
2019-08
2019-07
2019-06
2019-05
2019-04
2019-03
2019-02
2019-01
2018-12
2018-11
2018-10
pm25
30
40
34
35
51
57
46
39
30
27
22
26
33
32
40
34
60
49
35
34
co
634
627
636
705
948
1
771
744
656
365
256
352
367
511
518
673
849
1
1
975
no2
21
45
31
21
35
61
54
41
31
26
24
29
38
40
45
25
48
40
46
49
o3
155
151
100
94
64
71
110
121
148
137
114
122
130
106
94
53
61
44
65
90
pm10
54
76
53
37
55
99
105
93
69
57
40
53
92
64
82
46
105
81
73
89
so2
11
12
8.7
6.3
5.7
12
13
11
9.7
8.8
11
11
12
12
12
5.6
12
11
11
15
* Pollution data source:
https://openaq.org
(ChinaAQIData)
The data is licensed under CC-By 4.0
PM10 179 (Very bad Hazardous)
PM2,5 35 (Unhealthy for Sensitive Groups)
O3 0 (Good)
NO2 0 (Good)
SO2 0 (Good)
Data on air pollution from recent days in Waipeng
| index | 2022-05-27 |
|---|---|
| pm10 | 56 Unhealthy for Sensitive Groups |
| pm25 | 56 Unhealthy |
| o3 | 0 Good |
| no2 | 0 Good |
| so2 | 0 Good |

| index | 2020-05 | 2020-04 | 2020-03 | 2020-02 | 2020-01 | 2019-12 | 2019-11 | 2019-10 | 2019-09 | 2019-08 | 2019-07 | 2019-06 | 2019-05 | 2019-04 | 2019-03 | 2019-02 | 2019-01 | 2018-12 | 2018-11 | 2018-10 |
|---|---|---|---|---|---|---|---|---|---|---|---|---|---|---|---|---|---|---|---|---|
| pm25 | 30 (Moderate) | 40 (Unhealthy for Sensitive Groups) | 34 (Moderate) | 35 (Unhealthy for Sensitive Groups) | 51 (Unhealthy for Sensitive Groups) | 57 (Unhealthy) | 46 (Unhealthy for Sensitive Groups) | 39 (Unhealthy for Sensitive Groups) | 30 (Moderate) | 27 (Moderate) | 22 (Moderate) | 26 (Moderate) | 33 (Moderate) | 32 (Moderate) | 40 (Unhealthy for Sensitive Groups) | 34 (Moderate) | 60 (Unhealthy) | 49 (Unhealthy for Sensitive Groups) | 35 (Unhealthy for Sensitive Groups) | 34 (Moderate) |
| co | 634 (Good) | 627 (Good) | 636 (Good) | 705 (Good) | 948 (Good) | 1 (Good) | 771 (Good) | 744 (Good) | 656 (Good) | 365 (Good) | 256 (Good) | 352 (Good) | 367 (Good) | 511 (Good) | 518 (Good) | 673 (Good) | 849 (Good) | 1 (Good) | 1 (Good) | 975 (Good) |
| no2 | 21 (Good) | 45 (Moderate) | 31 (Good) | 21 (Good) | 35 (Good) | 61 (Moderate) | 54 (Moderate) | 41 (Moderate) | 31 (Good) | 26 (Good) | 24 (Good) | 29 (Good) | 38 (Good) | 40 (Moderate) | 45 (Moderate) | 25 (Good) | 48 (Moderate) | 40 (Moderate) | 46 (Moderate) | 49 (Moderate) |
| o3 | 155 (Unhealthy) | 151 (Unhealthy) | 100 (Moderate) | 94 (Moderate) | 64 (Good) | 71 (Moderate) | 110 (Moderate) | 121 (Unhealthy for Sensitive Groups) | 148 (Unhealthy for Sensitive Groups) | 137 (Unhealthy for Sensitive Groups) | 114 (Moderate) | 122 (Unhealthy for Sensitive Groups) | 130 (Unhealthy for Sensitive Groups) | 106 (Moderate) | 94 (Moderate) | 53 (Good) | 61 (Good) | 44 (Good) | 65 (Good) | 90 (Moderate) |
| pm10 | 54 (Unhealthy for Sensitive Groups) | 76 (Unhealthy for Sensitive Groups) | 53 (Unhealthy for Sensitive Groups) | 37 (Moderate) | 55 (Unhealthy for Sensitive Groups) | 99 (Unhealthy) | 105 (Unhealthy) | 93 (Unhealthy) | 69 (Unhealthy for Sensitive Groups) | 57 (Unhealthy for Sensitive Groups) | 40 (Moderate) | 53 (Unhealthy for Sensitive Groups) | 92 (Unhealthy) | 64 (Unhealthy for Sensitive Groups) | 82 (Unhealthy) | 46 (Moderate) | 105 (Unhealthy) | 81 (Unhealthy) | 73 (Unhealthy for Sensitive Groups) | 89 (Unhealthy) |
| so2 | 11 (Good) | 12 (Good) | 8.7 (Good) | 6.3 (Good) | 5.7 (Good) | 12 (Good) | 13 (Good) | 11 (Good) | 9.7 (Good) | 8.8 (Good) | 11 (Good) | 11 (Good) | 12 (Good) | 12 (Good) | 12 (Good) | 5.6 (Good) | 12 (Good) | 11 (Good) | 11 (Good) | 15 (Good) |
PM10 179 (Very bad Hazardous)
particulate matter (PM10) suspended dustPM2,5 35 (Unhealthy for Sensitive Groups)
particulate matter (PM2.5) dustO3 0.04 (Good)
ozone (O3)NO2 0 (Good)
nitrogen dioxide (NO2)SO2 0 (Good)
sulfur dioxide (SO2)省林业公司
| index | 2022-05-27 |
|---|---|
| pm10 | 56 |
| pm25 | 56 |
| o3 | 0.03 |
| no2 | 0 |
| so2 | 0 |
省林业公司
| index | 2020-05 | 2020-04 | 2020-03 | 2020-02 | 2020-01 | 2019-12 | 2019-11 | 2019-10 | 2019-09 | 2019-08 | 2019-07 | 2019-06 | 2019-05 | 2019-04 | 2019-03 | 2019-02 | 2019-01 | 2018-12 | 2018-11 | 2018-10 |
|---|---|---|---|---|---|---|---|---|---|---|---|---|---|---|---|---|---|---|---|---|
| pm25 | 30 | 40 | 34 | 35 | 51 | 57 | 46 | 39 | 30 | 27 | 22 | 26 | 33 | 32 | 40 | 34 | 60 | 49 | 35 | 34 |
| co | 634 | 627 | 636 | 705 | 948 | 1 | 771 | 744 | 656 | 365 | 256 | 352 | 367 | 511 | 518 | 673 | 849 | 1 | 1 | 975 |
| no2 | 21 | 45 | 31 | 21 | 35 | 61 | 54 | 41 | 31 | 26 | 24 | 29 | 38 | 40 | 45 | 25 | 48 | 40 | 46 | 49 |
| o3 | 155 | 151 | 100 | 94 | 64 | 71 | 110 | 121 | 148 | 137 | 114 | 122 | 130 | 106 | 94 | 53 | 61 | 44 | 65 | 90 |
| pm10 | 54 | 76 | 53 | 37 | 55 | 99 | 105 | 93 | 69 | 57 | 40 | 53 | 92 | 64 | 82 | 46 | 105 | 81 | 73 | 89 |
| so2 | 11 | 12 | 8.7 | 6.3 | 5.7 | 12 | 13 | 11 | 9.7 | 8.8 | 11 | 11 | 12 | 12 | 12 | 5.6 | 12 | 11 | 11 | 15 |