Air Pollution in Longwangmiao: Real-time Air Quality Index and smog alert.
Pollution and air quality forecast for Longwangmiao. Today is Tuesday, June 16, 2026. The following air pollution values have been recorded for Longwangmiao:- particulate matter (PM10) suspended dust - 7 (Good)
- particulate matter (PM2.5) dust - 2 (Good)
- carbon monoxide (CO) - 100 (Good)
- nitrogen dioxide (NO2) - 8 (Good)
- ozone (O3) - 0 (Good)
- sulfur dioxide (SO2) - 9 (Good)

What is the air quality in Longwangmiao today? Is the air polluted in Longwangmiao?. Is there smog?
What is the level of PM10 today in Longwangmiao? (particulate matter (PM10) suspended dust)
The current level of particulate matter PM10 in Longwangmiao is:
7 (Good)
The highest PM10 values usually occur in month: 127 (January 2019).
The lowest value of particulate matter PM10 pollution in Longwangmiao is usually recorded in: July (40).
What is the current level of PM2.5 in Longwangmiao? (particulate matter (PM2.5) dust)
Today's PM2.5 level is:
2 (Good)
For comparison, the highest level of PM2.5 in Longwangmiao in the last 7 days was: 24 (Friday, May 27, 2022) and the lowest: 24 (Friday, May 27, 2022).
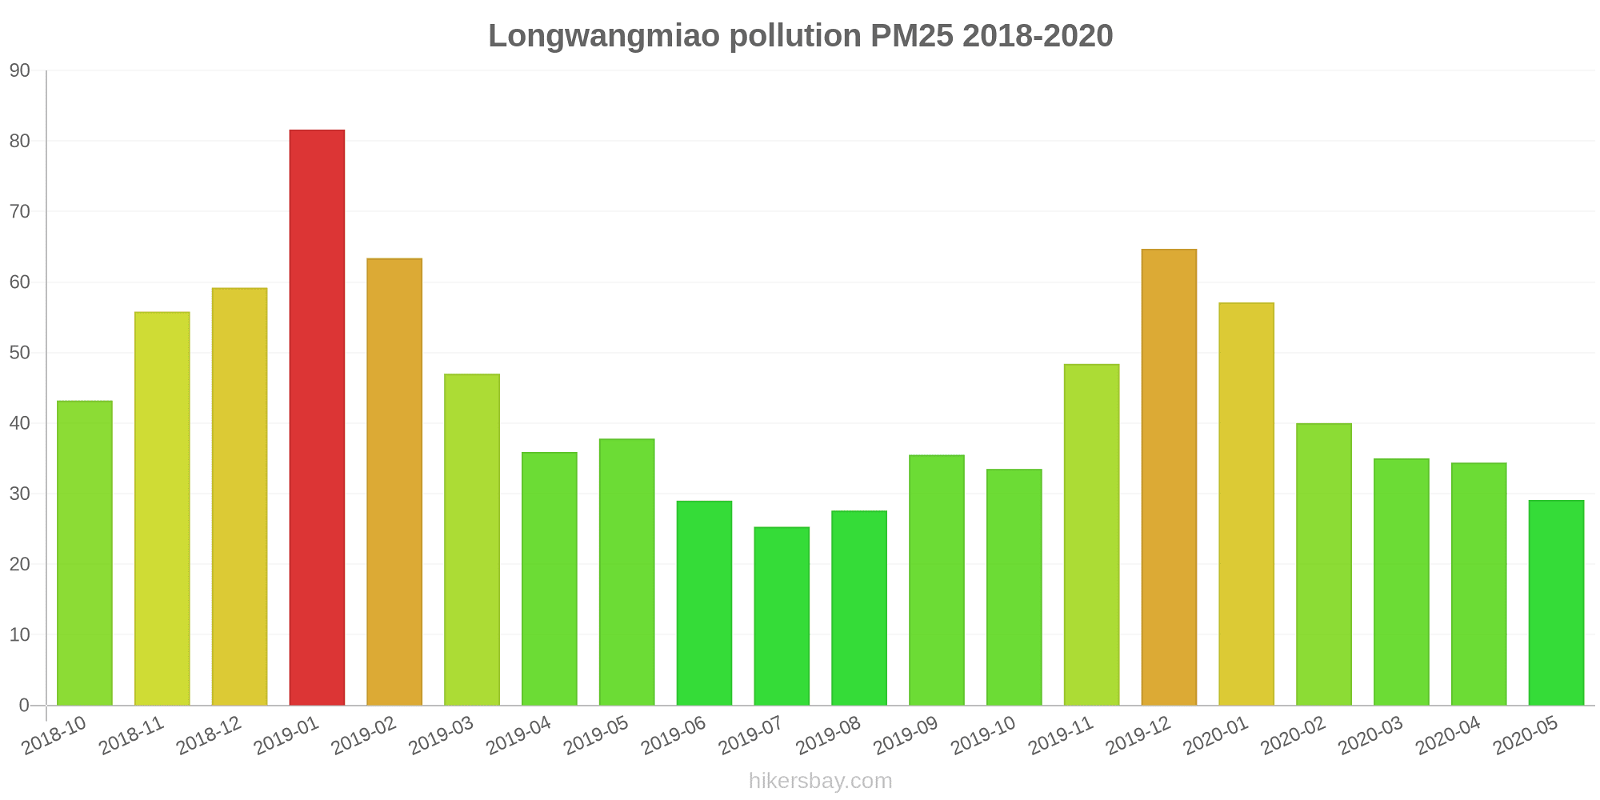
The highest PM2.5 values were recorded: 82 (January 2019).
The lowest level of particulate matter PM2.5 pollution occurs in month: July (25).
How high is the CO level? (carbon monoxide (CO))
100 (Good)
How high is the level of NO2? (nitrogen dioxide (NO2))
8 (Good)
How is the O3 level today in Longwangmiao? (ozone (O3))
0 (Good)
What is the level of SO2 pollution? (sulfur dioxide (SO2))
9 (Good)
Current data Friday, May 27, 2022, 12:00 PM
PM10 7 (Good)
PM2,5 2 (Good)
CO 100 (Good)
NO2 8 (Good)
O3 0 (Good)
SO2 9 (Good)
Data on air pollution from recent days in Longwangmiao
index
2022-05-27
pm10
32
Moderate
pm25
24
Moderate
co
468
Good
no2
21
Good
o3
32
Good
so2
5
Good
data source »
Air pollution in Longwangmiao from October 2018 to May 2020
index
2020-05
2020-04
2020-03
2020-02
2020-01
2019-12
2019-11
2019-10
2019-09
2019-08
2019-07
2019-06
2019-05
2019-04
2019-03
2019-02
2019-01
2018-12
2018-11
2018-10
pm25
29 (Moderate)
34 (Moderate)
35 (Unhealthy for Sensitive Groups)
40 (Unhealthy for Sensitive Groups)
57 (Unhealthy)
65 (Unhealthy)
48 (Unhealthy for Sensitive Groups)
34 (Moderate)
36 (Unhealthy for Sensitive Groups)
28 (Moderate)
25 (Moderate)
29 (Moderate)
38 (Unhealthy for Sensitive Groups)
36 (Unhealthy for Sensitive Groups)
47 (Unhealthy for Sensitive Groups)
63 (Unhealthy)
82 (Very Unhealthy)
59 (Unhealthy)
56 (Unhealthy)
43 (Unhealthy for Sensitive Groups)
co
910 (Good)
814 (Good)
1 (Good)
1 (Good)
1 (Good)
1 (Good)
1 (Good)
966 (Good)
963 (Good)
662 (Good)
448 (Good)
536 (Good)
627 (Good)
968 (Good)
1 (Good)
1 (Good)
1 (Good)
1 (Good)
1 (Good)
997 (Good)
no2
12 (Good)
17 (Good)
11 (Good)
10 (Good)
23 (Good)
43 (Moderate)
36 (Good)
22 (Good)
17 (Good)
8 (Good)
8.7 (Good)
13 (Good)
19 (Good)
19 (Good)
26 (Good)
17 (Good)
29 (Good)
29 (Good)
29 (Good)
28 (Good)
o3
127 (Unhealthy for Sensitive Groups)
140 (Unhealthy for Sensitive Groups)
108 (Moderate)
89 (Moderate)
68 (Good)
68 (Good)
99 (Moderate)
126 (Unhealthy for Sensitive Groups)
178 (Unhealthy)
158 (Unhealthy)
139 (Unhealthy for Sensitive Groups)
176 (Unhealthy)
133 (Unhealthy for Sensitive Groups)
110 (Moderate)
108 (Moderate)
65 (Good)
57 (Good)
55 (Good)
105 (Moderate)
132 (Unhealthy for Sensitive Groups)
pm10
52 (Unhealthy for Sensitive Groups)
63 (Unhealthy for Sensitive Groups)
59 (Unhealthy for Sensitive Groups)
50 (Unhealthy for Sensitive Groups)
75 (Unhealthy for Sensitive Groups)
114 (Very Unhealthy)
100 (Unhealthy)
67 (Unhealthy for Sensitive Groups)
64 (Unhealthy for Sensitive Groups)
43 (Moderate)
40 (Moderate)
47 (Moderate)
82 (Unhealthy)
64 (Unhealthy for Sensitive Groups)
95 (Unhealthy)
95 (Unhealthy)
127 (Very Unhealthy)
105 (Unhealthy)
99 (Unhealthy)
78 (Unhealthy for Sensitive Groups)
so2
8.2 (Good)
6.5 (Good)
5.6 (Good)
7.3 (Good)
5.1 (Good)
7.5 (Good)
6.8 (Good)
5.5 (Good)
5.2 (Good)
5 (Good)
4.9 (Good)
5.4 (Good)
5.5 (Good)
5.3 (Good)
6.7 (Good)
8.2 (Good)
9.5 (Good)
12 (Good)
10 (Good)
9.2 (Good)
data source »
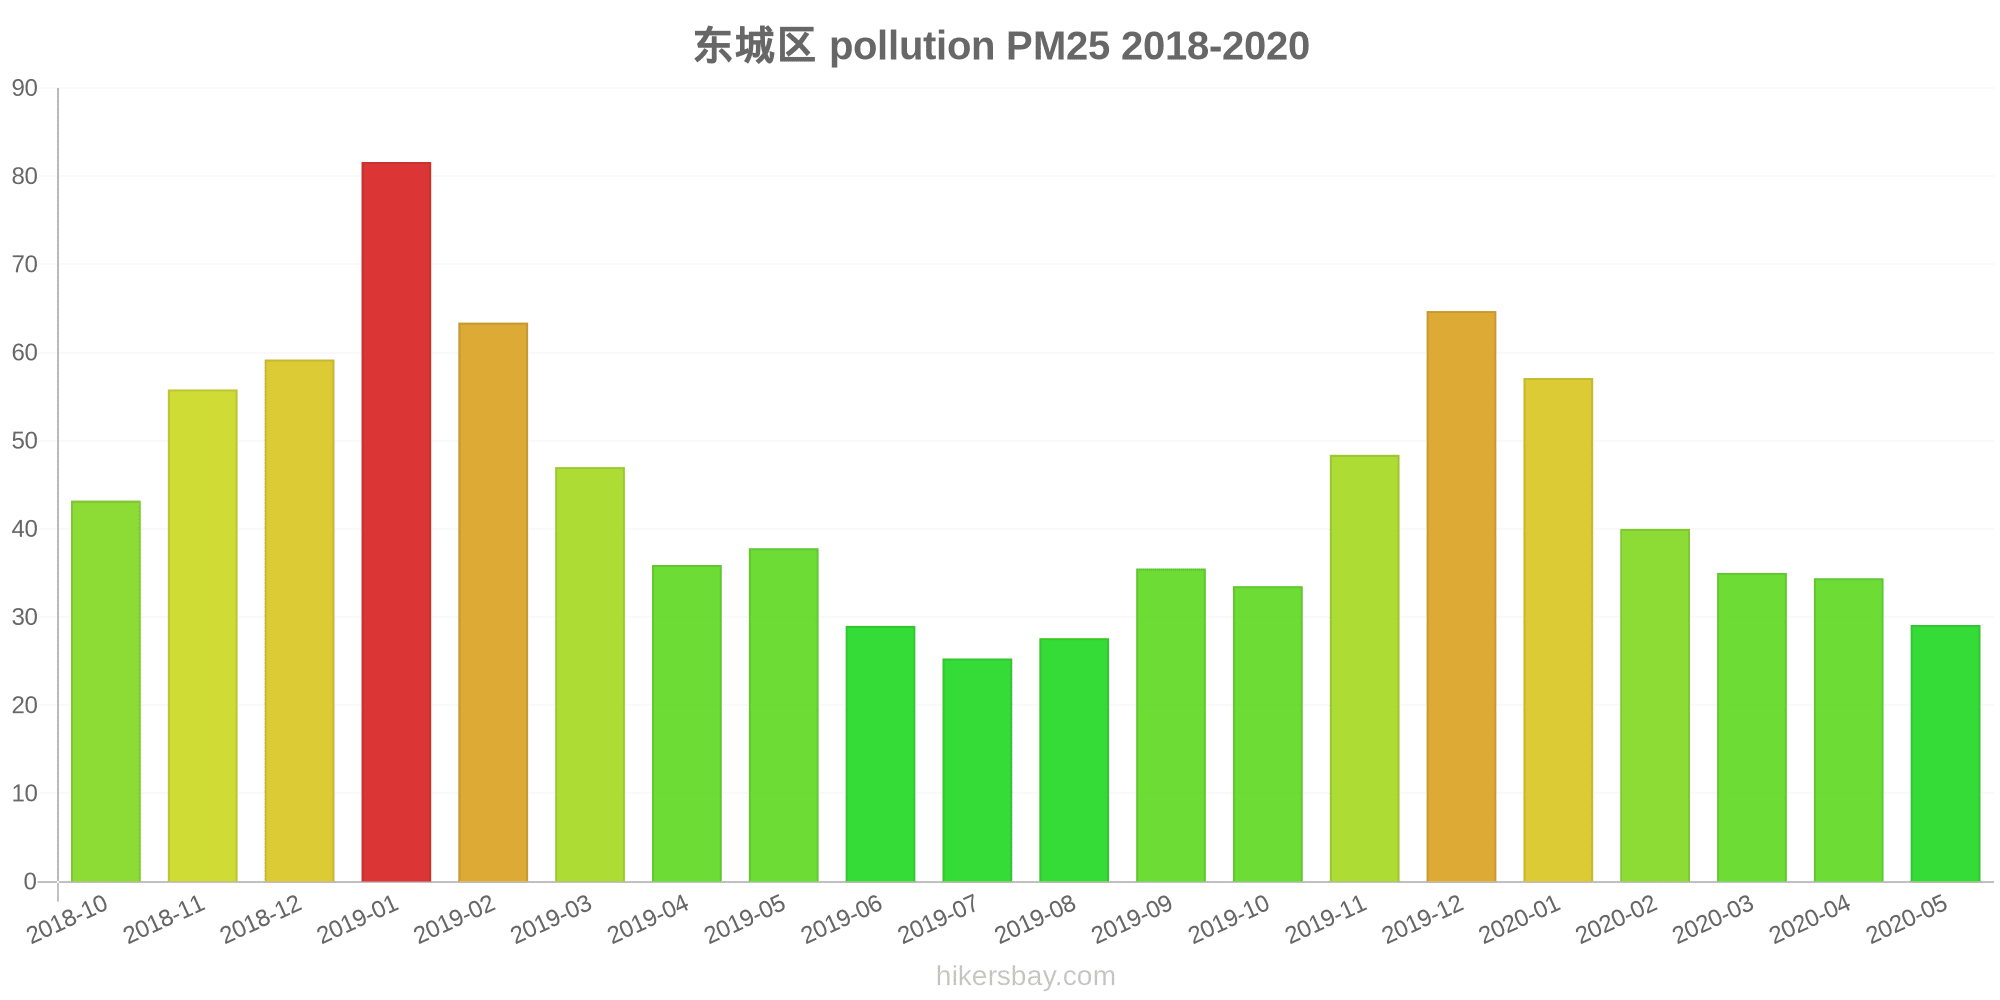
东城区
Friday, May 27, 2022, 12:00 PM
PM10 6.7 (Good)
particulate matter (PM10) suspended dust
PM2,5 1.7 (Good)
particulate matter (PM2.5) dust
CO 100 (Good)
carbon monoxide (CO)
NO2 7.6 (Good)
nitrogen dioxide (NO2)
O3 0.02 (Good)
ozone (O3)
SO2 8.6 (Good)
sulfur dioxide (SO2)
东城区
index
2022-05-27
pm10
32
pm25
24
co
468
no2
21
o3
32
so2
4.6
东城区
2018-10 2020-05

index
2020-05
2020-04
2020-03
2020-02
2020-01
2019-12
2019-11
2019-10
2019-09
2019-08
2019-07
2019-06
2019-05
2019-04
2019-03
2019-02
2019-01
2018-12
2018-11
2018-10
pm25
29
34
35
40
57
65
48
34
36
28
25
29
38
36
47
63
82
59
56
43
co
910
814
1
1
1
1
1
966
963
662
448
536
627
968
1
1
1
1
1
997
no2
12
17
11
10
23
43
36
22
17
8
8.7
13
19
19
26
17
29
29
29
28
o3
127
140
108
89
68
68
99
126
178
158
139
176
133
110
108
65
57
55
105
132
pm10
52
63
59
50
75
114
100
67
64
43
40
47
82
64
95
95
127
105
99
78
so2
8.2
6.5
5.6
7.3
5.1
7.5
6.8
5.5
5.2
5
4.9
5.4
5.5
5.3
6.7
8.2
9.5
12
10
9.2
* Pollution data source:
https://openaq.org
(ChinaAQIData)
The data is licensed under CC-By 4.0
PM10 7 (Good)
PM2,5 2 (Good)
CO 100 (Good)
NO2 8 (Good)
O3 0 (Good)
SO2 9 (Good)
Data on air pollution from recent days in Longwangmiao
| index | 2022-05-27 |
|---|---|
| pm10 | 32 Moderate |
| pm25 | 24 Moderate |
| co | 468 Good |
| no2 | 21 Good |
| o3 | 32 Good |
| so2 | 5 Good |

| index | 2020-05 | 2020-04 | 2020-03 | 2020-02 | 2020-01 | 2019-12 | 2019-11 | 2019-10 | 2019-09 | 2019-08 | 2019-07 | 2019-06 | 2019-05 | 2019-04 | 2019-03 | 2019-02 | 2019-01 | 2018-12 | 2018-11 | 2018-10 |
|---|---|---|---|---|---|---|---|---|---|---|---|---|---|---|---|---|---|---|---|---|
| pm25 | 29 (Moderate) | 34 (Moderate) | 35 (Unhealthy for Sensitive Groups) | 40 (Unhealthy for Sensitive Groups) | 57 (Unhealthy) | 65 (Unhealthy) | 48 (Unhealthy for Sensitive Groups) | 34 (Moderate) | 36 (Unhealthy for Sensitive Groups) | 28 (Moderate) | 25 (Moderate) | 29 (Moderate) | 38 (Unhealthy for Sensitive Groups) | 36 (Unhealthy for Sensitive Groups) | 47 (Unhealthy for Sensitive Groups) | 63 (Unhealthy) | 82 (Very Unhealthy) | 59 (Unhealthy) | 56 (Unhealthy) | 43 (Unhealthy for Sensitive Groups) |
| co | 910 (Good) | 814 (Good) | 1 (Good) | 1 (Good) | 1 (Good) | 1 (Good) | 1 (Good) | 966 (Good) | 963 (Good) | 662 (Good) | 448 (Good) | 536 (Good) | 627 (Good) | 968 (Good) | 1 (Good) | 1 (Good) | 1 (Good) | 1 (Good) | 1 (Good) | 997 (Good) |
| no2 | 12 (Good) | 17 (Good) | 11 (Good) | 10 (Good) | 23 (Good) | 43 (Moderate) | 36 (Good) | 22 (Good) | 17 (Good) | 8 (Good) | 8.7 (Good) | 13 (Good) | 19 (Good) | 19 (Good) | 26 (Good) | 17 (Good) | 29 (Good) | 29 (Good) | 29 (Good) | 28 (Good) |
| o3 | 127 (Unhealthy for Sensitive Groups) | 140 (Unhealthy for Sensitive Groups) | 108 (Moderate) | 89 (Moderate) | 68 (Good) | 68 (Good) | 99 (Moderate) | 126 (Unhealthy for Sensitive Groups) | 178 (Unhealthy) | 158 (Unhealthy) | 139 (Unhealthy for Sensitive Groups) | 176 (Unhealthy) | 133 (Unhealthy for Sensitive Groups) | 110 (Moderate) | 108 (Moderate) | 65 (Good) | 57 (Good) | 55 (Good) | 105 (Moderate) | 132 (Unhealthy for Sensitive Groups) |
| pm10 | 52 (Unhealthy for Sensitive Groups) | 63 (Unhealthy for Sensitive Groups) | 59 (Unhealthy for Sensitive Groups) | 50 (Unhealthy for Sensitive Groups) | 75 (Unhealthy for Sensitive Groups) | 114 (Very Unhealthy) | 100 (Unhealthy) | 67 (Unhealthy for Sensitive Groups) | 64 (Unhealthy for Sensitive Groups) | 43 (Moderate) | 40 (Moderate) | 47 (Moderate) | 82 (Unhealthy) | 64 (Unhealthy for Sensitive Groups) | 95 (Unhealthy) | 95 (Unhealthy) | 127 (Very Unhealthy) | 105 (Unhealthy) | 99 (Unhealthy) | 78 (Unhealthy for Sensitive Groups) |
| so2 | 8.2 (Good) | 6.5 (Good) | 5.6 (Good) | 7.3 (Good) | 5.1 (Good) | 7.5 (Good) | 6.8 (Good) | 5.5 (Good) | 5.2 (Good) | 5 (Good) | 4.9 (Good) | 5.4 (Good) | 5.5 (Good) | 5.3 (Good) | 6.7 (Good) | 8.2 (Good) | 9.5 (Good) | 12 (Good) | 10 (Good) | 9.2 (Good) |
PM10 6.7 (Good)
particulate matter (PM10) suspended dustPM2,5 1.7 (Good)
particulate matter (PM2.5) dustCO 100 (Good)
carbon monoxide (CO)NO2 7.6 (Good)
nitrogen dioxide (NO2)O3 0.02 (Good)
ozone (O3)SO2 8.6 (Good)
sulfur dioxide (SO2)东城区
| index | 2022-05-27 |
|---|---|
| pm10 | 32 |
| pm25 | 24 |
| co | 468 |
| no2 | 21 |
| o3 | 32 |
| so2 | 4.6 |
东城区
| index | 2020-05 | 2020-04 | 2020-03 | 2020-02 | 2020-01 | 2019-12 | 2019-11 | 2019-10 | 2019-09 | 2019-08 | 2019-07 | 2019-06 | 2019-05 | 2019-04 | 2019-03 | 2019-02 | 2019-01 | 2018-12 | 2018-11 | 2018-10 |
|---|---|---|---|---|---|---|---|---|---|---|---|---|---|---|---|---|---|---|---|---|
| pm25 | 29 | 34 | 35 | 40 | 57 | 65 | 48 | 34 | 36 | 28 | 25 | 29 | 38 | 36 | 47 | 63 | 82 | 59 | 56 | 43 |
| co | 910 | 814 | 1 | 1 | 1 | 1 | 1 | 966 | 963 | 662 | 448 | 536 | 627 | 968 | 1 | 1 | 1 | 1 | 1 | 997 |
| no2 | 12 | 17 | 11 | 10 | 23 | 43 | 36 | 22 | 17 | 8 | 8.7 | 13 | 19 | 19 | 26 | 17 | 29 | 29 | 29 | 28 |
| o3 | 127 | 140 | 108 | 89 | 68 | 68 | 99 | 126 | 178 | 158 | 139 | 176 | 133 | 110 | 108 | 65 | 57 | 55 | 105 | 132 |
| pm10 | 52 | 63 | 59 | 50 | 75 | 114 | 100 | 67 | 64 | 43 | 40 | 47 | 82 | 64 | 95 | 95 | 127 | 105 | 99 | 78 |
| so2 | 8.2 | 6.5 | 5.6 | 7.3 | 5.1 | 7.5 | 6.8 | 5.5 | 5.2 | 5 | 4.9 | 5.4 | 5.5 | 5.3 | 6.7 | 8.2 | 9.5 | 12 | 10 | 9.2 |