Air Pollution in Huancheng: Real-time Air Quality Index and smog alert.
Pollution and air quality forecast for Huancheng. Today is Wednesday, June 3, 2026. The following air pollution values have been recorded for Huancheng:- particulate matter (PM10) suspended dust - 179 (Very bad Hazardous)
- particulate matter (PM2.5) dust - 35 (Unhealthy for Sensitive Groups)
- ozone (O3) - 0 (Good)
- nitrogen dioxide (NO2) - 0 (Good)
- sulfur dioxide (SO2) - 0 (Good)

What is the air quality in Huancheng today? Is the air polluted in Huancheng?. Is there smog?
What is the level of PM10 today in Huancheng? (particulate matter (PM10) suspended dust)
The current level of particulate matter PM10 in Huancheng is:
179 (Very bad Hazardous)
The highest PM10 values usually occur in month: 207 (January 2019).
The lowest value of particulate matter PM10 pollution in Huancheng is usually recorded in: July (43).
What is the current level of PM2.5 in Huancheng? (particulate matter (PM2.5) dust)
Today's PM2.5 level is:
35 (Unhealthy for Sensitive Groups)
For comparison, the highest level of PM2.5 in Huancheng in the last 7 days was: 56 (Friday, May 27, 2022) and the lowest: 56 (Friday, May 27, 2022).
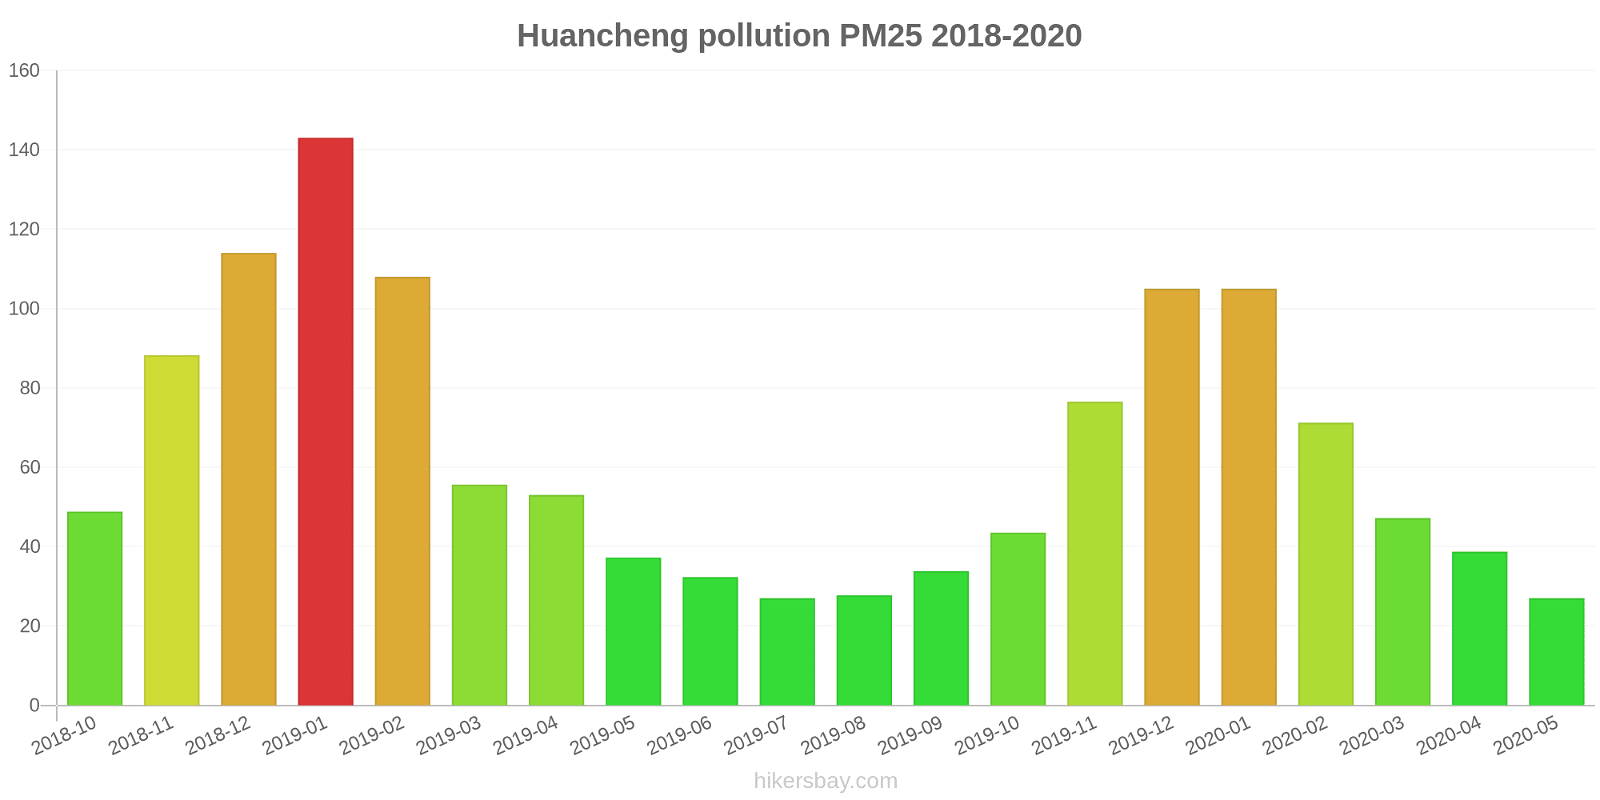
The highest PM2.5 values were recorded: 143 (January 2019).
The lowest level of particulate matter PM2.5 pollution occurs in month: May (27).
How is the O3 level today in Huancheng? (ozone (O3))
0 (Good)
How high is the level of NO2? (nitrogen dioxide (NO2))
0 (Good)
What is the level of SO2 pollution? (sulfur dioxide (SO2))
0 (Good)
Current data Friday, May 27, 2022, 12:00 PM
PM10 179 (Very bad Hazardous)
PM2,5 35 (Unhealthy for Sensitive Groups)
O3 0 (Good)
NO2 0 (Good)
SO2 0 (Good)
Data on air pollution from recent days in Huancheng
index
2022-05-27
pm10
56
Unhealthy for Sensitive Groups
pm25
56
Unhealthy
o3
0
Good
no2
0
Good
so2
0
Good
data source »
Air pollution in Huancheng from October 2018 to May 2020
index
2020-05
2020-04
2020-03
2020-02
2020-01
2019-12
2019-11
2019-10
2019-09
2019-08
2019-07
2019-06
2019-05
2019-04
2019-03
2019-02
2019-01
2018-12
2018-11
2018-10
pm25
27 (Moderate)
39 (Unhealthy for Sensitive Groups)
47 (Unhealthy for Sensitive Groups)
71 (Unhealthy)
105 (Very Unhealthy)
105 (Very Unhealthy)
77 (Very Unhealthy)
44 (Unhealthy for Sensitive Groups)
34 (Moderate)
28 (Moderate)
27 (Moderate)
32 (Moderate)
37 (Unhealthy for Sensitive Groups)
53 (Unhealthy for Sensitive Groups)
56 (Unhealthy)
108 (Very Unhealthy)
143 (Very bad Hazardous)
114 (Very bad Hazardous)
88 (Very Unhealthy)
49 (Unhealthy for Sensitive Groups)
co
785 (Good)
787 (Good)
836 (Good)
871 (Good)
1 (Good)
1 (Good)
968 (Good)
946 (Good)
712 (Good)
801 (Good)
853 (Good)
776 (Good)
763 (Good)
924 (Good)
886 (Good)
1 (Good)
1 (Good)
1 (Good)
1 (Good)
979 (Good)
no2
16 (Good)
26 (Good)
21 (Good)
15 (Good)
30 (Good)
40 (Good)
34 (Good)
33 (Good)
23 (Good)
18 (Good)
20 (Good)
23 (Good)
25 (Good)
27 (Good)
29 (Good)
31 (Good)
49 (Moderate)
50 (Moderate)
46 (Moderate)
45 (Moderate)
o3
131 (Unhealthy for Sensitive Groups)
135 (Unhealthy for Sensitive Groups)
114 (Moderate)
90 (Moderate)
77 (Moderate)
59 (Good)
92 (Moderate)
108 (Moderate)
169 (Unhealthy)
170 (Unhealthy)
170 (Unhealthy)
179 (Unhealthy)
160 (Unhealthy)
123 (Unhealthy for Sensitive Groups)
112 (Moderate)
74 (Moderate)
60 (Good)
54 (Good)
89 (Moderate)
119 (Moderate)
pm10
71 (Unhealthy for Sensitive Groups)
83 (Unhealthy)
88 (Unhealthy)
78 (Unhealthy for Sensitive Groups)
119 (Very Unhealthy)
133 (Very Unhealthy)
131 (Very Unhealthy)
96 (Unhealthy)
65 (Unhealthy for Sensitive Groups)
47 (Moderate)
43 (Moderate)
53 (Unhealthy for Sensitive Groups)
94 (Unhealthy)
96 (Unhealthy)
108 (Unhealthy)
150 (Very bad Hazardous)
207 (Very bad Hazardous)
181 (Very bad Hazardous)
149 (Very Unhealthy)
102 (Unhealthy)
so2
9 (Good)
8.8 (Good)
6.5 (Good)
8.1 (Good)
9.2 (Good)
10 (Good)
9 (Good)
9 (Good)
9.2 (Good)
7.5 (Good)
6.8 (Good)
6.9 (Good)
6.6 (Good)
3.9 (Good)
4.8 (Good)
7.7 (Good)
9.6 (Good)
12 (Good)
9.9 (Good)
11 (Good)
data source »
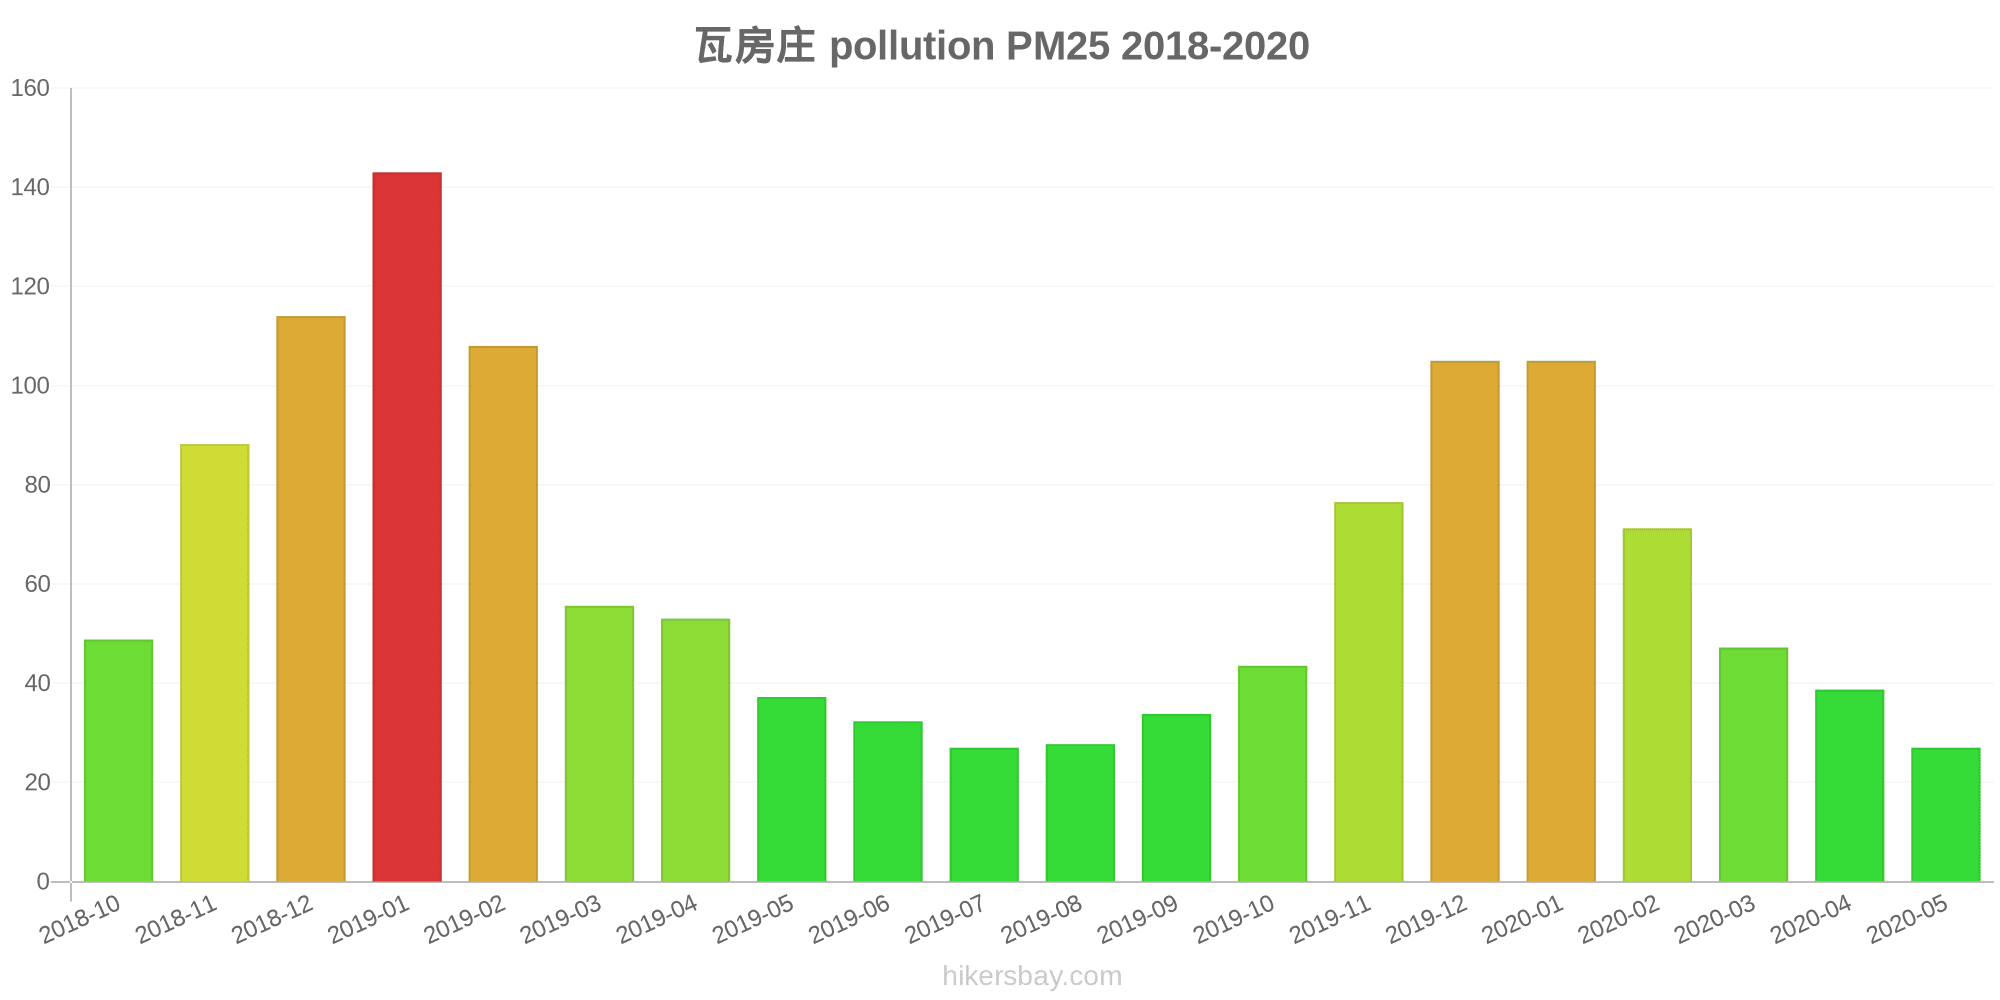
瓦房庄
Friday, May 27, 2022, 12:00 PM
PM10 179 (Very bad Hazardous)
particulate matter (PM10) suspended dust
PM2,5 35 (Unhealthy for Sensitive Groups)
particulate matter (PM2.5) dust
O3 0.04 (Good)
ozone (O3)
NO2 0 (Good)
nitrogen dioxide (NO2)
SO2 0 (Good)
sulfur dioxide (SO2)
瓦房庄
index
2022-05-27
pm10
56
pm25
56
o3
0.03
no2
0
so2
0
瓦房庄
2018-10 2020-05

index
2020-05
2020-04
2020-03
2020-02
2020-01
2019-12
2019-11
2019-10
2019-09
2019-08
2019-07
2019-06
2019-05
2019-04
2019-03
2019-02
2019-01
2018-12
2018-11
2018-10
pm25
27
39
47
71
105
105
77
44
34
28
27
32
37
53
56
108
143
114
88
49
co
785
787
836
871
1
1
968
946
712
801
853
776
763
924
886
1
1
1
1
979
no2
16
26
21
15
30
40
34
33
23
18
20
23
25
27
29
31
49
50
46
45
o3
131
135
114
90
77
59
92
108
169
170
170
179
160
123
112
74
60
54
89
119
pm10
71
83
88
78
119
133
131
96
65
47
43
53
94
96
108
150
207
181
149
102
so2
9
8.8
6.5
8.1
9.2
10
9
9
9.2
7.5
6.8
6.9
6.6
3.9
4.8
7.7
9.6
12
9.9
11
* Pollution data source:
https://openaq.org
(ChinaAQIData)
The data is licensed under CC-By 4.0
PM10 179 (Very bad Hazardous)
PM2,5 35 (Unhealthy for Sensitive Groups)
O3 0 (Good)
NO2 0 (Good)
SO2 0 (Good)
Data on air pollution from recent days in Huancheng
| index | 2022-05-27 |
|---|---|
| pm10 | 56 Unhealthy for Sensitive Groups |
| pm25 | 56 Unhealthy |
| o3 | 0 Good |
| no2 | 0 Good |
| so2 | 0 Good |

| index | 2020-05 | 2020-04 | 2020-03 | 2020-02 | 2020-01 | 2019-12 | 2019-11 | 2019-10 | 2019-09 | 2019-08 | 2019-07 | 2019-06 | 2019-05 | 2019-04 | 2019-03 | 2019-02 | 2019-01 | 2018-12 | 2018-11 | 2018-10 |
|---|---|---|---|---|---|---|---|---|---|---|---|---|---|---|---|---|---|---|---|---|
| pm25 | 27 (Moderate) | 39 (Unhealthy for Sensitive Groups) | 47 (Unhealthy for Sensitive Groups) | 71 (Unhealthy) | 105 (Very Unhealthy) | 105 (Very Unhealthy) | 77 (Very Unhealthy) | 44 (Unhealthy for Sensitive Groups) | 34 (Moderate) | 28 (Moderate) | 27 (Moderate) | 32 (Moderate) | 37 (Unhealthy for Sensitive Groups) | 53 (Unhealthy for Sensitive Groups) | 56 (Unhealthy) | 108 (Very Unhealthy) | 143 (Very bad Hazardous) | 114 (Very bad Hazardous) | 88 (Very Unhealthy) | 49 (Unhealthy for Sensitive Groups) |
| co | 785 (Good) | 787 (Good) | 836 (Good) | 871 (Good) | 1 (Good) | 1 (Good) | 968 (Good) | 946 (Good) | 712 (Good) | 801 (Good) | 853 (Good) | 776 (Good) | 763 (Good) | 924 (Good) | 886 (Good) | 1 (Good) | 1 (Good) | 1 (Good) | 1 (Good) | 979 (Good) |
| no2 | 16 (Good) | 26 (Good) | 21 (Good) | 15 (Good) | 30 (Good) | 40 (Good) | 34 (Good) | 33 (Good) | 23 (Good) | 18 (Good) | 20 (Good) | 23 (Good) | 25 (Good) | 27 (Good) | 29 (Good) | 31 (Good) | 49 (Moderate) | 50 (Moderate) | 46 (Moderate) | 45 (Moderate) |
| o3 | 131 (Unhealthy for Sensitive Groups) | 135 (Unhealthy for Sensitive Groups) | 114 (Moderate) | 90 (Moderate) | 77 (Moderate) | 59 (Good) | 92 (Moderate) | 108 (Moderate) | 169 (Unhealthy) | 170 (Unhealthy) | 170 (Unhealthy) | 179 (Unhealthy) | 160 (Unhealthy) | 123 (Unhealthy for Sensitive Groups) | 112 (Moderate) | 74 (Moderate) | 60 (Good) | 54 (Good) | 89 (Moderate) | 119 (Moderate) |
| pm10 | 71 (Unhealthy for Sensitive Groups) | 83 (Unhealthy) | 88 (Unhealthy) | 78 (Unhealthy for Sensitive Groups) | 119 (Very Unhealthy) | 133 (Very Unhealthy) | 131 (Very Unhealthy) | 96 (Unhealthy) | 65 (Unhealthy for Sensitive Groups) | 47 (Moderate) | 43 (Moderate) | 53 (Unhealthy for Sensitive Groups) | 94 (Unhealthy) | 96 (Unhealthy) | 108 (Unhealthy) | 150 (Very bad Hazardous) | 207 (Very bad Hazardous) | 181 (Very bad Hazardous) | 149 (Very Unhealthy) | 102 (Unhealthy) |
| so2 | 9 (Good) | 8.8 (Good) | 6.5 (Good) | 8.1 (Good) | 9.2 (Good) | 10 (Good) | 9 (Good) | 9 (Good) | 9.2 (Good) | 7.5 (Good) | 6.8 (Good) | 6.9 (Good) | 6.6 (Good) | 3.9 (Good) | 4.8 (Good) | 7.7 (Good) | 9.6 (Good) | 12 (Good) | 9.9 (Good) | 11 (Good) |
PM10 179 (Very bad Hazardous)
particulate matter (PM10) suspended dustPM2,5 35 (Unhealthy for Sensitive Groups)
particulate matter (PM2.5) dustO3 0.04 (Good)
ozone (O3)NO2 0 (Good)
nitrogen dioxide (NO2)SO2 0 (Good)
sulfur dioxide (SO2)瓦房庄
| index | 2022-05-27 |
|---|---|
| pm10 | 56 |
| pm25 | 56 |
| o3 | 0.03 |
| no2 | 0 |
| so2 | 0 |
瓦房庄
| index | 2020-05 | 2020-04 | 2020-03 | 2020-02 | 2020-01 | 2019-12 | 2019-11 | 2019-10 | 2019-09 | 2019-08 | 2019-07 | 2019-06 | 2019-05 | 2019-04 | 2019-03 | 2019-02 | 2019-01 | 2018-12 | 2018-11 | 2018-10 |
|---|---|---|---|---|---|---|---|---|---|---|---|---|---|---|---|---|---|---|---|---|
| pm25 | 27 | 39 | 47 | 71 | 105 | 105 | 77 | 44 | 34 | 28 | 27 | 32 | 37 | 53 | 56 | 108 | 143 | 114 | 88 | 49 |
| co | 785 | 787 | 836 | 871 | 1 | 1 | 968 | 946 | 712 | 801 | 853 | 776 | 763 | 924 | 886 | 1 | 1 | 1 | 1 | 979 |
| no2 | 16 | 26 | 21 | 15 | 30 | 40 | 34 | 33 | 23 | 18 | 20 | 23 | 25 | 27 | 29 | 31 | 49 | 50 | 46 | 45 |
| o3 | 131 | 135 | 114 | 90 | 77 | 59 | 92 | 108 | 169 | 170 | 170 | 179 | 160 | 123 | 112 | 74 | 60 | 54 | 89 | 119 |
| pm10 | 71 | 83 | 88 | 78 | 119 | 133 | 131 | 96 | 65 | 47 | 43 | 53 | 94 | 96 | 108 | 150 | 207 | 181 | 149 | 102 |
| so2 | 9 | 8.8 | 6.5 | 8.1 | 9.2 | 10 | 9 | 9 | 9.2 | 7.5 | 6.8 | 6.9 | 6.6 | 3.9 | 4.8 | 7.7 | 9.6 | 12 | 9.9 | 11 |