Air Pollution in Nanwai: Real-time Air Quality Index and smog alert.
Pollution and air quality forecast for Nanwai. Today is Tuesday, June 16, 2026. The following air pollution values have been recorded for Nanwai:- particulate matter (PM2.5) dust - 61 (Unhealthy)
- nitrogen dioxide (NO2) - 22 (Good)
- particulate matter (PM10) suspended dust - 69 (Unhealthy for Sensitive Groups)
- carbon monoxide (CO) - 219 (Good)
- ozone (O3) - 0 (Good)
- sulfur dioxide (SO2) - 8 (Good)

What is the air quality in Nanwai today? Is the air polluted in Nanwai?. Is there smog?
What is the current level of PM2.5 in Nanwai? (particulate matter (PM2.5) dust)
Today's PM2.5 level is:
61 (Unhealthy)
For comparison, the highest level of PM2.5 in Nanwai in the last 7 days was: 28 (Friday, May 27, 2022) and the lowest: 28 (Friday, May 27, 2022).
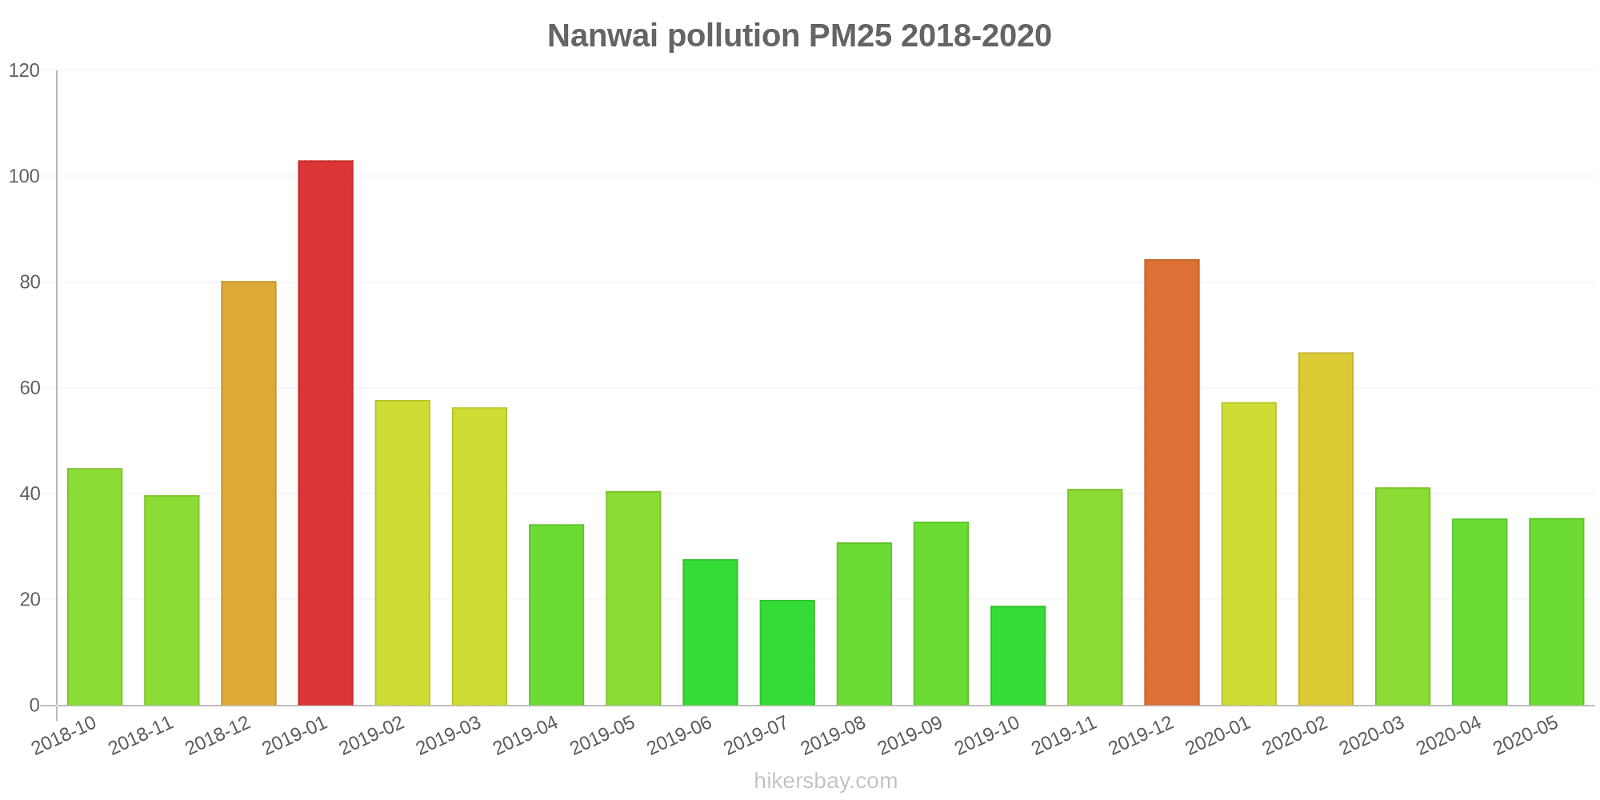
The highest PM2.5 values were recorded: 103 (January 2019).
The lowest level of particulate matter PM2.5 pollution occurs in month: October (19).
How high is the level of NO2? (nitrogen dioxide (NO2))
22 (Good)
What is the level of PM10 today in Nanwai? (particulate matter (PM10) suspended dust)
The current level of particulate matter PM10 in Nanwai is:
69 (Unhealthy for Sensitive Groups)
The highest PM10 values usually occur in month: 146 (January 2019).
The lowest value of particulate matter PM10 pollution in Nanwai is usually recorded in: October (35).
How high is the CO level? (carbon monoxide (CO))
219 (Good)
How is the O3 level today in Nanwai? (ozone (O3))
0 (Good)
What is the level of SO2 pollution? (sulfur dioxide (SO2))
8 (Good)
Current data Friday, May 27, 2022, 3:00 PM
PM2,5 61 (Unhealthy)
NO2 22 (Good)
PM10 69 (Unhealthy for Sensitive Groups)
CO 219 (Good)
O3 0 (Good)
SO2 8 (Good)
Data on air pollution from recent days in Nanwai
index
2022-05-27
pm25
28
Moderate
no2
22
Good
pm10
35
Moderate
co
579
Good
o3
22
Good
so2
5
Good
data source »
Air pollution in Nanwai from October 2018 to May 2020
index
2020-05
2020-04
2020-03
2020-02
2020-01
2019-12
2019-11
2019-10
2019-09
2019-08
2019-07
2019-06
2019-05
2019-04
2019-03
2019-02
2019-01
2018-12
2018-11
2018-10
pm25
35 (Unhealthy for Sensitive Groups)
35 (Unhealthy for Sensitive Groups)
41 (Unhealthy for Sensitive Groups)
67 (Unhealthy)
57 (Unhealthy)
84 (Very Unhealthy)
41 (Unhealthy for Sensitive Groups)
19 (Moderate)
35 (Moderate)
31 (Moderate)
20 (Moderate)
28 (Moderate)
41 (Unhealthy for Sensitive Groups)
34 (Moderate)
56 (Unhealthy)
58 (Unhealthy)
103 (Very Unhealthy)
80 (Very Unhealthy)
40 (Unhealthy for Sensitive Groups)
45 (Unhealthy for Sensitive Groups)
co
726 (Good)
740 (Good)
753 (Good)
1 (Good)
1 (Good)
1 (Good)
816 (Good)
651 (Good)
870 (Good)
798 (Good)
740 (Good)
883 (Good)
845 (Good)
817 (Good)
960 (Good)
926 (Good)
1 (Good)
1 (Good)
992 (Good)
827 (Good)
no2
35 (Good)
57 (Moderate)
40 (Good)
18 (Good)
27 (Good)
48 (Moderate)
39 (Good)
46 (Moderate)
50 (Moderate)
44 (Moderate)
41 (Moderate)
53 (Moderate)
55 (Moderate)
49 (Moderate)
53 (Moderate)
39 (Good)
53 (Moderate)
45 (Moderate)
25 (Good)
27 (Good)
o3
130 (Unhealthy for Sensitive Groups)
112 (Moderate)
95 (Moderate)
73 (Moderate)
60 (Good)
71 (Moderate)
52 (Good)
74 (Moderate)
109 (Moderate)
148 (Unhealthy for Sensitive Groups)
112 (Moderate)
103 (Moderate)
109 (Moderate)
104 (Moderate)
86 (Moderate)
66 (Good)
63 (Good)
60 (Good)
90 (Moderate)
99 (Moderate)
pm10
69 (Unhealthy for Sensitive Groups)
66 (Unhealthy for Sensitive Groups)
85 (Unhealthy)
78 (Unhealthy for Sensitive Groups)
83 (Unhealthy)
125 (Very Unhealthy)
77 (Unhealthy for Sensitive Groups)
35 (Moderate)
54 (Unhealthy for Sensitive Groups)
64 (Unhealthy for Sensitive Groups)
44 (Moderate)
62 (Unhealthy for Sensitive Groups)
81 (Unhealthy)
70 (Unhealthy for Sensitive Groups)
95 (Unhealthy)
87 (Unhealthy)
146 (Very Unhealthy)
117 (Very Unhealthy)
61 (Unhealthy for Sensitive Groups)
74 (Unhealthy for Sensitive Groups)
so2
15 (Good)
14 (Good)
18 (Good)
15 (Good)
17 (Good)
11 (Good)
11 (Good)
9.4 (Good)
9.4 (Good)
8.3 (Good)
8.1 (Good)
7.7 (Good)
9.1 (Good)
8.7 (Good)
6.8 (Good)
7.1 (Good)
8.6 (Good)
11 (Good)
6.3 (Good)
6.3 (Good)
data source »
达县机关宾馆
Friday, May 27, 2022, 3:00 PM
PM2,5 61 (Unhealthy)
particulate matter (PM2.5) dust
NO2 22 (Good)
nitrogen dioxide (NO2)
PM10 69 (Unhealthy for Sensitive Groups)
particulate matter (PM10) suspended dust
CO 219 (Good)
carbon monoxide (CO)
O3 0.05 (Good)
ozone (O3)
SO2 7.7 (Good)
sulfur dioxide (SO2)
达县机关宾馆
index
2022-05-27
pm25
28
no2
22
pm10
35
co
579
o3
22
so2
4.6
达县机关宾馆
2018-10 2020-05

index
2020-05
2020-04
2020-03
2020-02
2020-01
2019-12
2019-11
2019-10
2019-09
2019-08
2019-07
2019-06
2019-05
2019-04
2019-03
2019-02
2019-01
2018-12
2018-11
2018-10
pm25
35
35
41
67
57
84
41
19
35
31
20
28
41
34
56
58
103
80
40
45
co
726
740
753
1
1
1
816
651
870
798
740
883
845
817
960
926
1
1
992
827
no2
35
57
40
18
27
48
39
46
50
44
41
53
55
49
53
39
53
45
25
27
o3
130
112
95
73
60
71
52
74
109
148
112
103
109
104
86
66
63
60
90
99
pm10
69
66
85
78
83
125
77
35
54
64
44
62
81
70
95
87
146
117
61
74
so2
15
14
18
15
17
11
11
9.4
9.4
8.3
8.1
7.7
9.1
8.7
6.8
7.1
8.6
11
6.3
6.3
* Pollution data source:
https://openaq.org
(ChinaAQIData)
The data is licensed under CC-By 4.0
PM2,5 61 (Unhealthy)
NO2 22 (Good)
PM10 69 (Unhealthy for Sensitive Groups)
CO 219 (Good)
O3 0 (Good)
SO2 8 (Good)
Data on air pollution from recent days in Nanwai
| index | 2022-05-27 |
|---|---|
| pm25 | 28 Moderate |
| no2 | 22 Good |
| pm10 | 35 Moderate |
| co | 579 Good |
| o3 | 22 Good |
| so2 | 5 Good |

| index | 2020-05 | 2020-04 | 2020-03 | 2020-02 | 2020-01 | 2019-12 | 2019-11 | 2019-10 | 2019-09 | 2019-08 | 2019-07 | 2019-06 | 2019-05 | 2019-04 | 2019-03 | 2019-02 | 2019-01 | 2018-12 | 2018-11 | 2018-10 |
|---|---|---|---|---|---|---|---|---|---|---|---|---|---|---|---|---|---|---|---|---|
| pm25 | 35 (Unhealthy for Sensitive Groups) | 35 (Unhealthy for Sensitive Groups) | 41 (Unhealthy for Sensitive Groups) | 67 (Unhealthy) | 57 (Unhealthy) | 84 (Very Unhealthy) | 41 (Unhealthy for Sensitive Groups) | 19 (Moderate) | 35 (Moderate) | 31 (Moderate) | 20 (Moderate) | 28 (Moderate) | 41 (Unhealthy for Sensitive Groups) | 34 (Moderate) | 56 (Unhealthy) | 58 (Unhealthy) | 103 (Very Unhealthy) | 80 (Very Unhealthy) | 40 (Unhealthy for Sensitive Groups) | 45 (Unhealthy for Sensitive Groups) |
| co | 726 (Good) | 740 (Good) | 753 (Good) | 1 (Good) | 1 (Good) | 1 (Good) | 816 (Good) | 651 (Good) | 870 (Good) | 798 (Good) | 740 (Good) | 883 (Good) | 845 (Good) | 817 (Good) | 960 (Good) | 926 (Good) | 1 (Good) | 1 (Good) | 992 (Good) | 827 (Good) |
| no2 | 35 (Good) | 57 (Moderate) | 40 (Good) | 18 (Good) | 27 (Good) | 48 (Moderate) | 39 (Good) | 46 (Moderate) | 50 (Moderate) | 44 (Moderate) | 41 (Moderate) | 53 (Moderate) | 55 (Moderate) | 49 (Moderate) | 53 (Moderate) | 39 (Good) | 53 (Moderate) | 45 (Moderate) | 25 (Good) | 27 (Good) |
| o3 | 130 (Unhealthy for Sensitive Groups) | 112 (Moderate) | 95 (Moderate) | 73 (Moderate) | 60 (Good) | 71 (Moderate) | 52 (Good) | 74 (Moderate) | 109 (Moderate) | 148 (Unhealthy for Sensitive Groups) | 112 (Moderate) | 103 (Moderate) | 109 (Moderate) | 104 (Moderate) | 86 (Moderate) | 66 (Good) | 63 (Good) | 60 (Good) | 90 (Moderate) | 99 (Moderate) |
| pm10 | 69 (Unhealthy for Sensitive Groups) | 66 (Unhealthy for Sensitive Groups) | 85 (Unhealthy) | 78 (Unhealthy for Sensitive Groups) | 83 (Unhealthy) | 125 (Very Unhealthy) | 77 (Unhealthy for Sensitive Groups) | 35 (Moderate) | 54 (Unhealthy for Sensitive Groups) | 64 (Unhealthy for Sensitive Groups) | 44 (Moderate) | 62 (Unhealthy for Sensitive Groups) | 81 (Unhealthy) | 70 (Unhealthy for Sensitive Groups) | 95 (Unhealthy) | 87 (Unhealthy) | 146 (Very Unhealthy) | 117 (Very Unhealthy) | 61 (Unhealthy for Sensitive Groups) | 74 (Unhealthy for Sensitive Groups) |
| so2 | 15 (Good) | 14 (Good) | 18 (Good) | 15 (Good) | 17 (Good) | 11 (Good) | 11 (Good) | 9.4 (Good) | 9.4 (Good) | 8.3 (Good) | 8.1 (Good) | 7.7 (Good) | 9.1 (Good) | 8.7 (Good) | 6.8 (Good) | 7.1 (Good) | 8.6 (Good) | 11 (Good) | 6.3 (Good) | 6.3 (Good) |
PM2,5 61 (Unhealthy)
particulate matter (PM2.5) dustNO2 22 (Good)
nitrogen dioxide (NO2)PM10 69 (Unhealthy for Sensitive Groups)
particulate matter (PM10) suspended dustCO 219 (Good)
carbon monoxide (CO)O3 0.05 (Good)
ozone (O3)SO2 7.7 (Good)
sulfur dioxide (SO2)达县机关宾馆
| index | 2022-05-27 |
|---|---|
| pm25 | 28 |
| no2 | 22 |
| pm10 | 35 |
| co | 579 |
| o3 | 22 |
| so2 | 4.6 |
达县机关宾馆

| index | 2020-05 | 2020-04 | 2020-03 | 2020-02 | 2020-01 | 2019-12 | 2019-11 | 2019-10 | 2019-09 | 2019-08 | 2019-07 | 2019-06 | 2019-05 | 2019-04 | 2019-03 | 2019-02 | 2019-01 | 2018-12 | 2018-11 | 2018-10 |
|---|---|---|---|---|---|---|---|---|---|---|---|---|---|---|---|---|---|---|---|---|
| pm25 | 35 | 35 | 41 | 67 | 57 | 84 | 41 | 19 | 35 | 31 | 20 | 28 | 41 | 34 | 56 | 58 | 103 | 80 | 40 | 45 |
| co | 726 | 740 | 753 | 1 | 1 | 1 | 816 | 651 | 870 | 798 | 740 | 883 | 845 | 817 | 960 | 926 | 1 | 1 | 992 | 827 |
| no2 | 35 | 57 | 40 | 18 | 27 | 48 | 39 | 46 | 50 | 44 | 41 | 53 | 55 | 49 | 53 | 39 | 53 | 45 | 25 | 27 |
| o3 | 130 | 112 | 95 | 73 | 60 | 71 | 52 | 74 | 109 | 148 | 112 | 103 | 109 | 104 | 86 | 66 | 63 | 60 | 90 | 99 |
| pm10 | 69 | 66 | 85 | 78 | 83 | 125 | 77 | 35 | 54 | 64 | 44 | 62 | 81 | 70 | 95 | 87 | 146 | 117 | 61 | 74 |
| so2 | 15 | 14 | 18 | 15 | 17 | 11 | 11 | 9.4 | 9.4 | 8.3 | 8.1 | 7.7 | 9.1 | 8.7 | 6.8 | 7.1 | 8.6 | 11 | 6.3 | 6.3 |