Air Pollution in Majiachang: Real-time Air Quality Index and smog alert.
Pollution and air quality forecast for Majiachang. Today is Tuesday, June 16, 2026. The following air pollution values have been recorded for Majiachang:- particulate matter (PM2.5) dust - 61 (Unhealthy)
- nitrogen dioxide (NO2) - 22 (Good)
- particulate matter (PM10) suspended dust - 69 (Unhealthy for Sensitive Groups)
- carbon monoxide (CO) - 219 (Good)
- ozone (O3) - 0 (Good)
- sulfur dioxide (SO2) - 8 (Good)

What is the air quality in Majiachang today? Is the air polluted in Majiachang?. Is there smog?
What is the current level of PM2.5 in Majiachang? (particulate matter (PM2.5) dust)
Today's PM2.5 level is:
61 (Unhealthy)
For comparison, the highest level of PM2.5 in Majiachang in the last 7 days was: 28 (Friday, May 27, 2022) and the lowest: 28 (Friday, May 27, 2022).
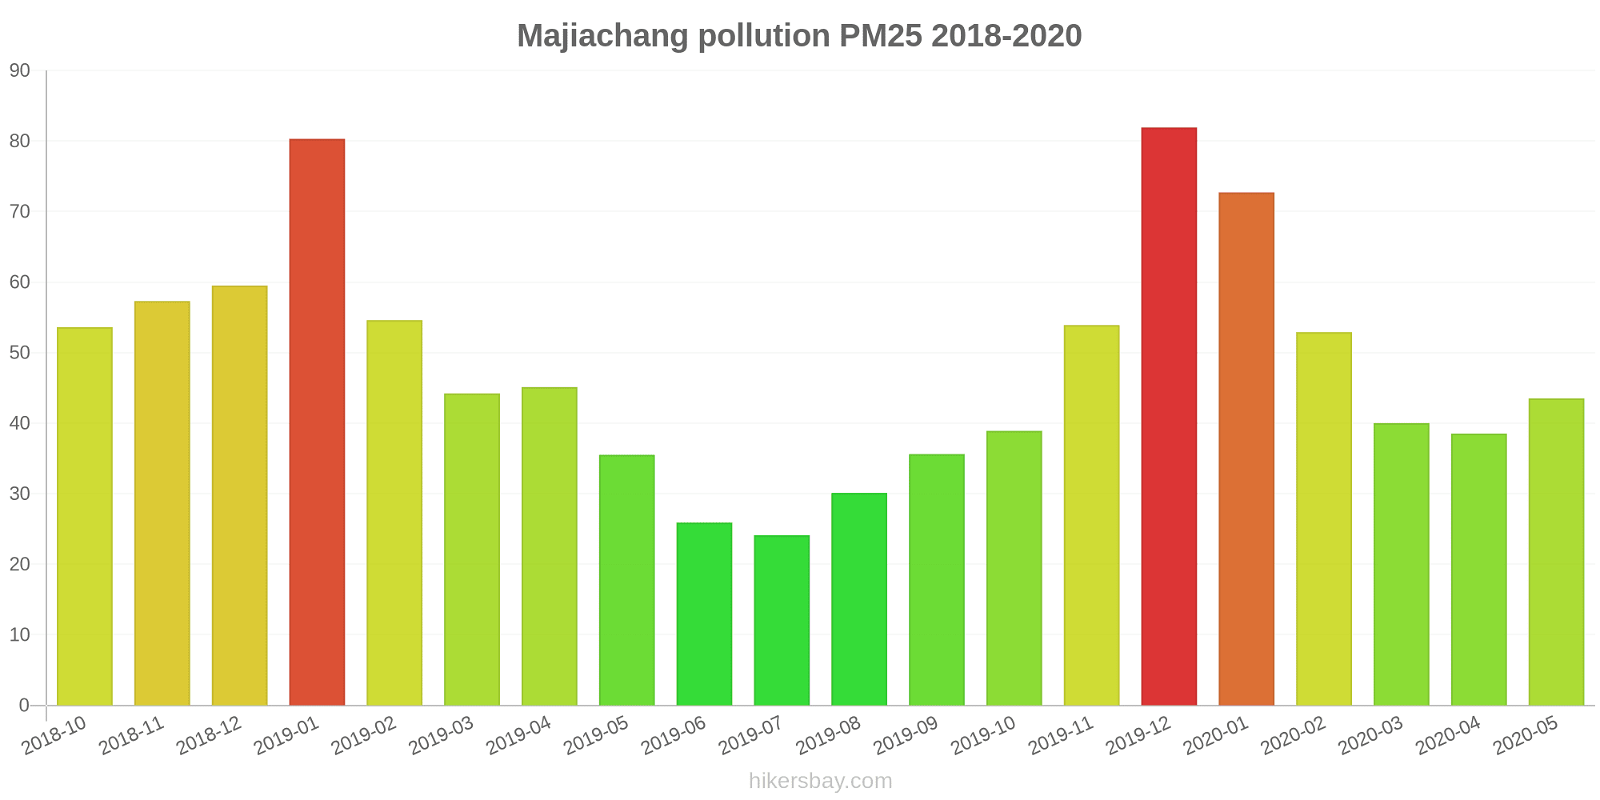
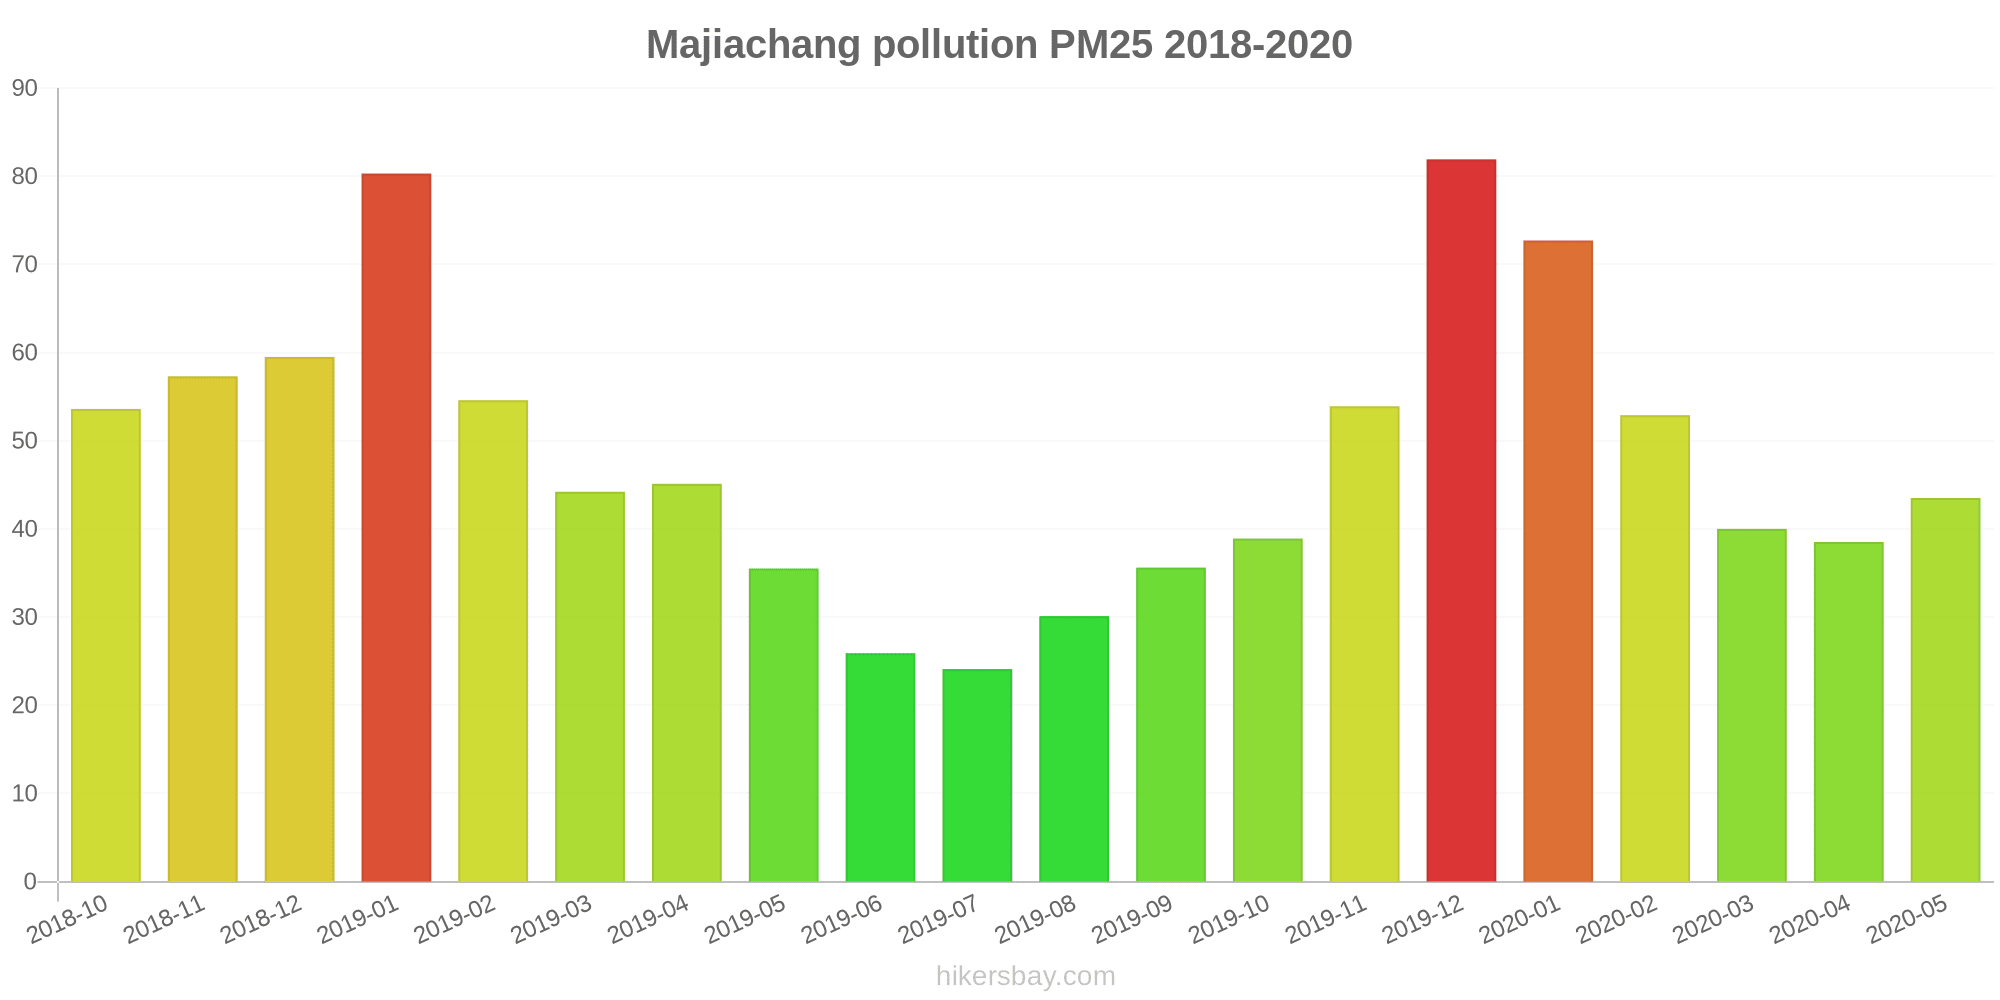
The highest PM2.5 values were recorded: 82 (December 2019).
The lowest level of particulate matter PM2.5 pollution occurs in month: July (24).
How high is the level of NO2? (nitrogen dioxide (NO2))
22 (Good)
What is the level of PM10 today in Majiachang? (particulate matter (PM10) suspended dust)
The current level of particulate matter PM10 in Majiachang is:
69 (Unhealthy for Sensitive Groups)
The highest PM10 values usually occur in month: 130 (January 2019).
The lowest value of particulate matter PM10 pollution in Majiachang is usually recorded in: July (42).
How high is the CO level? (carbon monoxide (CO))
219 (Good)
How is the O3 level today in Majiachang? (ozone (O3))
0 (Good)
What is the level of SO2 pollution? (sulfur dioxide (SO2))
8 (Good)
Current data Friday, May 27, 2022, 3:00 PM
PM2,5 61 (Unhealthy)
NO2 22 (Good)
PM10 69 (Unhealthy for Sensitive Groups)
CO 219 (Good)
O3 0 (Good)
SO2 8 (Good)
Data on air pollution from recent days in Majiachang
index
2022-05-27
pm25
28
Moderate
no2
22
Good
pm10
35
Moderate
co
579
Good
o3
22
Good
so2
5
Good
data source »
Air pollution in Majiachang from October 2018 to May 2020
index
2020-05
2020-04
2020-03
2020-02
2020-01
2019-12
2019-11
2019-10
2019-09
2019-08
2019-07
2019-06
2019-05
2019-04
2019-03
2019-02
2019-01
2018-12
2018-11
2018-10
pm25
44 (Unhealthy for Sensitive Groups)
39 (Unhealthy for Sensitive Groups)
40 (Unhealthy for Sensitive Groups)
53 (Unhealthy for Sensitive Groups)
73 (Unhealthy)
82 (Very Unhealthy)
54 (Unhealthy for Sensitive Groups)
39 (Unhealthy for Sensitive Groups)
36 (Unhealthy for Sensitive Groups)
30 (Moderate)
24 (Moderate)
26 (Moderate)
36 (Unhealthy for Sensitive Groups)
45 (Unhealthy for Sensitive Groups)
44 (Unhealthy for Sensitive Groups)
55 (Unhealthy for Sensitive Groups)
80 (Very Unhealthy)
60 (Unhealthy)
57 (Unhealthy)
54 (Unhealthy for Sensitive Groups)
co
686 (Good)
709 (Good)
765 (Good)
817 (Good)
1 (Good)
1 (Good)
844 (Good)
712 (Good)
711 (Good)
840 (Good)
814 (Good)
890 (Good)
853 (Good)
997 (Good)
889 (Good)
1 (Good)
1 (Good)
1 (Good)
1 (Good)
914 (Good)
no2
35 (Good)
40 (Moderate)
35 (Good)
20 (Good)
41 (Moderate)
51 (Moderate)
47 (Moderate)
41 (Moderate)
36 (Good)
33 (Good)
34 (Good)
28 (Good)
35 (Good)
46 (Moderate)
51 (Moderate)
31 (Good)
57 (Moderate)
47 (Moderate)
49 (Moderate)
44 (Moderate)
o3
193 (Very Unhealthy)
131 (Unhealthy for Sensitive Groups)
106 (Moderate)
86 (Moderate)
60 (Good)
49 (Good)
49 (Good)
81 (Moderate)
106 (Moderate)
202 (Very Unhealthy)
168 (Unhealthy)
173 (Unhealthy)
152 (Unhealthy)
167 (Unhealthy)
91 (Moderate)
65 (Good)
56 (Good)
40 (Good)
56 (Good)
71 (Moderate)
pm10
75 (Unhealthy for Sensitive Groups)
62 (Unhealthy for Sensitive Groups)
72 (Unhealthy for Sensitive Groups)
70 (Unhealthy for Sensitive Groups)
89 (Unhealthy)
114 (Very Unhealthy)
86 (Unhealthy)
54 (Unhealthy for Sensitive Groups)
54 (Unhealthy for Sensitive Groups)
49 (Moderate)
42 (Moderate)
45 (Moderate)
64 (Unhealthy for Sensitive Groups)
76 (Unhealthy for Sensitive Groups)
82 (Unhealthy)
85 (Unhealthy)
130 (Very Unhealthy)
107 (Unhealthy)
86 (Unhealthy)
81 (Unhealthy)
so2
7.5 (Good)
8 (Good)
8 (Good)
5.9 (Good)
5.9 (Good)
10 (Good)
7.6 (Good)
7.6 (Good)
6.8 (Good)
6.5 (Good)
7.1 (Good)
8.8 (Good)
7.2 (Good)
10 (Good)
9.9 (Good)
8.5 (Good)
9.6 (Good)
8 (Good)
8.1 (Good)
7.9 (Good)
data source »
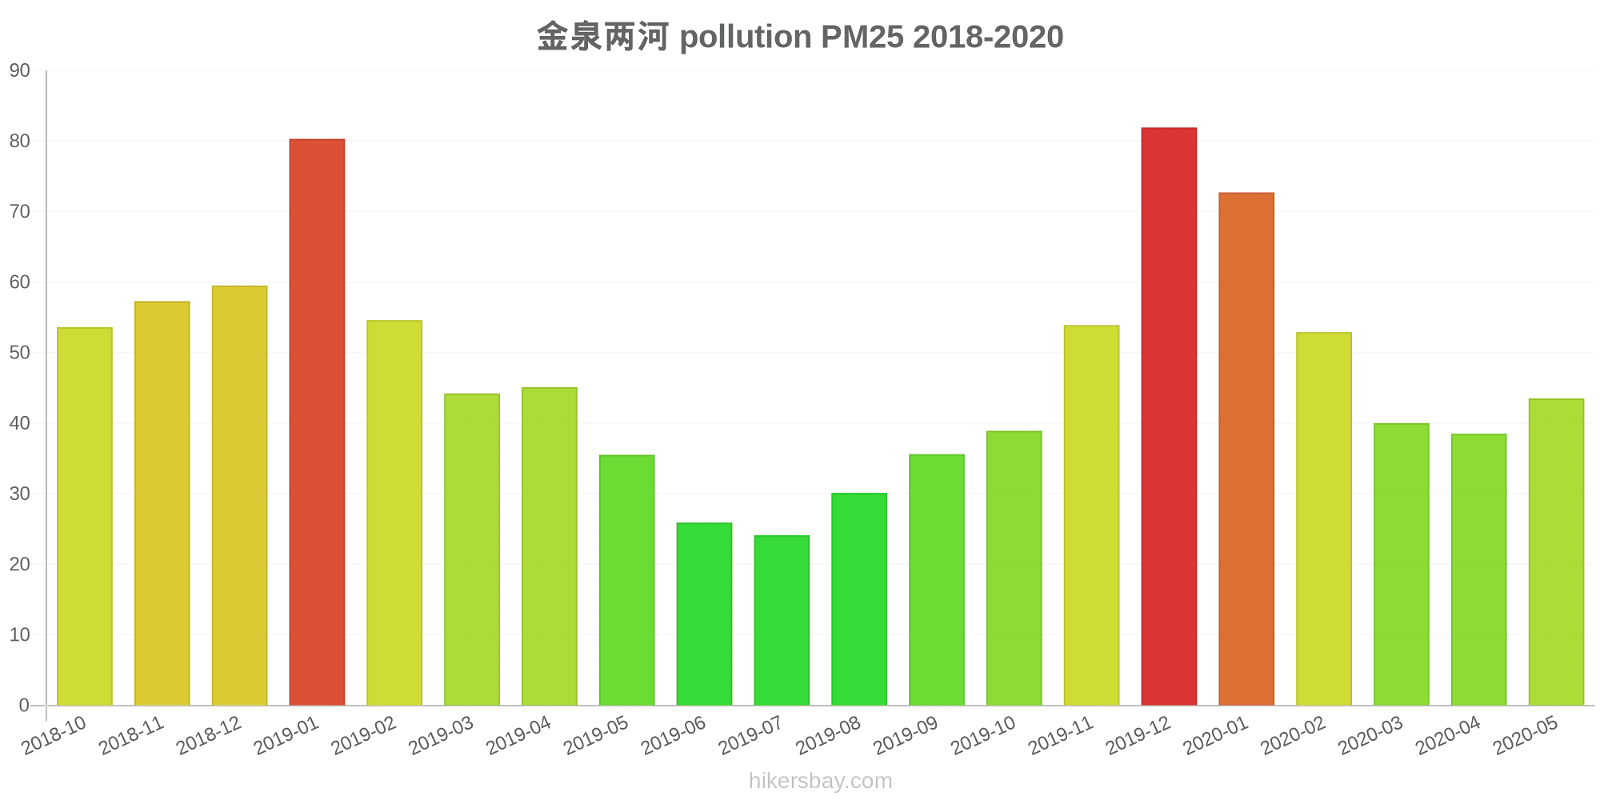
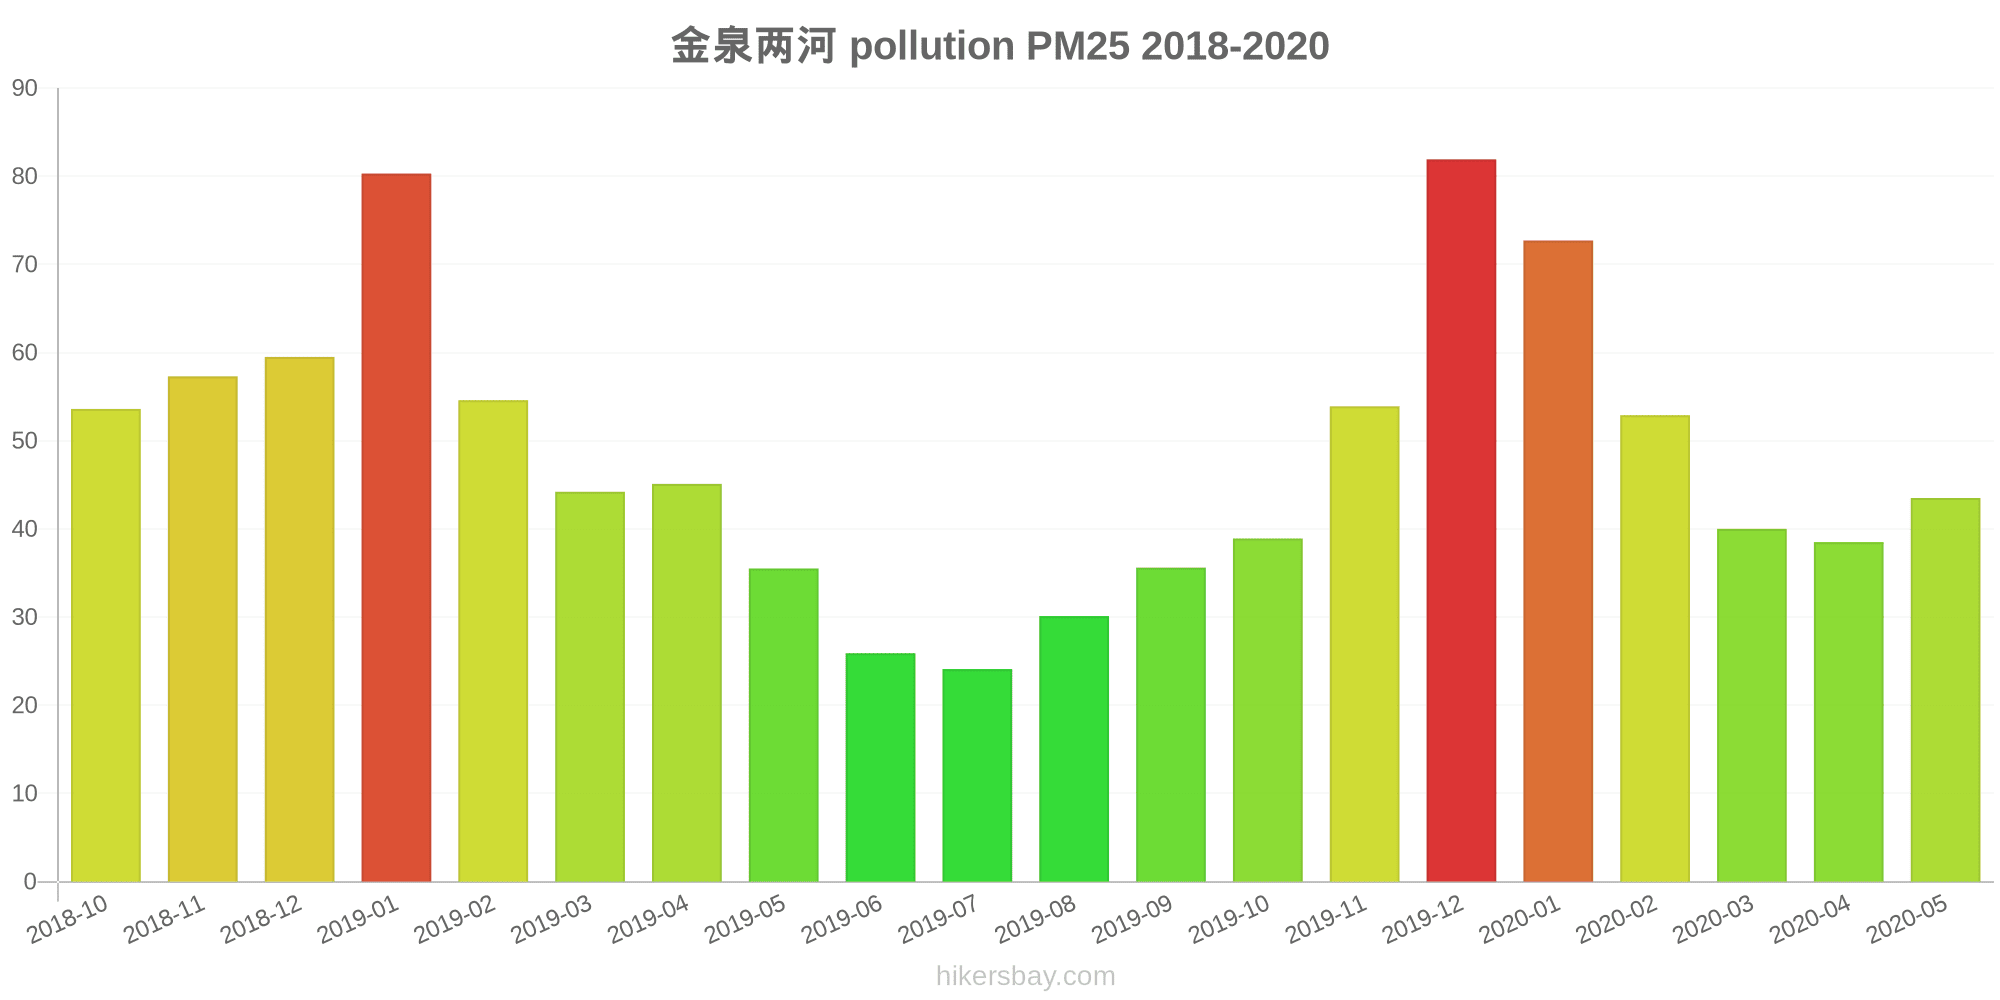
金泉两河
Friday, May 27, 2022, 3:00 PM
PM2,5 61 (Unhealthy)
particulate matter (PM2.5) dust
NO2 22 (Good)
nitrogen dioxide (NO2)
PM10 69 (Unhealthy for Sensitive Groups)
particulate matter (PM10) suspended dust
CO 219 (Good)
carbon monoxide (CO)
O3 0.05 (Good)
ozone (O3)
SO2 7.7 (Good)
sulfur dioxide (SO2)
金泉两河
index
2022-05-27
pm25
28
no2
22
pm10
35
co
579
o3
22
so2
4.6
金泉两河
2018-10 2020-05
index
2020-05
2020-04
2020-03
2020-02
2020-01
2019-12
2019-11
2019-10
2019-09
2019-08
2019-07
2019-06
2019-05
2019-04
2019-03
2019-02
2019-01
2018-12
2018-11
2018-10
pm25
44
39
40
53
73
82
54
39
36
30
24
26
36
45
44
55
80
60
57
54
co
686
709
765
817
1
1
844
712
711
840
814
890
853
997
889
1
1
1
1
914
no2
35
40
35
20
41
51
47
41
36
33
34
28
35
46
51
31
57
47
49
44
o3
193
131
106
86
60
49
49
81
106
202
168
173
152
167
91
65
56
40
56
71
pm10
75
62
72
70
89
114
86
54
54
49
42
45
64
76
82
85
130
107
86
81
so2
7.5
8
8
5.9
5.9
10
7.6
7.6
6.8
6.5
7.1
8.8
7.2
10
9.9
8.5
9.6
8
8.1
7.9
* Pollution data source:
https://openaq.org
(ChinaAQIData)
The data is licensed under CC-By 4.0
PM2,5 61 (Unhealthy)
NO2 22 (Good)
PM10 69 (Unhealthy for Sensitive Groups)
CO 219 (Good)
O3 0 (Good)
SO2 8 (Good)
Data on air pollution from recent days in Majiachang
| index | 2022-05-27 |
|---|---|
| pm25 | 28 Moderate |
| no2 | 22 Good |
| pm10 | 35 Moderate |
| co | 579 Good |
| o3 | 22 Good |
| so2 | 5 Good |
| index | 2020-05 | 2020-04 | 2020-03 | 2020-02 | 2020-01 | 2019-12 | 2019-11 | 2019-10 | 2019-09 | 2019-08 | 2019-07 | 2019-06 | 2019-05 | 2019-04 | 2019-03 | 2019-02 | 2019-01 | 2018-12 | 2018-11 | 2018-10 |
|---|---|---|---|---|---|---|---|---|---|---|---|---|---|---|---|---|---|---|---|---|
| pm25 | 44 (Unhealthy for Sensitive Groups) | 39 (Unhealthy for Sensitive Groups) | 40 (Unhealthy for Sensitive Groups) | 53 (Unhealthy for Sensitive Groups) | 73 (Unhealthy) | 82 (Very Unhealthy) | 54 (Unhealthy for Sensitive Groups) | 39 (Unhealthy for Sensitive Groups) | 36 (Unhealthy for Sensitive Groups) | 30 (Moderate) | 24 (Moderate) | 26 (Moderate) | 36 (Unhealthy for Sensitive Groups) | 45 (Unhealthy for Sensitive Groups) | 44 (Unhealthy for Sensitive Groups) | 55 (Unhealthy for Sensitive Groups) | 80 (Very Unhealthy) | 60 (Unhealthy) | 57 (Unhealthy) | 54 (Unhealthy for Sensitive Groups) |
| co | 686 (Good) | 709 (Good) | 765 (Good) | 817 (Good) | 1 (Good) | 1 (Good) | 844 (Good) | 712 (Good) | 711 (Good) | 840 (Good) | 814 (Good) | 890 (Good) | 853 (Good) | 997 (Good) | 889 (Good) | 1 (Good) | 1 (Good) | 1 (Good) | 1 (Good) | 914 (Good) |
| no2 | 35 (Good) | 40 (Moderate) | 35 (Good) | 20 (Good) | 41 (Moderate) | 51 (Moderate) | 47 (Moderate) | 41 (Moderate) | 36 (Good) | 33 (Good) | 34 (Good) | 28 (Good) | 35 (Good) | 46 (Moderate) | 51 (Moderate) | 31 (Good) | 57 (Moderate) | 47 (Moderate) | 49 (Moderate) | 44 (Moderate) |
| o3 | 193 (Very Unhealthy) | 131 (Unhealthy for Sensitive Groups) | 106 (Moderate) | 86 (Moderate) | 60 (Good) | 49 (Good) | 49 (Good) | 81 (Moderate) | 106 (Moderate) | 202 (Very Unhealthy) | 168 (Unhealthy) | 173 (Unhealthy) | 152 (Unhealthy) | 167 (Unhealthy) | 91 (Moderate) | 65 (Good) | 56 (Good) | 40 (Good) | 56 (Good) | 71 (Moderate) |
| pm10 | 75 (Unhealthy for Sensitive Groups) | 62 (Unhealthy for Sensitive Groups) | 72 (Unhealthy for Sensitive Groups) | 70 (Unhealthy for Sensitive Groups) | 89 (Unhealthy) | 114 (Very Unhealthy) | 86 (Unhealthy) | 54 (Unhealthy for Sensitive Groups) | 54 (Unhealthy for Sensitive Groups) | 49 (Moderate) | 42 (Moderate) | 45 (Moderate) | 64 (Unhealthy for Sensitive Groups) | 76 (Unhealthy for Sensitive Groups) | 82 (Unhealthy) | 85 (Unhealthy) | 130 (Very Unhealthy) | 107 (Unhealthy) | 86 (Unhealthy) | 81 (Unhealthy) |
| so2 | 7.5 (Good) | 8 (Good) | 8 (Good) | 5.9 (Good) | 5.9 (Good) | 10 (Good) | 7.6 (Good) | 7.6 (Good) | 6.8 (Good) | 6.5 (Good) | 7.1 (Good) | 8.8 (Good) | 7.2 (Good) | 10 (Good) | 9.9 (Good) | 8.5 (Good) | 9.6 (Good) | 8 (Good) | 8.1 (Good) | 7.9 (Good) |
PM2,5 61 (Unhealthy)
particulate matter (PM2.5) dustNO2 22 (Good)
nitrogen dioxide (NO2)PM10 69 (Unhealthy for Sensitive Groups)
particulate matter (PM10) suspended dustCO 219 (Good)
carbon monoxide (CO)O3 0.05 (Good)
ozone (O3)SO2 7.7 (Good)
sulfur dioxide (SO2)金泉两河
| index | 2022-05-27 |
|---|---|
| pm25 | 28 |
| no2 | 22 |
| pm10 | 35 |
| co | 579 |
| o3 | 22 |
| so2 | 4.6 |
金泉两河
| index | 2020-05 | 2020-04 | 2020-03 | 2020-02 | 2020-01 | 2019-12 | 2019-11 | 2019-10 | 2019-09 | 2019-08 | 2019-07 | 2019-06 | 2019-05 | 2019-04 | 2019-03 | 2019-02 | 2019-01 | 2018-12 | 2018-11 | 2018-10 |
|---|---|---|---|---|---|---|---|---|---|---|---|---|---|---|---|---|---|---|---|---|
| pm25 | 44 | 39 | 40 | 53 | 73 | 82 | 54 | 39 | 36 | 30 | 24 | 26 | 36 | 45 | 44 | 55 | 80 | 60 | 57 | 54 |
| co | 686 | 709 | 765 | 817 | 1 | 1 | 844 | 712 | 711 | 840 | 814 | 890 | 853 | 997 | 889 | 1 | 1 | 1 | 1 | 914 |
| no2 | 35 | 40 | 35 | 20 | 41 | 51 | 47 | 41 | 36 | 33 | 34 | 28 | 35 | 46 | 51 | 31 | 57 | 47 | 49 | 44 |
| o3 | 193 | 131 | 106 | 86 | 60 | 49 | 49 | 81 | 106 | 202 | 168 | 173 | 152 | 167 | 91 | 65 | 56 | 40 | 56 | 71 |
| pm10 | 75 | 62 | 72 | 70 | 89 | 114 | 86 | 54 | 54 | 49 | 42 | 45 | 64 | 76 | 82 | 85 | 130 | 107 | 86 | 81 |
| so2 | 7.5 | 8 | 8 | 5.9 | 5.9 | 10 | 7.6 | 7.6 | 6.8 | 6.5 | 7.1 | 8.8 | 7.2 | 10 | 9.9 | 8.5 | 9.6 | 8 | 8.1 | 7.9 |