Air Pollution in Baiyansi: Real-time Air Quality Index and smog alert.
Pollution and air quality forecast for Baiyansi. Today is Tuesday, June 16, 2026. The following air pollution values have been recorded for Baiyansi:- particulate matter (PM2.5) dust - 61 (Unhealthy)
- nitrogen dioxide (NO2) - 22 (Good)
- particulate matter (PM10) suspended dust - 69 (Unhealthy for Sensitive Groups)
- carbon monoxide (CO) - 219 (Good)
- ozone (O3) - 0 (Good)
- sulfur dioxide (SO2) - 8 (Good)

What is the air quality in Baiyansi today? Is the air polluted in Baiyansi?. Is there smog?
What is the current level of PM2.5 in Baiyansi? (particulate matter (PM2.5) dust)
Today's PM2.5 level is:
61 (Unhealthy)
For comparison, the highest level of PM2.5 in Baiyansi in the last 7 days was: 28 (Friday, May 27, 2022) and the lowest: 28 (Friday, May 27, 2022).
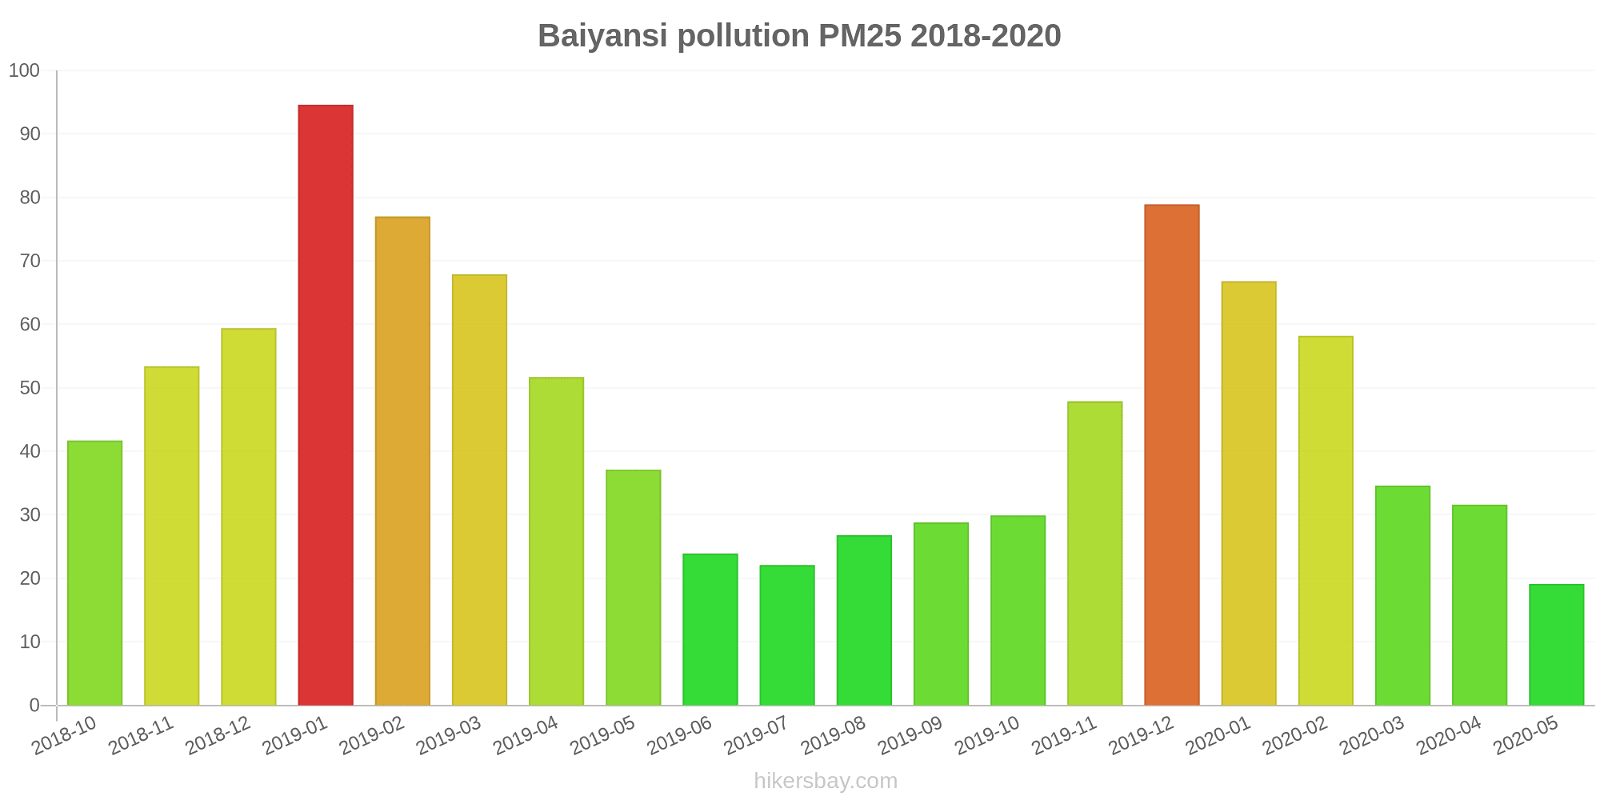
The highest PM2.5 values were recorded: 95 (January 2019).
The lowest level of particulate matter PM2.5 pollution occurs in month: May (19).
How high is the level of NO2? (nitrogen dioxide (NO2))
22 (Good)
What is the level of PM10 today in Baiyansi? (particulate matter (PM10) suspended dust)
The current level of particulate matter PM10 in Baiyansi is:
69 (Unhealthy for Sensitive Groups)
The highest PM10 values usually occur in month: 117 (January 2019).
The lowest value of particulate matter PM10 pollution in Baiyansi is usually recorded in: July (33).
How high is the CO level? (carbon monoxide (CO))
219 (Good)
How is the O3 level today in Baiyansi? (ozone (O3))
0 (Good)
What is the level of SO2 pollution? (sulfur dioxide (SO2))
8 (Good)
Current data Friday, May 27, 2022, 3:00 PM
PM2,5 61 (Unhealthy)
NO2 22 (Good)
PM10 69 (Unhealthy for Sensitive Groups)
CO 219 (Good)
O3 0 (Good)
SO2 8 (Good)
Data on air pollution from recent days in Baiyansi
index
2022-05-27
pm25
28
Moderate
no2
22
Good
pm10
35
Moderate
co
579
Good
o3
22
Good
so2
5
Good
data source »
Air pollution in Baiyansi from October 2018 to May 2020
index
2020-05
2020-04
2020-03
2020-02
2020-01
2019-12
2019-11
2019-10
2019-09
2019-08
2019-07
2019-06
2019-05
2019-04
2019-03
2019-02
2019-01
2018-12
2018-11
2018-10
pm25
19 (Moderate)
32 (Moderate)
35 (Moderate)
58 (Unhealthy)
67 (Unhealthy)
79 (Very Unhealthy)
48 (Unhealthy for Sensitive Groups)
30 (Moderate)
29 (Moderate)
27 (Moderate)
22 (Moderate)
24 (Moderate)
37 (Unhealthy for Sensitive Groups)
52 (Unhealthy for Sensitive Groups)
68 (Unhealthy)
77 (Very Unhealthy)
95 (Very Unhealthy)
59 (Unhealthy)
53 (Unhealthy for Sensitive Groups)
42 (Unhealthy for Sensitive Groups)
co
740 (Good)
703 (Good)
650 (Good)
740 (Good)
1 (Good)
882 (Good)
698 (Good)
745 (Good)
757 (Good)
657 (Good)
710 (Good)
808 (Good)
721 (Good)
728 (Good)
737 (Good)
947 (Good)
1 (Good)
971 (Good)
798 (Good)
876 (Good)
no2
27 (Good)
33 (Good)
31 (Good)
21 (Good)
32 (Good)
43 (Moderate)
33 (Good)
30 (Good)
27 (Good)
24 (Good)
25 (Good)
28 (Good)
29 (Good)
37 (Good)
40 (Moderate)
32 (Good)
45 (Moderate)
39 (Good)
39 (Good)
30 (Good)
o3
165 (Unhealthy)
118 (Moderate)
112 (Moderate)
82 (Moderate)
58 (Good)
53 (Good)
49 (Good)
78 (Moderate)
108 (Moderate)
158 (Unhealthy)
125 (Unhealthy for Sensitive Groups)
131 (Unhealthy for Sensitive Groups)
114 (Moderate)
139 (Unhealthy for Sensitive Groups)
98 (Moderate)
65 (Good)
61 (Good)
42 (Good)
66 (Good)
55 (Good)
pm10
51 (Unhealthy for Sensitive Groups)
53 (Unhealthy for Sensitive Groups)
60 (Unhealthy for Sensitive Groups)
71 (Unhealthy for Sensitive Groups)
76 (Unhealthy for Sensitive Groups)
99 (Unhealthy)
74 (Unhealthy for Sensitive Groups)
44 (Moderate)
41 (Moderate)
41 (Moderate)
33 (Moderate)
42 (Moderate)
54 (Unhealthy for Sensitive Groups)
74 (Unhealthy for Sensitive Groups)
85 (Unhealthy)
88 (Unhealthy)
117 (Very Unhealthy)
82 (Unhealthy)
61 (Unhealthy for Sensitive Groups)
50 (Unhealthy for Sensitive Groups)
so2
9 (Good)
9.9 (Good)
7.9 (Good)
6.6 (Good)
6.4 (Good)
6.6 (Good)
4.9 (Good)
9.7 (Good)
8.4 (Good)
7.3 (Good)
5.9 (Good)
8.1 (Good)
9 (Good)
15 (Good)
15 (Good)
13 (Good)
15 (Good)
11 (Good)
15 (Good)
15 (Good)
data source »
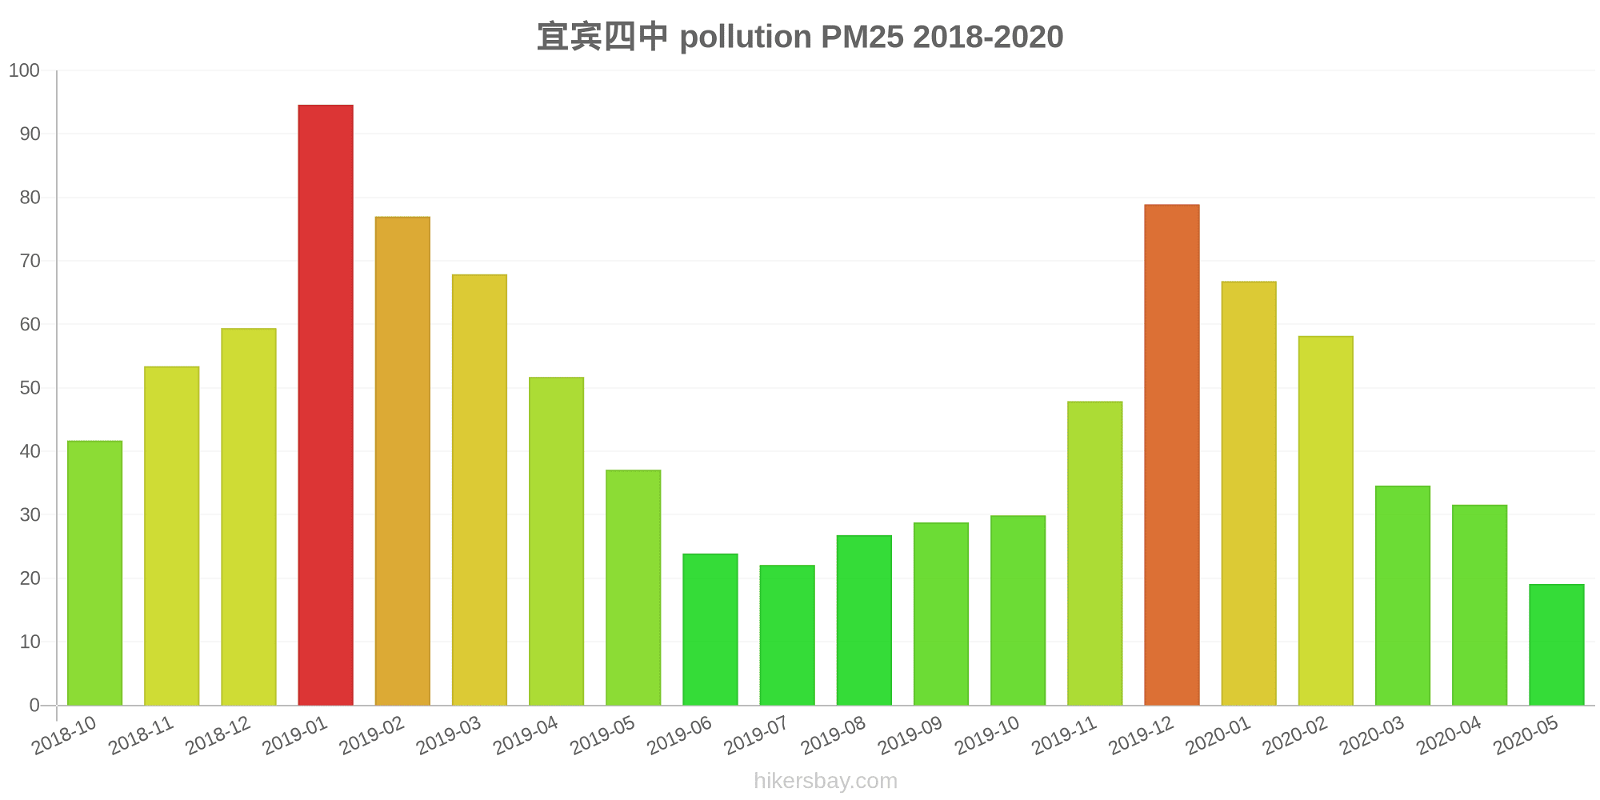
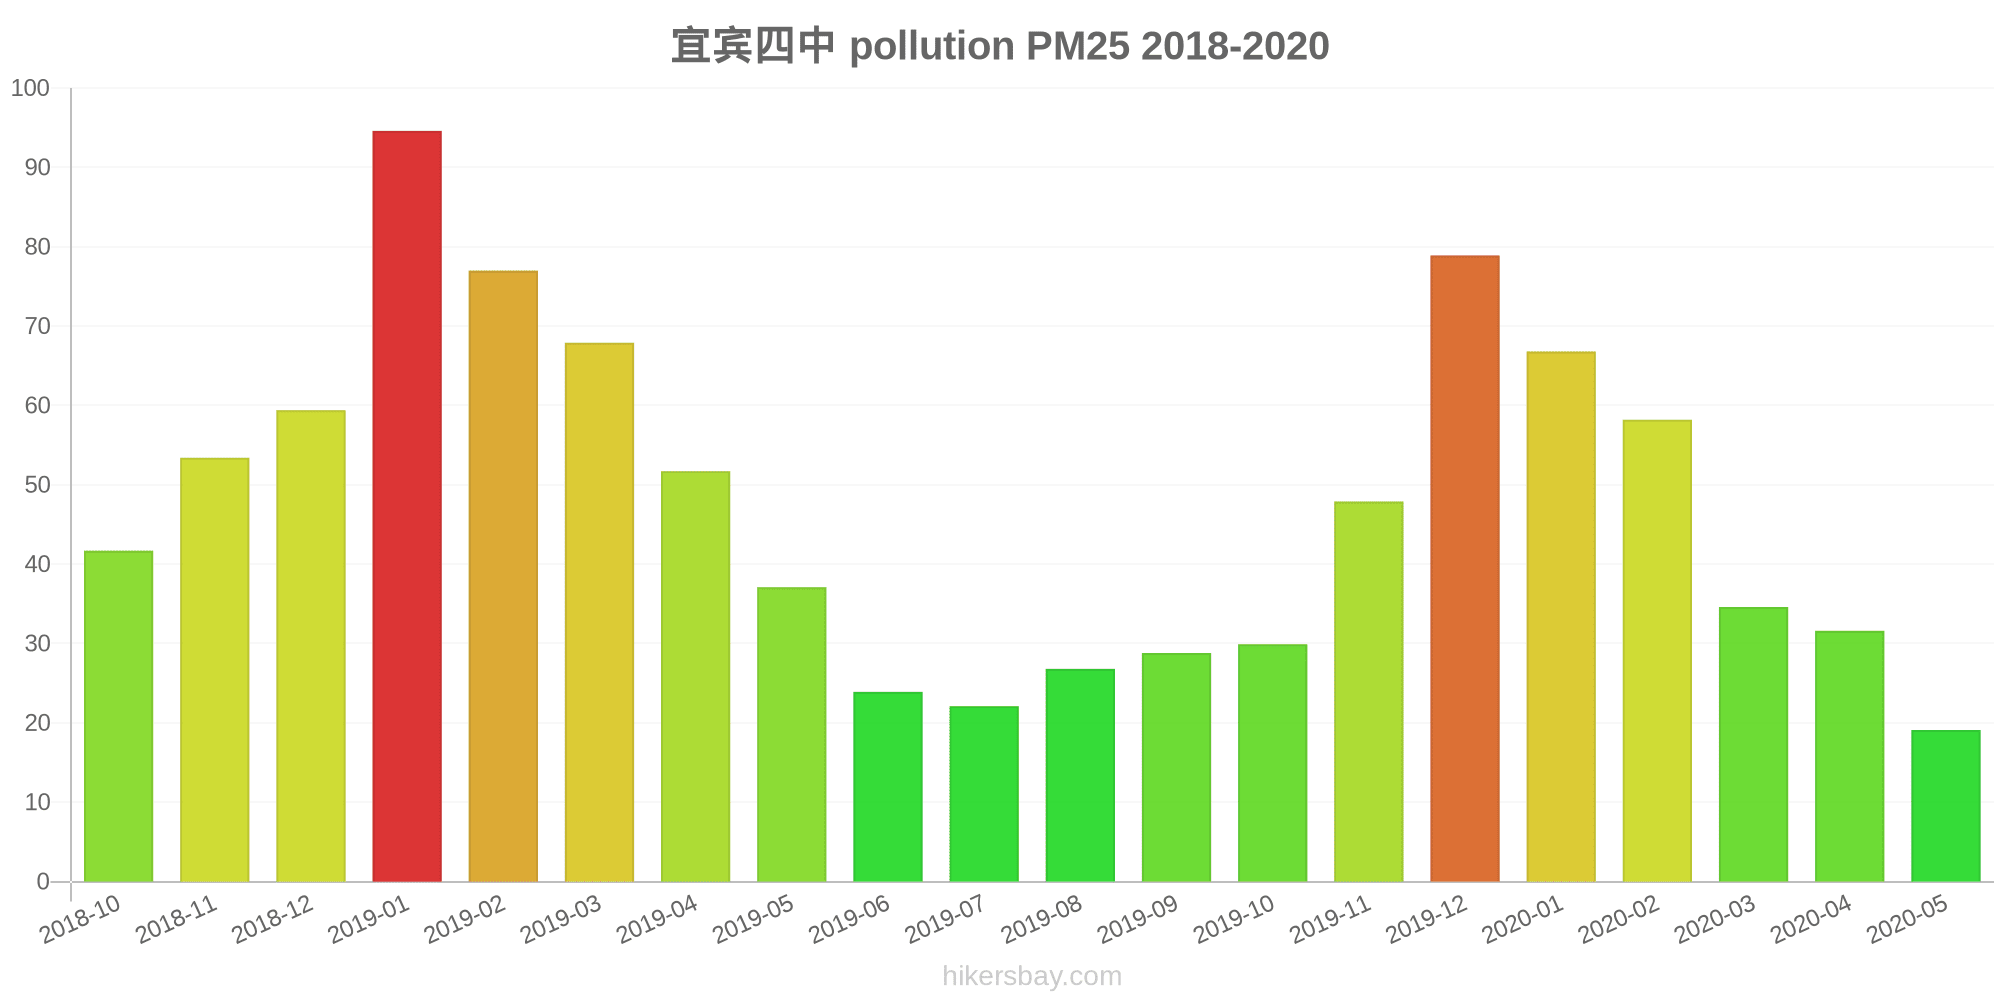
宜宾四中
Friday, May 27, 2022, 3:00 PM
PM2,5 61 (Unhealthy)
particulate matter (PM2.5) dust
NO2 22 (Good)
nitrogen dioxide (NO2)
PM10 69 (Unhealthy for Sensitive Groups)
particulate matter (PM10) suspended dust
CO 219 (Good)
carbon monoxide (CO)
O3 0.05 (Good)
ozone (O3)
SO2 7.7 (Good)
sulfur dioxide (SO2)
宜宾四中
index
2022-05-27
pm25
28
no2
22
pm10
35
co
579
o3
22
so2
4.6
宜宾四中
2018-10 2020-05
index
2020-05
2020-04
2020-03
2020-02
2020-01
2019-12
2019-11
2019-10
2019-09
2019-08
2019-07
2019-06
2019-05
2019-04
2019-03
2019-02
2019-01
2018-12
2018-11
2018-10
pm25
19
32
35
58
67
79
48
30
29
27
22
24
37
52
68
77
95
59
53
42
no2
27
33
31
21
32
43
33
30
27
24
25
28
29
37
40
32
45
39
39
30
o3
165
118
112
82
58
53
49
78
108
158
125
131
114
139
98
65
61
42
66
55
pm10
51
53
60
71
76
99
74
44
41
41
33
42
54
74
85
88
117
82
61
50
so2
9
9.9
7.9
6.6
6.4
6.6
4.9
9.7
8.4
7.3
5.9
8.1
9
15
15
13
15
11
15
15
co
740
703
650
740
1
882
698
745
757
657
710
808
721
728
737
947
1
971
798
876
* Pollution data source:
https://openaq.org
(ChinaAQIData)
The data is licensed under CC-By 4.0
PM2,5 61 (Unhealthy)
NO2 22 (Good)
PM10 69 (Unhealthy for Sensitive Groups)
CO 219 (Good)
O3 0 (Good)
SO2 8 (Good)
Data on air pollution from recent days in Baiyansi
| index | 2022-05-27 |
|---|---|
| pm25 | 28 Moderate |
| no2 | 22 Good |
| pm10 | 35 Moderate |
| co | 579 Good |
| o3 | 22 Good |
| so2 | 5 Good |

| index | 2020-05 | 2020-04 | 2020-03 | 2020-02 | 2020-01 | 2019-12 | 2019-11 | 2019-10 | 2019-09 | 2019-08 | 2019-07 | 2019-06 | 2019-05 | 2019-04 | 2019-03 | 2019-02 | 2019-01 | 2018-12 | 2018-11 | 2018-10 |
|---|---|---|---|---|---|---|---|---|---|---|---|---|---|---|---|---|---|---|---|---|
| pm25 | 19 (Moderate) | 32 (Moderate) | 35 (Moderate) | 58 (Unhealthy) | 67 (Unhealthy) | 79 (Very Unhealthy) | 48 (Unhealthy for Sensitive Groups) | 30 (Moderate) | 29 (Moderate) | 27 (Moderate) | 22 (Moderate) | 24 (Moderate) | 37 (Unhealthy for Sensitive Groups) | 52 (Unhealthy for Sensitive Groups) | 68 (Unhealthy) | 77 (Very Unhealthy) | 95 (Very Unhealthy) | 59 (Unhealthy) | 53 (Unhealthy for Sensitive Groups) | 42 (Unhealthy for Sensitive Groups) |
| co | 740 (Good) | 703 (Good) | 650 (Good) | 740 (Good) | 1 (Good) | 882 (Good) | 698 (Good) | 745 (Good) | 757 (Good) | 657 (Good) | 710 (Good) | 808 (Good) | 721 (Good) | 728 (Good) | 737 (Good) | 947 (Good) | 1 (Good) | 971 (Good) | 798 (Good) | 876 (Good) |
| no2 | 27 (Good) | 33 (Good) | 31 (Good) | 21 (Good) | 32 (Good) | 43 (Moderate) | 33 (Good) | 30 (Good) | 27 (Good) | 24 (Good) | 25 (Good) | 28 (Good) | 29 (Good) | 37 (Good) | 40 (Moderate) | 32 (Good) | 45 (Moderate) | 39 (Good) | 39 (Good) | 30 (Good) |
| o3 | 165 (Unhealthy) | 118 (Moderate) | 112 (Moderate) | 82 (Moderate) | 58 (Good) | 53 (Good) | 49 (Good) | 78 (Moderate) | 108 (Moderate) | 158 (Unhealthy) | 125 (Unhealthy for Sensitive Groups) | 131 (Unhealthy for Sensitive Groups) | 114 (Moderate) | 139 (Unhealthy for Sensitive Groups) | 98 (Moderate) | 65 (Good) | 61 (Good) | 42 (Good) | 66 (Good) | 55 (Good) |
| pm10 | 51 (Unhealthy for Sensitive Groups) | 53 (Unhealthy for Sensitive Groups) | 60 (Unhealthy for Sensitive Groups) | 71 (Unhealthy for Sensitive Groups) | 76 (Unhealthy for Sensitive Groups) | 99 (Unhealthy) | 74 (Unhealthy for Sensitive Groups) | 44 (Moderate) | 41 (Moderate) | 41 (Moderate) | 33 (Moderate) | 42 (Moderate) | 54 (Unhealthy for Sensitive Groups) | 74 (Unhealthy for Sensitive Groups) | 85 (Unhealthy) | 88 (Unhealthy) | 117 (Very Unhealthy) | 82 (Unhealthy) | 61 (Unhealthy for Sensitive Groups) | 50 (Unhealthy for Sensitive Groups) |
| so2 | 9 (Good) | 9.9 (Good) | 7.9 (Good) | 6.6 (Good) | 6.4 (Good) | 6.6 (Good) | 4.9 (Good) | 9.7 (Good) | 8.4 (Good) | 7.3 (Good) | 5.9 (Good) | 8.1 (Good) | 9 (Good) | 15 (Good) | 15 (Good) | 13 (Good) | 15 (Good) | 11 (Good) | 15 (Good) | 15 (Good) |
PM2,5 61 (Unhealthy)
particulate matter (PM2.5) dustNO2 22 (Good)
nitrogen dioxide (NO2)PM10 69 (Unhealthy for Sensitive Groups)
particulate matter (PM10) suspended dustCO 219 (Good)
carbon monoxide (CO)O3 0.05 (Good)
ozone (O3)SO2 7.7 (Good)
sulfur dioxide (SO2)宜宾四中
| index | 2022-05-27 |
|---|---|
| pm25 | 28 |
| no2 | 22 |
| pm10 | 35 |
| co | 579 |
| o3 | 22 |
| so2 | 4.6 |
宜宾四中
| index | 2020-05 | 2020-04 | 2020-03 | 2020-02 | 2020-01 | 2019-12 | 2019-11 | 2019-10 | 2019-09 | 2019-08 | 2019-07 | 2019-06 | 2019-05 | 2019-04 | 2019-03 | 2019-02 | 2019-01 | 2018-12 | 2018-11 | 2018-10 |
|---|---|---|---|---|---|---|---|---|---|---|---|---|---|---|---|---|---|---|---|---|
| pm25 | 19 | 32 | 35 | 58 | 67 | 79 | 48 | 30 | 29 | 27 | 22 | 24 | 37 | 52 | 68 | 77 | 95 | 59 | 53 | 42 |
| no2 | 27 | 33 | 31 | 21 | 32 | 43 | 33 | 30 | 27 | 24 | 25 | 28 | 29 | 37 | 40 | 32 | 45 | 39 | 39 | 30 |
| o3 | 165 | 118 | 112 | 82 | 58 | 53 | 49 | 78 | 108 | 158 | 125 | 131 | 114 | 139 | 98 | 65 | 61 | 42 | 66 | 55 |
| pm10 | 51 | 53 | 60 | 71 | 76 | 99 | 74 | 44 | 41 | 41 | 33 | 42 | 54 | 74 | 85 | 88 | 117 | 82 | 61 | 50 |
| so2 | 9 | 9.9 | 7.9 | 6.6 | 6.4 | 6.6 | 4.9 | 9.7 | 8.4 | 7.3 | 5.9 | 8.1 | 9 | 15 | 15 | 13 | 15 | 11 | 15 | 15 |
| co | 740 | 703 | 650 | 740 | 1 | 882 | 698 | 745 | 757 | 657 | 710 | 808 | 721 | 728 | 737 | 947 | 1 | 971 | 798 | 876 |