Air Pollution in Fenghuang: Real-time Air Quality Index and smog alert.
Pollution and air quality forecast for Fenghuang. Today is Tuesday, June 16, 2026. The following air pollution values have been recorded for Fenghuang:- particulate matter (PM2.5) dust - 61 (Unhealthy)
- nitrogen dioxide (NO2) - 22 (Good)
- particulate matter (PM10) suspended dust - 69 (Unhealthy for Sensitive Groups)
- carbon monoxide (CO) - 219 (Good)
- ozone (O3) - 0 (Good)
- sulfur dioxide (SO2) - 8 (Good)

What is the air quality in Fenghuang today? Is the air polluted in Fenghuang?. Is there smog?
What is the current level of PM2.5 in Fenghuang? (particulate matter (PM2.5) dust)
Today's PM2.5 level is:
61 (Unhealthy)
For comparison, the highest level of PM2.5 in Fenghuang in the last 7 days was: 28 (Friday, May 27, 2022) and the lowest: 28 (Friday, May 27, 2022).
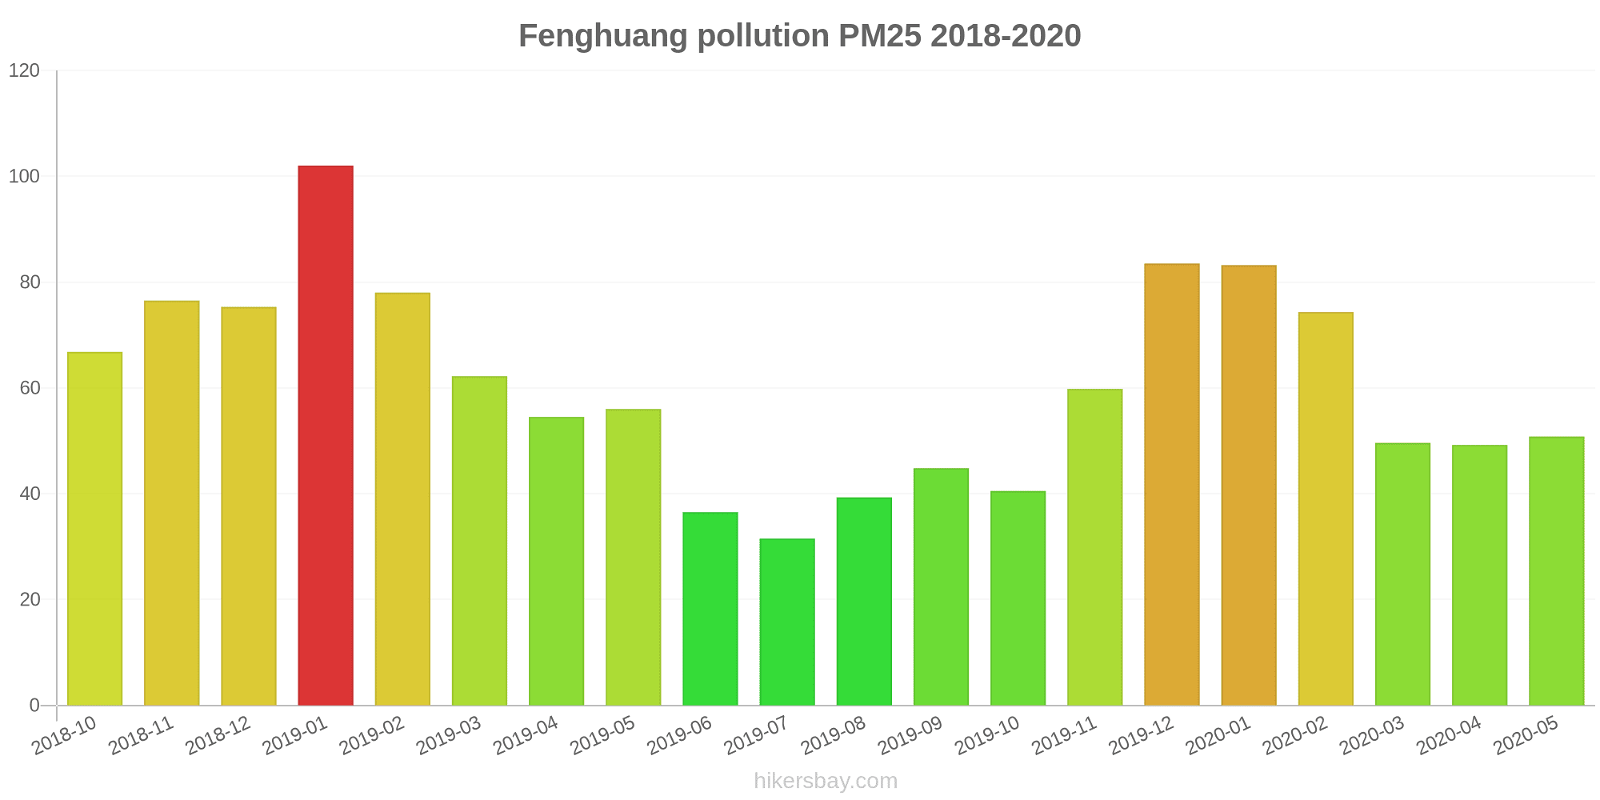
The highest PM2.5 values were recorded: 102 (January 2019).
The lowest level of particulate matter PM2.5 pollution occurs in month: July (32).
How high is the level of NO2? (nitrogen dioxide (NO2))
22 (Good)
What is the level of PM10 today in Fenghuang? (particulate matter (PM10) suspended dust)
The current level of particulate matter PM10 in Fenghuang is:
69 (Unhealthy for Sensitive Groups)
The highest PM10 values usually occur in month: 134 (January 2019).
The lowest value of particulate matter PM10 pollution in Fenghuang is usually recorded in: July (45).
How high is the CO level? (carbon monoxide (CO))
219 (Good)
How is the O3 level today in Fenghuang? (ozone (O3))
0 (Good)
What is the level of SO2 pollution? (sulfur dioxide (SO2))
8 (Good)
Current data Friday, May 27, 2022, 3:00 PM
PM2,5 61 (Unhealthy)
NO2 22 (Good)
PM10 69 (Unhealthy for Sensitive Groups)
CO 219 (Good)
O3 0 (Good)
SO2 8 (Good)
Data on air pollution from recent days in Fenghuang
index
2022-05-27
pm25
28
Moderate
no2
22
Good
pm10
35
Moderate
co
579
Good
o3
22
Good
so2
5
Good
data source »
Air pollution in Fenghuang from October 2018 to May 2020
index
2020-05
2020-04
2020-03
2020-02
2020-01
2019-12
2019-11
2019-10
2019-09
2019-08
2019-07
2019-06
2019-05
2019-04
2019-03
2019-02
2019-01
2018-12
2018-11
2018-10
pm25
51 (Unhealthy for Sensitive Groups)
49 (Unhealthy for Sensitive Groups)
50 (Unhealthy for Sensitive Groups)
74 (Unhealthy)
83 (Very Unhealthy)
84 (Very Unhealthy)
60 (Unhealthy)
41 (Unhealthy for Sensitive Groups)
45 (Unhealthy for Sensitive Groups)
39 (Unhealthy for Sensitive Groups)
32 (Moderate)
37 (Unhealthy for Sensitive Groups)
56 (Unhealthy)
55 (Unhealthy for Sensitive Groups)
62 (Unhealthy)
78 (Very Unhealthy)
102 (Very Unhealthy)
75 (Very Unhealthy)
77 (Very Unhealthy)
67 (Unhealthy)
co
582 (Good)
663 (Good)
577 (Good)
766 (Good)
1 (Good)
822 (Good)
573 (Good)
558 (Good)
607 (Good)
498 (Good)
605 (Good)
547 (Good)
621 (Good)
746 (Good)
786 (Good)
1 (Good)
1 (Good)
842 (Good)
753 (Good)
836 (Good)
no2
30 (Good)
30 (Good)
21 (Good)
13 (Good)
26 (Good)
40 (Good)
29 (Good)
23 (Good)
25 (Good)
22 (Good)
19 (Good)
20 (Good)
19 (Good)
23 (Good)
21 (Good)
18 (Good)
34 (Good)
32 (Good)
29 (Good)
28 (Good)
o3
173 (Unhealthy)
122 (Unhealthy for Sensitive Groups)
115 (Moderate)
83 (Moderate)
61 (Good)
58 (Good)
56 (Good)
92 (Moderate)
126 (Unhealthy for Sensitive Groups)
161 (Unhealthy)
116 (Moderate)
135 (Unhealthy for Sensitive Groups)
122 (Unhealthy for Sensitive Groups)
146 (Unhealthy for Sensitive Groups)
80 (Moderate)
70 (Moderate)
56 (Good)
49 (Good)
72 (Moderate)
71 (Moderate)
pm10
79 (Unhealthy for Sensitive Groups)
72 (Unhealthy for Sensitive Groups)
77 (Unhealthy for Sensitive Groups)
93 (Unhealthy)
102 (Unhealthy)
108 (Unhealthy)
83 (Unhealthy)
57 (Unhealthy for Sensitive Groups)
65 (Unhealthy for Sensitive Groups)
61 (Unhealthy for Sensitive Groups)
45 (Moderate)
54 (Unhealthy for Sensitive Groups)
77 (Unhealthy for Sensitive Groups)
82 (Unhealthy)
92 (Unhealthy)
104 (Unhealthy)
134 (Very Unhealthy)
106 (Unhealthy)
104 (Unhealthy)
91 (Unhealthy)
so2
9.7 (Good)
6.2 (Good)
6.5 (Good)
4.2 (Good)
6 (Good)
8.4 (Good)
6 (Good)
5.3 (Good)
7.6 (Good)
6.7 (Good)
6.2 (Good)
7.6 (Good)
7.2 (Good)
9.1 (Good)
8.9 (Good)
9 (Good)
13 (Good)
11 (Good)
8.7 (Good)
6.2 (Good)
data source »
大塘山
Friday, May 27, 2022, 3:00 PM
PM2,5 61 (Unhealthy)
particulate matter (PM2.5) dust
NO2 22 (Good)
nitrogen dioxide (NO2)
PM10 69 (Unhealthy for Sensitive Groups)
particulate matter (PM10) suspended dust
CO 219 (Good)
carbon monoxide (CO)
O3 0.05 (Good)
ozone (O3)
SO2 7.7 (Good)
sulfur dioxide (SO2)
大塘山
index
2022-05-27
pm25
28
no2
22
pm10
35
co
579
o3
22
so2
4.6
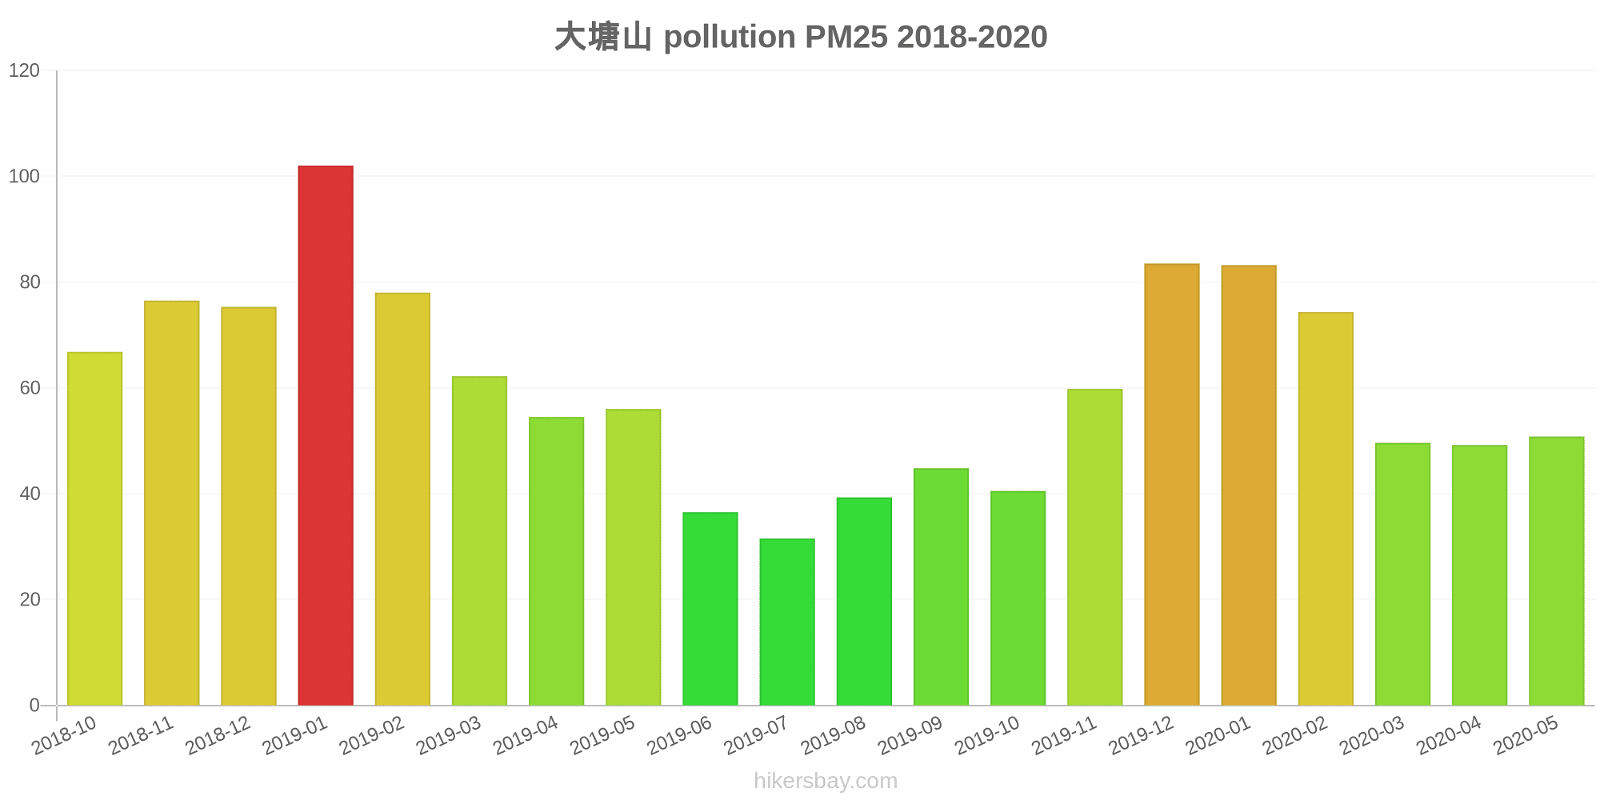
大塘山
2018-10 2020-05
index
2020-05
2020-04
2020-03
2020-02
2020-01
2019-12
2019-11
2019-10
2019-09
2019-08
2019-07
2019-06
2019-05
2019-04
2019-03
2019-02
2019-01
2018-12
2018-11
2018-10
pm25
51
49
50
74
83
84
60
41
45
39
32
37
56
55
62
78
102
75
77
67
co
582
663
577
766
1
822
573
558
607
498
605
547
621
746
786
1
1
842
753
836
no2
30
30
21
13
26
40
29
23
25
22
19
20
19
23
21
18
34
32
29
28
o3
173
122
115
83
61
58
56
92
126
161
116
135
122
146
80
70
56
49
72
71
pm10
79
72
77
93
102
108
83
57
65
61
45
54
77
82
92
104
134
106
104
91
so2
9.7
6.2
6.5
4.2
6
8.4
6
5.3
7.6
6.7
6.2
7.6
7.2
9.1
8.9
9
13
11
8.7
6.2
* Pollution data source:
https://openaq.org
(ChinaAQIData)
The data is licensed under CC-By 4.0
PM2,5 61 (Unhealthy)
NO2 22 (Good)
PM10 69 (Unhealthy for Sensitive Groups)
CO 219 (Good)
O3 0 (Good)
SO2 8 (Good)
Data on air pollution from recent days in Fenghuang
| index | 2022-05-27 |
|---|---|
| pm25 | 28 Moderate |
| no2 | 22 Good |
| pm10 | 35 Moderate |
| co | 579 Good |
| o3 | 22 Good |
| so2 | 5 Good |

| index | 2020-05 | 2020-04 | 2020-03 | 2020-02 | 2020-01 | 2019-12 | 2019-11 | 2019-10 | 2019-09 | 2019-08 | 2019-07 | 2019-06 | 2019-05 | 2019-04 | 2019-03 | 2019-02 | 2019-01 | 2018-12 | 2018-11 | 2018-10 |
|---|---|---|---|---|---|---|---|---|---|---|---|---|---|---|---|---|---|---|---|---|
| pm25 | 51 (Unhealthy for Sensitive Groups) | 49 (Unhealthy for Sensitive Groups) | 50 (Unhealthy for Sensitive Groups) | 74 (Unhealthy) | 83 (Very Unhealthy) | 84 (Very Unhealthy) | 60 (Unhealthy) | 41 (Unhealthy for Sensitive Groups) | 45 (Unhealthy for Sensitive Groups) | 39 (Unhealthy for Sensitive Groups) | 32 (Moderate) | 37 (Unhealthy for Sensitive Groups) | 56 (Unhealthy) | 55 (Unhealthy for Sensitive Groups) | 62 (Unhealthy) | 78 (Very Unhealthy) | 102 (Very Unhealthy) | 75 (Very Unhealthy) | 77 (Very Unhealthy) | 67 (Unhealthy) |
| co | 582 (Good) | 663 (Good) | 577 (Good) | 766 (Good) | 1 (Good) | 822 (Good) | 573 (Good) | 558 (Good) | 607 (Good) | 498 (Good) | 605 (Good) | 547 (Good) | 621 (Good) | 746 (Good) | 786 (Good) | 1 (Good) | 1 (Good) | 842 (Good) | 753 (Good) | 836 (Good) |
| no2 | 30 (Good) | 30 (Good) | 21 (Good) | 13 (Good) | 26 (Good) | 40 (Good) | 29 (Good) | 23 (Good) | 25 (Good) | 22 (Good) | 19 (Good) | 20 (Good) | 19 (Good) | 23 (Good) | 21 (Good) | 18 (Good) | 34 (Good) | 32 (Good) | 29 (Good) | 28 (Good) |
| o3 | 173 (Unhealthy) | 122 (Unhealthy for Sensitive Groups) | 115 (Moderate) | 83 (Moderate) | 61 (Good) | 58 (Good) | 56 (Good) | 92 (Moderate) | 126 (Unhealthy for Sensitive Groups) | 161 (Unhealthy) | 116 (Moderate) | 135 (Unhealthy for Sensitive Groups) | 122 (Unhealthy for Sensitive Groups) | 146 (Unhealthy for Sensitive Groups) | 80 (Moderate) | 70 (Moderate) | 56 (Good) | 49 (Good) | 72 (Moderate) | 71 (Moderate) |
| pm10 | 79 (Unhealthy for Sensitive Groups) | 72 (Unhealthy for Sensitive Groups) | 77 (Unhealthy for Sensitive Groups) | 93 (Unhealthy) | 102 (Unhealthy) | 108 (Unhealthy) | 83 (Unhealthy) | 57 (Unhealthy for Sensitive Groups) | 65 (Unhealthy for Sensitive Groups) | 61 (Unhealthy for Sensitive Groups) | 45 (Moderate) | 54 (Unhealthy for Sensitive Groups) | 77 (Unhealthy for Sensitive Groups) | 82 (Unhealthy) | 92 (Unhealthy) | 104 (Unhealthy) | 134 (Very Unhealthy) | 106 (Unhealthy) | 104 (Unhealthy) | 91 (Unhealthy) |
| so2 | 9.7 (Good) | 6.2 (Good) | 6.5 (Good) | 4.2 (Good) | 6 (Good) | 8.4 (Good) | 6 (Good) | 5.3 (Good) | 7.6 (Good) | 6.7 (Good) | 6.2 (Good) | 7.6 (Good) | 7.2 (Good) | 9.1 (Good) | 8.9 (Good) | 9 (Good) | 13 (Good) | 11 (Good) | 8.7 (Good) | 6.2 (Good) |
PM2,5 61 (Unhealthy)
particulate matter (PM2.5) dustNO2 22 (Good)
nitrogen dioxide (NO2)PM10 69 (Unhealthy for Sensitive Groups)
particulate matter (PM10) suspended dustCO 219 (Good)
carbon monoxide (CO)O3 0.05 (Good)
ozone (O3)SO2 7.7 (Good)
sulfur dioxide (SO2)大塘山
| index | 2022-05-27 |
|---|---|
| pm25 | 28 |
| no2 | 22 |
| pm10 | 35 |
| co | 579 |
| o3 | 22 |
| so2 | 4.6 |
大塘山

| index | 2020-05 | 2020-04 | 2020-03 | 2020-02 | 2020-01 | 2019-12 | 2019-11 | 2019-10 | 2019-09 | 2019-08 | 2019-07 | 2019-06 | 2019-05 | 2019-04 | 2019-03 | 2019-02 | 2019-01 | 2018-12 | 2018-11 | 2018-10 |
|---|---|---|---|---|---|---|---|---|---|---|---|---|---|---|---|---|---|---|---|---|
| pm25 | 51 | 49 | 50 | 74 | 83 | 84 | 60 | 41 | 45 | 39 | 32 | 37 | 56 | 55 | 62 | 78 | 102 | 75 | 77 | 67 |
| co | 582 | 663 | 577 | 766 | 1 | 822 | 573 | 558 | 607 | 498 | 605 | 547 | 621 | 746 | 786 | 1 | 1 | 842 | 753 | 836 |
| no2 | 30 | 30 | 21 | 13 | 26 | 40 | 29 | 23 | 25 | 22 | 19 | 20 | 19 | 23 | 21 | 18 | 34 | 32 | 29 | 28 |
| o3 | 173 | 122 | 115 | 83 | 61 | 58 | 56 | 92 | 126 | 161 | 116 | 135 | 122 | 146 | 80 | 70 | 56 | 49 | 72 | 71 |
| pm10 | 79 | 72 | 77 | 93 | 102 | 108 | 83 | 57 | 65 | 61 | 45 | 54 | 77 | 82 | 92 | 104 | 134 | 106 | 104 | 91 |
| so2 | 9.7 | 6.2 | 6.5 | 4.2 | 6 | 8.4 | 6 | 5.3 | 7.6 | 6.7 | 6.2 | 7.6 | 7.2 | 9.1 | 8.9 | 9 | 13 | 11 | 8.7 | 6.2 |