Air Pollution in Jiaotong: Real-time Air Quality Index and smog alert.
Pollution and air quality forecast for Jiaotong. Today is Tuesday, June 16, 2026. The following air pollution values have been recorded for Jiaotong:- particulate matter (PM2.5) dust - 61 (Unhealthy)
- nitrogen dioxide (NO2) - 22 (Good)
- particulate matter (PM10) suspended dust - 69 (Unhealthy for Sensitive Groups)
- carbon monoxide (CO) - 219 (Good)
- ozone (O3) - 0 (Good)
- sulfur dioxide (SO2) - 8 (Good)

What is the air quality in Jiaotong today? Is the air polluted in Jiaotong?. Is there smog?
What is the current level of PM2.5 in Jiaotong? (particulate matter (PM2.5) dust)
Today's PM2.5 level is:
61 (Unhealthy)
For comparison, the highest level of PM2.5 in Jiaotong in the last 7 days was: 28 (Friday, May 27, 2022) and the lowest: 28 (Friday, May 27, 2022).
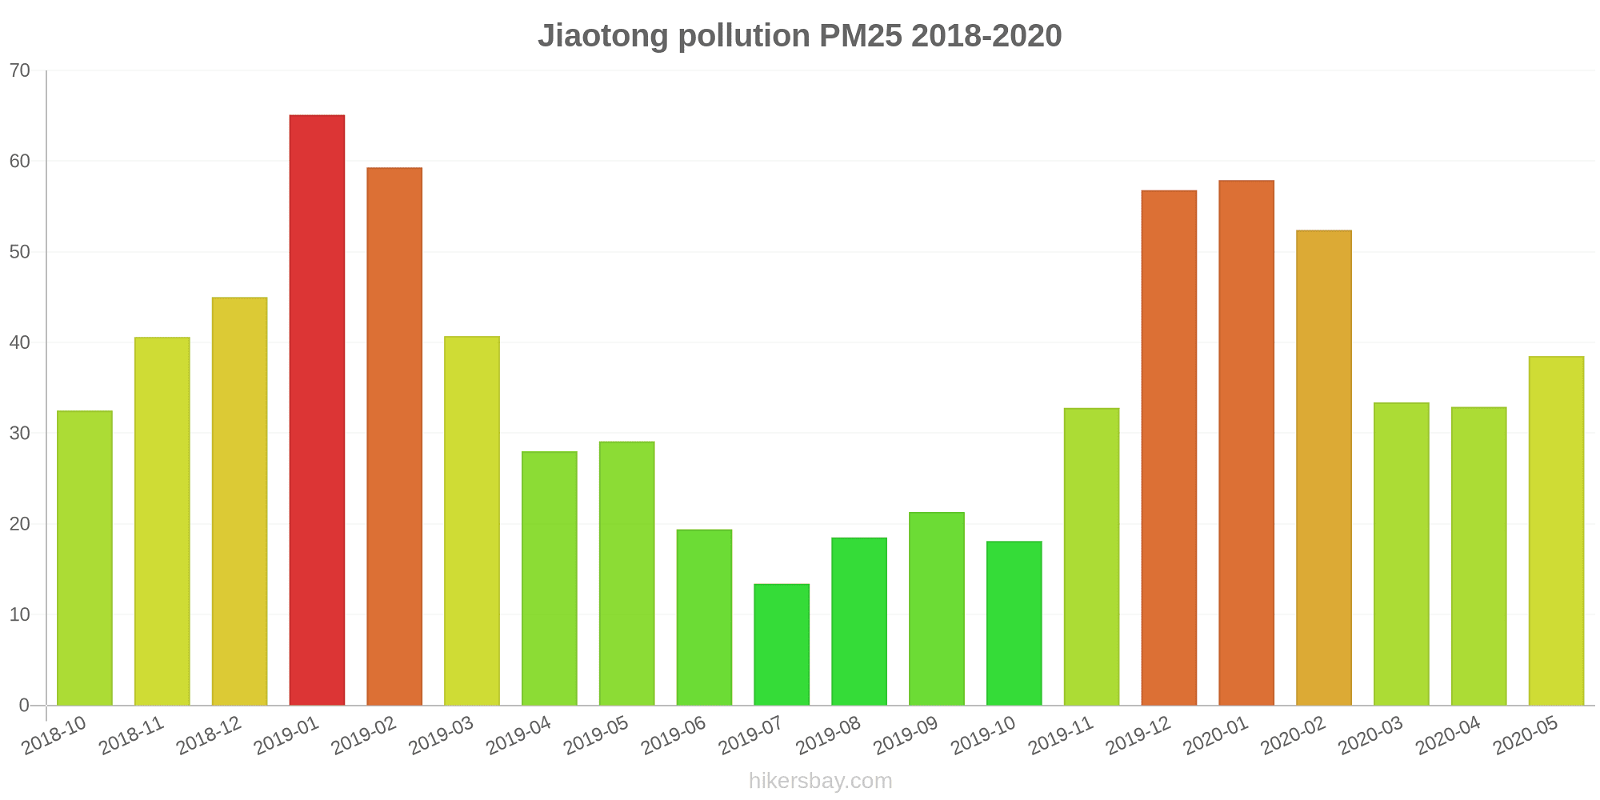
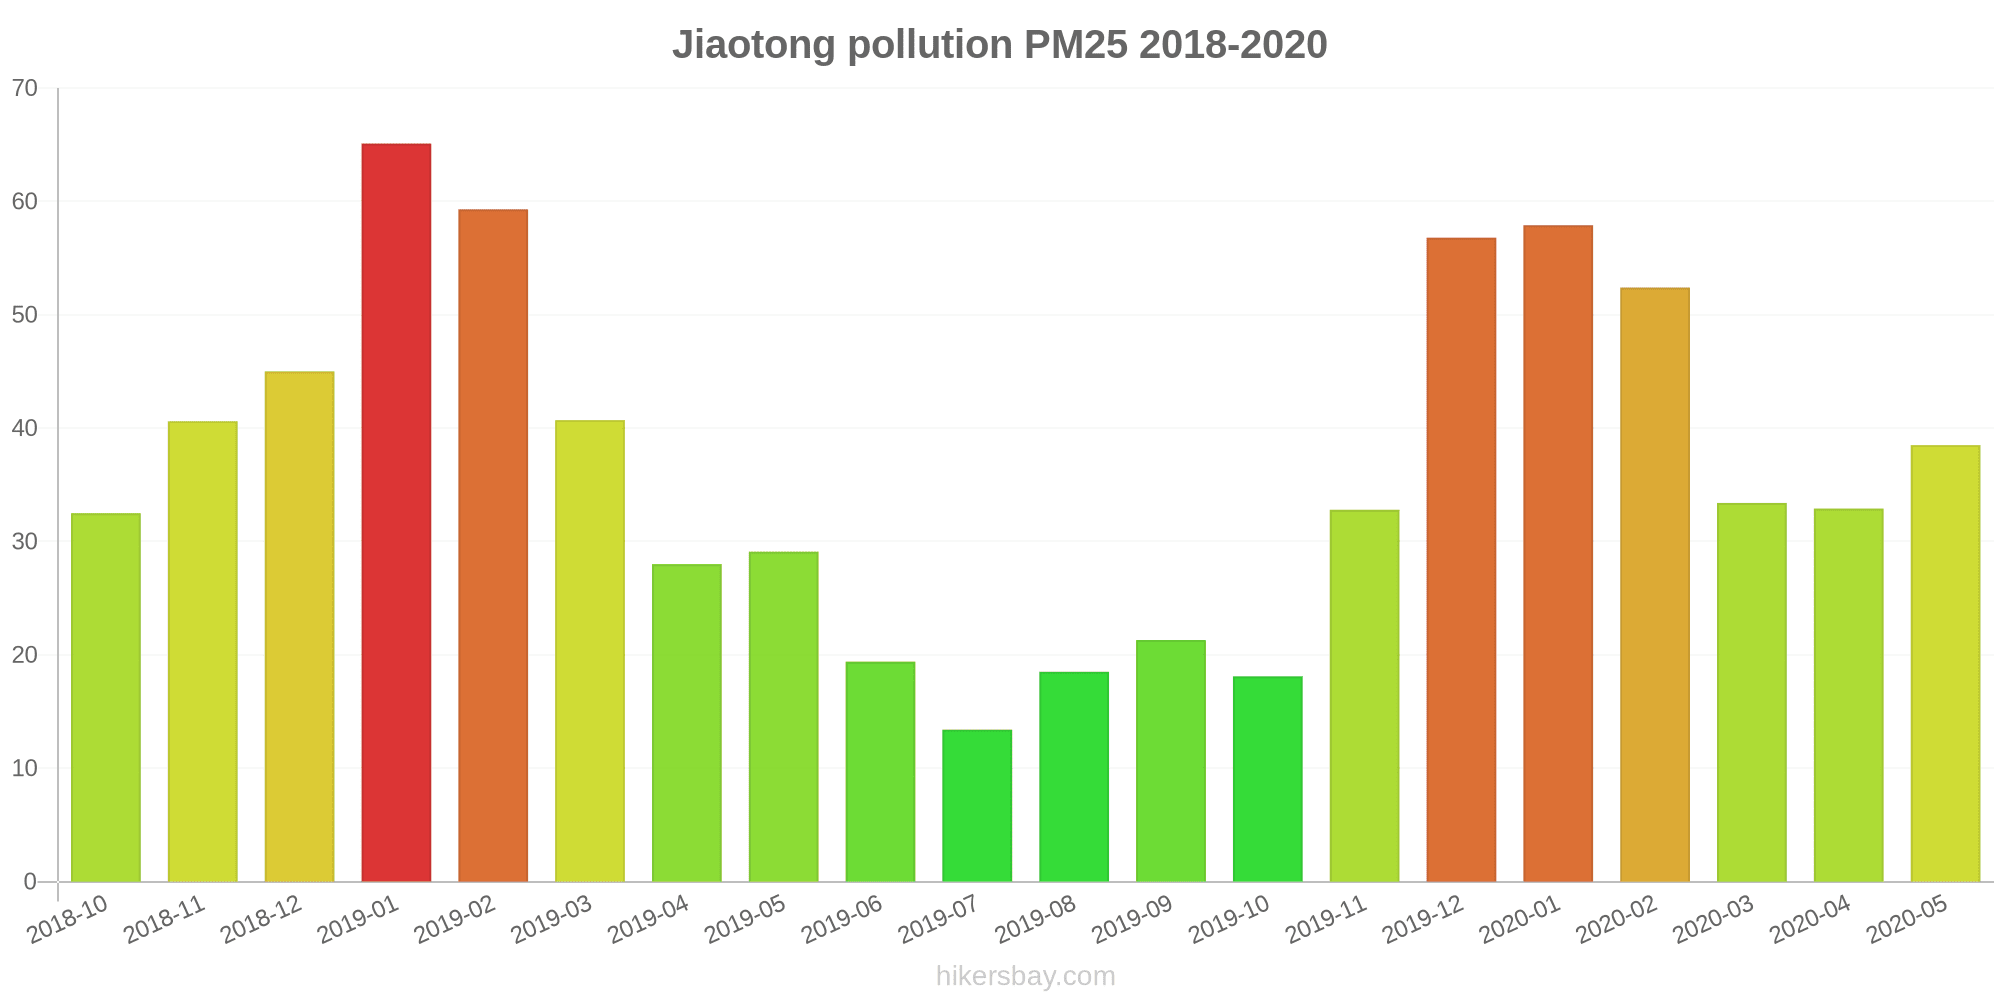
The highest PM2.5 values were recorded: 65 (January 2019).
The lowest level of particulate matter PM2.5 pollution occurs in month: July (13).
How high is the level of NO2? (nitrogen dioxide (NO2))
22 (Good)
What is the level of PM10 today in Jiaotong? (particulate matter (PM10) suspended dust)
The current level of particulate matter PM10 in Jiaotong is:
69 (Unhealthy for Sensitive Groups)
The highest PM10 values usually occur in month: 93 (January 2019).
The lowest value of particulate matter PM10 pollution in Jiaotong is usually recorded in: October (28).
How high is the CO level? (carbon monoxide (CO))
219 (Good)
How is the O3 level today in Jiaotong? (ozone (O3))
0 (Good)
What is the level of SO2 pollution? (sulfur dioxide (SO2))
8 (Good)
Current data Friday, May 27, 2022, 3:00 PM
PM2,5 61 (Unhealthy)
NO2 22 (Good)
PM10 69 (Unhealthy for Sensitive Groups)
CO 219 (Good)
O3 0 (Good)
SO2 8 (Good)
Data on air pollution from recent days in Jiaotong
index
2022-05-27
pm25
28
Moderate
no2
22
Good
pm10
35
Moderate
co
579
Good
o3
22
Good
so2
5
Good
data source »
Air pollution in Jiaotong from October 2018 to May 2020
index
2020-05
2020-04
2020-03
2020-02
2020-01
2019-12
2019-11
2019-10
2019-09
2019-08
2019-07
2019-06
2019-05
2019-04
2019-03
2019-02
2019-01
2018-12
2018-11
2018-10
pm25
39 (Unhealthy for Sensitive Groups)
33 (Moderate)
33 (Moderate)
52 (Unhealthy for Sensitive Groups)
58 (Unhealthy)
57 (Unhealthy)
33 (Moderate)
18 (Moderate)
21 (Moderate)
19 (Moderate)
13 (Moderate)
19 (Moderate)
29 (Moderate)
28 (Moderate)
41 (Unhealthy for Sensitive Groups)
59 (Unhealthy)
65 (Unhealthy)
45 (Unhealthy for Sensitive Groups)
41 (Unhealthy for Sensitive Groups)
33 (Moderate)
co
687 (Good)
688 (Good)
613 (Good)
698 (Good)
1 (Good)
830 (Good)
554 (Good)
530 (Good)
588 (Good)
566 (Good)
505 (Good)
471 (Good)
363 (Good)
598 (Good)
690 (Good)
886 (Good)
983 (Good)
963 (Good)
859 (Good)
979 (Good)
no2
29 (Good)
27 (Good)
26 (Good)
25 (Good)
34 (Good)
41 (Moderate)
33 (Good)
23 (Good)
26 (Good)
26 (Good)
23 (Good)
27 (Good)
26 (Good)
27 (Good)
29 (Good)
25 (Good)
37 (Good)
27 (Good)
27 (Good)
30 (Good)
o3
177 (Unhealthy)
116 (Moderate)
114 (Moderate)
83 (Moderate)
68 (Good)
53 (Good)
56 (Good)
83 (Moderate)
115 (Moderate)
159 (Unhealthy)
116 (Moderate)
120 (Unhealthy for Sensitive Groups)
110 (Moderate)
135 (Unhealthy for Sensitive Groups)
93 (Moderate)
71 (Moderate)
62 (Good)
44 (Good)
77 (Moderate)
71 (Moderate)
pm10
66 (Unhealthy for Sensitive Groups)
54 (Unhealthy for Sensitive Groups)
59 (Unhealthy for Sensitive Groups)
70 (Unhealthy for Sensitive Groups)
77 (Unhealthy for Sensitive Groups)
81 (Unhealthy)
54 (Unhealthy for Sensitive Groups)
28 (Moderate)
35 (Moderate)
42 (Moderate)
29 (Moderate)
37 (Moderate)
53 (Unhealthy for Sensitive Groups)
50 (Moderate)
60 (Unhealthy for Sensitive Groups)
70 (Unhealthy for Sensitive Groups)
93 (Unhealthy)
71 (Unhealthy for Sensitive Groups)
61 (Unhealthy for Sensitive Groups)
52 (Unhealthy for Sensitive Groups)
so2
8.6 (Good)
6.1 (Good)
6.4 (Good)
6 (Good)
9.4 (Good)
6.1 (Good)
5.2 (Good)
5.8 (Good)
6.1 (Good)
11 (Good)
8.7 (Good)
7.9 (Good)
7 (Good)
6.5 (Good)
9.2 (Good)
6.2 (Good)
6.2 (Good)
4.7 (Good)
5.1 (Good)
3.3 (Good)
data source »
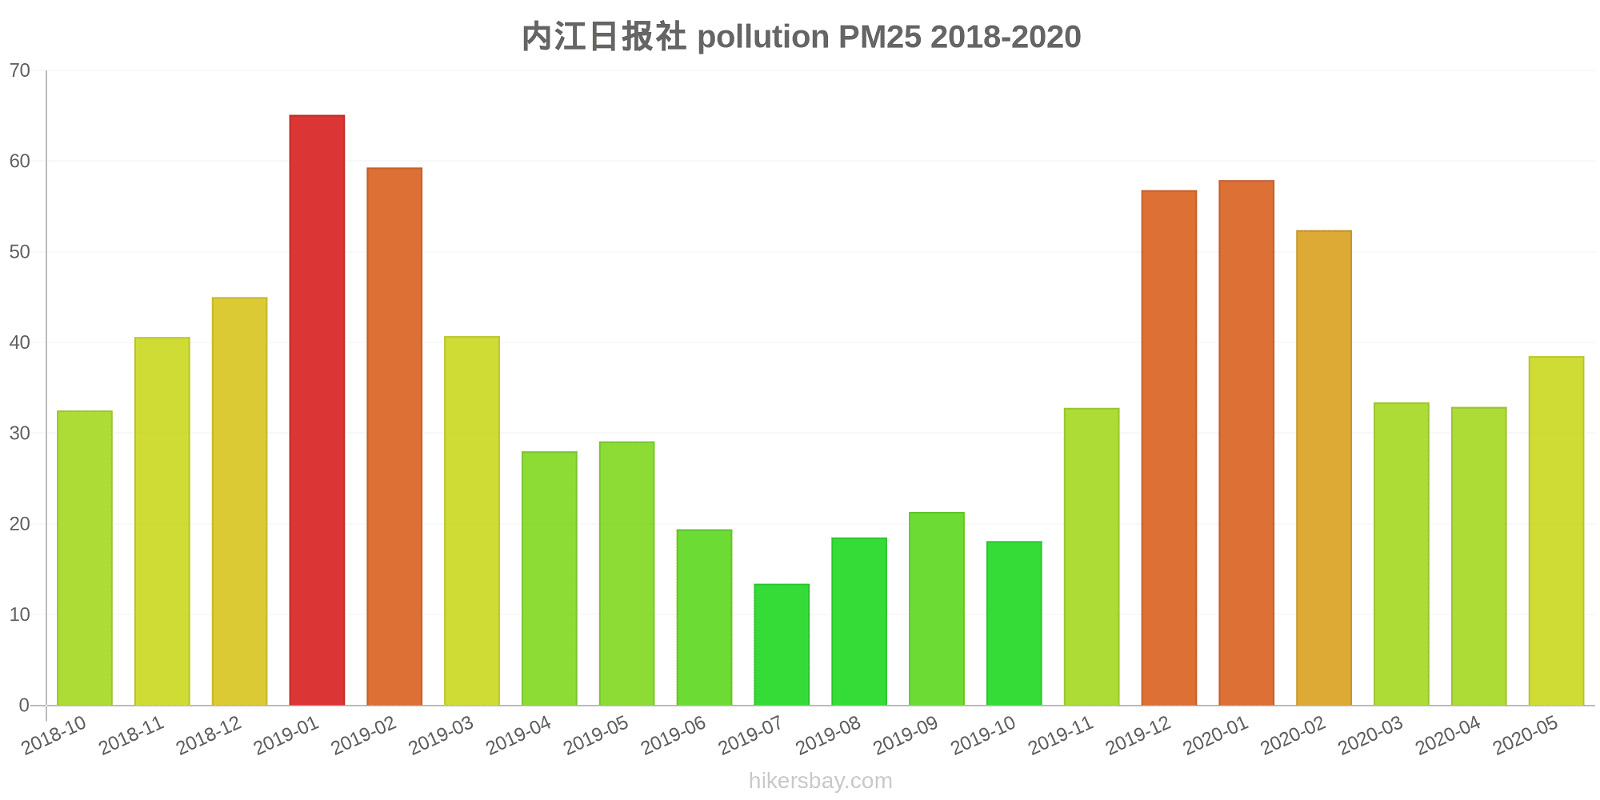
内江日报社
Friday, May 27, 2022, 3:00 PM
PM2,5 61 (Unhealthy)
particulate matter (PM2.5) dust
NO2 22 (Good)
nitrogen dioxide (NO2)
PM10 69 (Unhealthy for Sensitive Groups)
particulate matter (PM10) suspended dust
CO 219 (Good)
carbon monoxide (CO)
O3 0.05 (Good)
ozone (O3)
SO2 7.7 (Good)
sulfur dioxide (SO2)
内江日报社
index
2022-05-27
pm25
28
no2
22
pm10
35
co
579
o3
22
so2
4.6
内江日报社
2018-10 2020-05
index
2020-05
2020-04
2020-03
2020-02
2020-01
2019-12
2019-11
2019-10
2019-09
2019-08
2019-07
2019-06
2019-05
2019-04
2019-03
2019-02
2019-01
2018-12
2018-11
2018-10
pm25
39
33
33
52
58
57
33
18
21
19
13
19
29
28
41
59
65
45
41
33
co
687
688
613
698
1
830
554
530
588
566
505
471
363
598
690
886
983
963
859
979
no2
29
27
26
25
34
41
33
23
26
26
23
27
26
27
29
25
37
27
27
30
o3
177
116
114
83
68
53
56
83
115
159
116
120
110
135
93
71
62
44
77
71
pm10
66
54
59
70
77
81
54
28
35
42
29
37
53
50
60
70
93
71
61
52
so2
8.6
6.1
6.4
6
9.4
6.1
5.2
5.8
6.1
11
8.7
7.9
7
6.5
9.2
6.2
6.2
4.7
5.1
3.3
* Pollution data source:
https://openaq.org
(ChinaAQIData)
The data is licensed under CC-By 4.0
PM2,5 61 (Unhealthy)
NO2 22 (Good)
PM10 69 (Unhealthy for Sensitive Groups)
CO 219 (Good)
O3 0 (Good)
SO2 8 (Good)
Data on air pollution from recent days in Jiaotong
| index | 2022-05-27 |
|---|---|
| pm25 | 28 Moderate |
| no2 | 22 Good |
| pm10 | 35 Moderate |
| co | 579 Good |
| o3 | 22 Good |
| so2 | 5 Good |
| index | 2020-05 | 2020-04 | 2020-03 | 2020-02 | 2020-01 | 2019-12 | 2019-11 | 2019-10 | 2019-09 | 2019-08 | 2019-07 | 2019-06 | 2019-05 | 2019-04 | 2019-03 | 2019-02 | 2019-01 | 2018-12 | 2018-11 | 2018-10 |
|---|---|---|---|---|---|---|---|---|---|---|---|---|---|---|---|---|---|---|---|---|
| pm25 | 39 (Unhealthy for Sensitive Groups) | 33 (Moderate) | 33 (Moderate) | 52 (Unhealthy for Sensitive Groups) | 58 (Unhealthy) | 57 (Unhealthy) | 33 (Moderate) | 18 (Moderate) | 21 (Moderate) | 19 (Moderate) | 13 (Moderate) | 19 (Moderate) | 29 (Moderate) | 28 (Moderate) | 41 (Unhealthy for Sensitive Groups) | 59 (Unhealthy) | 65 (Unhealthy) | 45 (Unhealthy for Sensitive Groups) | 41 (Unhealthy for Sensitive Groups) | 33 (Moderate) |
| co | 687 (Good) | 688 (Good) | 613 (Good) | 698 (Good) | 1 (Good) | 830 (Good) | 554 (Good) | 530 (Good) | 588 (Good) | 566 (Good) | 505 (Good) | 471 (Good) | 363 (Good) | 598 (Good) | 690 (Good) | 886 (Good) | 983 (Good) | 963 (Good) | 859 (Good) | 979 (Good) |
| no2 | 29 (Good) | 27 (Good) | 26 (Good) | 25 (Good) | 34 (Good) | 41 (Moderate) | 33 (Good) | 23 (Good) | 26 (Good) | 26 (Good) | 23 (Good) | 27 (Good) | 26 (Good) | 27 (Good) | 29 (Good) | 25 (Good) | 37 (Good) | 27 (Good) | 27 (Good) | 30 (Good) |
| o3 | 177 (Unhealthy) | 116 (Moderate) | 114 (Moderate) | 83 (Moderate) | 68 (Good) | 53 (Good) | 56 (Good) | 83 (Moderate) | 115 (Moderate) | 159 (Unhealthy) | 116 (Moderate) | 120 (Unhealthy for Sensitive Groups) | 110 (Moderate) | 135 (Unhealthy for Sensitive Groups) | 93 (Moderate) | 71 (Moderate) | 62 (Good) | 44 (Good) | 77 (Moderate) | 71 (Moderate) |
| pm10 | 66 (Unhealthy for Sensitive Groups) | 54 (Unhealthy for Sensitive Groups) | 59 (Unhealthy for Sensitive Groups) | 70 (Unhealthy for Sensitive Groups) | 77 (Unhealthy for Sensitive Groups) | 81 (Unhealthy) | 54 (Unhealthy for Sensitive Groups) | 28 (Moderate) | 35 (Moderate) | 42 (Moderate) | 29 (Moderate) | 37 (Moderate) | 53 (Unhealthy for Sensitive Groups) | 50 (Moderate) | 60 (Unhealthy for Sensitive Groups) | 70 (Unhealthy for Sensitive Groups) | 93 (Unhealthy) | 71 (Unhealthy for Sensitive Groups) | 61 (Unhealthy for Sensitive Groups) | 52 (Unhealthy for Sensitive Groups) |
| so2 | 8.6 (Good) | 6.1 (Good) | 6.4 (Good) | 6 (Good) | 9.4 (Good) | 6.1 (Good) | 5.2 (Good) | 5.8 (Good) | 6.1 (Good) | 11 (Good) | 8.7 (Good) | 7.9 (Good) | 7 (Good) | 6.5 (Good) | 9.2 (Good) | 6.2 (Good) | 6.2 (Good) | 4.7 (Good) | 5.1 (Good) | 3.3 (Good) |
PM2,5 61 (Unhealthy)
particulate matter (PM2.5) dustNO2 22 (Good)
nitrogen dioxide (NO2)PM10 69 (Unhealthy for Sensitive Groups)
particulate matter (PM10) suspended dustCO 219 (Good)
carbon monoxide (CO)O3 0.05 (Good)
ozone (O3)SO2 7.7 (Good)
sulfur dioxide (SO2)内江日报社
| index | 2022-05-27 |
|---|---|
| pm25 | 28 |
| no2 | 22 |
| pm10 | 35 |
| co | 579 |
| o3 | 22 |
| so2 | 4.6 |
内江日报社

| index | 2020-05 | 2020-04 | 2020-03 | 2020-02 | 2020-01 | 2019-12 | 2019-11 | 2019-10 | 2019-09 | 2019-08 | 2019-07 | 2019-06 | 2019-05 | 2019-04 | 2019-03 | 2019-02 | 2019-01 | 2018-12 | 2018-11 | 2018-10 |
|---|---|---|---|---|---|---|---|---|---|---|---|---|---|---|---|---|---|---|---|---|
| pm25 | 39 | 33 | 33 | 52 | 58 | 57 | 33 | 18 | 21 | 19 | 13 | 19 | 29 | 28 | 41 | 59 | 65 | 45 | 41 | 33 |
| co | 687 | 688 | 613 | 698 | 1 | 830 | 554 | 530 | 588 | 566 | 505 | 471 | 363 | 598 | 690 | 886 | 983 | 963 | 859 | 979 |
| no2 | 29 | 27 | 26 | 25 | 34 | 41 | 33 | 23 | 26 | 26 | 23 | 27 | 26 | 27 | 29 | 25 | 37 | 27 | 27 | 30 |
| o3 | 177 | 116 | 114 | 83 | 68 | 53 | 56 | 83 | 115 | 159 | 116 | 120 | 110 | 135 | 93 | 71 | 62 | 44 | 77 | 71 |
| pm10 | 66 | 54 | 59 | 70 | 77 | 81 | 54 | 28 | 35 | 42 | 29 | 37 | 53 | 50 | 60 | 70 | 93 | 71 | 61 | 52 |
| so2 | 8.6 | 6.1 | 6.4 | 6 | 9.4 | 6.1 | 5.2 | 5.8 | 6.1 | 11 | 8.7 | 7.9 | 7 | 6.5 | 9.2 | 6.2 | 6.2 | 4.7 | 5.1 | 3.3 |