Air Pollution in Niunaichang: Real-time Air Quality Index and smog alert.
Pollution and air quality forecast for Niunaichang. Today is Tuesday, June 16, 2026. The following air pollution values have been recorded for Niunaichang:- particulate matter (PM2.5) dust - 61 (Unhealthy)
- nitrogen dioxide (NO2) - 22 (Good)
- particulate matter (PM10) suspended dust - 69 (Unhealthy for Sensitive Groups)
- carbon monoxide (CO) - 219 (Good)
- ozone (O3) - 0 (Good)
- sulfur dioxide (SO2) - 8 (Good)

What is the air quality in Niunaichang today? Is the air polluted in Niunaichang?. Is there smog?
What is the current level of PM2.5 in Niunaichang? (particulate matter (PM2.5) dust)
Today's PM2.5 level is:
61 (Unhealthy)
For comparison, the highest level of PM2.5 in Niunaichang in the last 7 days was: 28 (Friday, May 27, 2022) and the lowest: 28 (Friday, May 27, 2022).
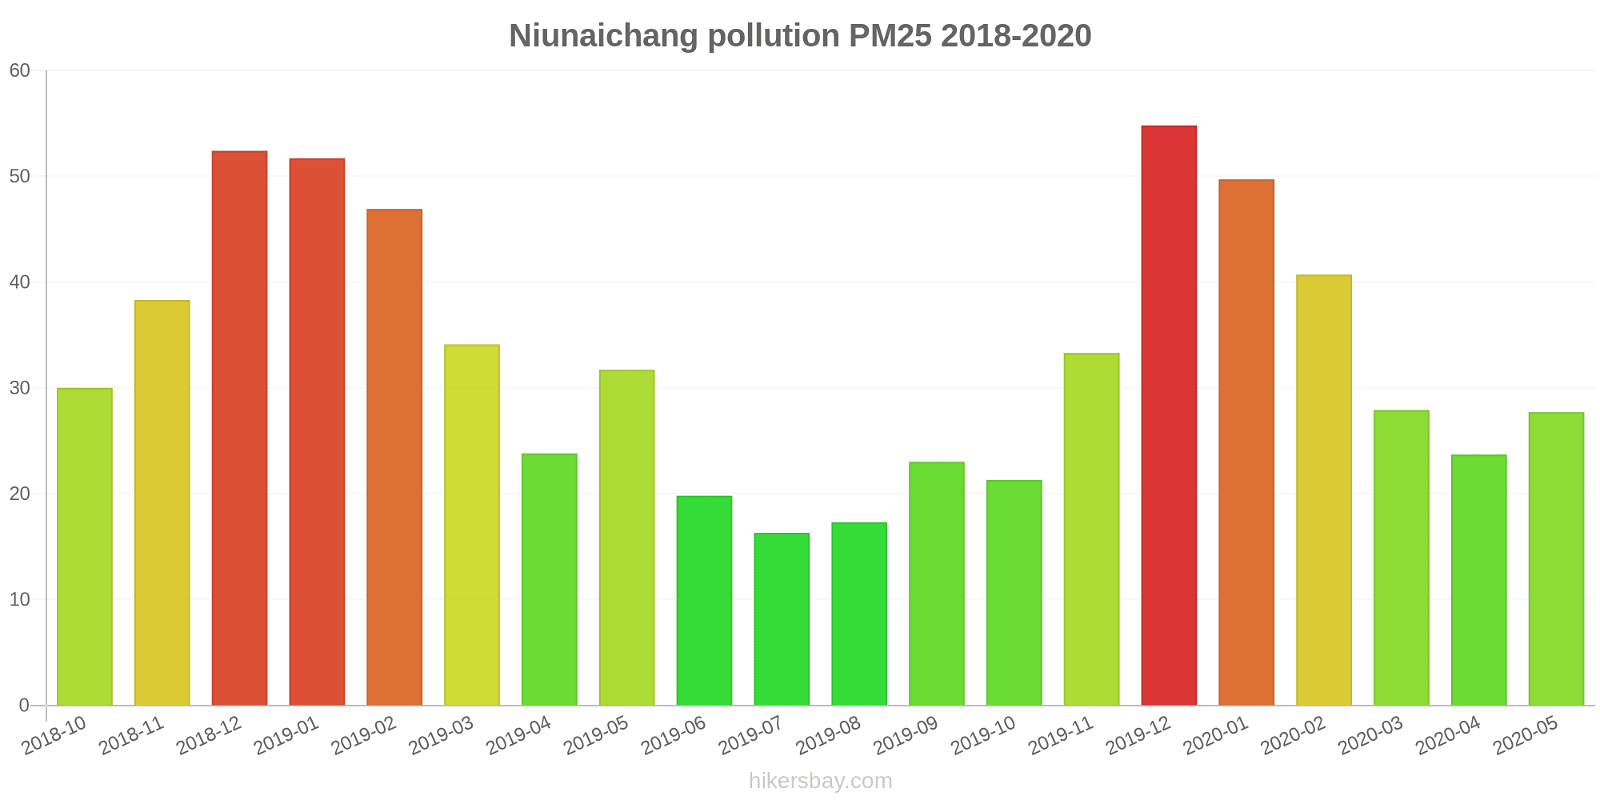
The highest PM2.5 values were recorded: 55 (December 2019).
The lowest level of particulate matter PM2.5 pollution occurs in month: July (16).
How high is the level of NO2? (nitrogen dioxide (NO2))
22 (Good)
What is the level of PM10 today in Niunaichang? (particulate matter (PM10) suspended dust)
The current level of particulate matter PM10 in Niunaichang is:
69 (Unhealthy for Sensitive Groups)
The highest PM10 values usually occur in month: 105 (December 2018).
The lowest value of particulate matter PM10 pollution in Niunaichang is usually recorded in: July (33).
How high is the CO level? (carbon monoxide (CO))
219 (Good)
How is the O3 level today in Niunaichang? (ozone (O3))
0 (Good)
What is the level of SO2 pollution? (sulfur dioxide (SO2))
8 (Good)
Current data Friday, May 27, 2022, 3:00 PM
PM2,5 61 (Unhealthy)
NO2 22 (Good)
PM10 69 (Unhealthy for Sensitive Groups)
CO 219 (Good)
O3 0 (Good)
SO2 8 (Good)
Data on air pollution from recent days in Niunaichang
index
2022-05-27
pm25
28
Moderate
no2
22
Good
pm10
35
Moderate
co
579
Good
o3
22
Good
so2
5
Good
data source »
Air pollution in Niunaichang from October 2018 to May 2020
index
2020-05
2020-04
2020-03
2020-02
2020-01
2019-12
2019-11
2019-10
2019-09
2019-08
2019-07
2019-06
2019-05
2019-04
2019-03
2019-02
2019-01
2018-12
2018-11
2018-10
pm25
28 (Moderate)
24 (Moderate)
28 (Moderate)
41 (Unhealthy for Sensitive Groups)
50 (Unhealthy for Sensitive Groups)
55 (Unhealthy for Sensitive Groups)
33 (Moderate)
21 (Moderate)
23 (Moderate)
17 (Moderate)
16 (Moderate)
20 (Moderate)
32 (Moderate)
24 (Moderate)
34 (Moderate)
47 (Unhealthy for Sensitive Groups)
52 (Unhealthy for Sensitive Groups)
52 (Unhealthy for Sensitive Groups)
38 (Unhealthy for Sensitive Groups)
30 (Moderate)
co
596 (Good)
514 (Good)
431 (Good)
583 (Good)
749 (Good)
647 (Good)
297 (Good)
504 (Good)
794 (Good)
772 (Good)
498 (Good)
493 (Good)
560 (Good)
757 (Good)
764 (Good)
1 (Good)
1 (Good)
1 (Good)
581 (Good)
548 (Good)
no2
28 (Good)
27 (Good)
35 (Good)
25 (Good)
32 (Good)
38 (Good)
27 (Good)
20 (Good)
22 (Good)
21 (Good)
18 (Good)
22 (Good)
22 (Good)
29 (Good)
36 (Good)
27 (Good)
43 (Moderate)
32 (Good)
28 (Good)
29 (Good)
o3
150 (Unhealthy)
113 (Moderate)
92 (Moderate)
69 (Good)
65 (Good)
44 (Good)
45 (Good)
62 (Good)
69 (Good)
118 (Moderate)
96 (Moderate)
90 (Moderate)
86 (Moderate)
88 (Moderate)
72 (Moderate)
56 (Good)
62 (Good)
37 (Good)
57 (Good)
74 (Moderate)
pm10
66 (Unhealthy for Sensitive Groups)
47 (Moderate)
75 (Unhealthy for Sensitive Groups)
70 (Unhealthy for Sensitive Groups)
74 (Unhealthy for Sensitive Groups)
90 (Unhealthy)
62 (Unhealthy for Sensitive Groups)
35 (Moderate)
39 (Moderate)
37 (Moderate)
33 (Moderate)
38 (Moderate)
68 (Unhealthy for Sensitive Groups)
46 (Moderate)
63 (Unhealthy for Sensitive Groups)
75 (Unhealthy for Sensitive Groups)
86 (Unhealthy)
105 (Unhealthy)
65 (Unhealthy for Sensitive Groups)
56 (Unhealthy for Sensitive Groups)
so2
15 (Good)
14 (Good)
16 (Good)
17 (Good)
12 (Good)
12 (Good)
13 (Good)
8.3 (Good)
6.5 (Good)
12 (Good)
7.4 (Good)
9.9 (Good)
10 (Good)
10 (Good)
15 (Good)
6.5 (Good)
11 (Good)
11 (Good)
9.9 (Good)
14 (Good)
data source »
南坝
Friday, May 27, 2022, 3:00 PM
PM2,5 61 (Unhealthy)
particulate matter (PM2.5) dust
NO2 22 (Good)
nitrogen dioxide (NO2)
PM10 69 (Unhealthy for Sensitive Groups)
particulate matter (PM10) suspended dust
CO 219 (Good)
carbon monoxide (CO)
O3 0.05 (Good)
ozone (O3)
SO2 7.7 (Good)
sulfur dioxide (SO2)
南坝
index
2022-05-27
pm25
28
no2
22
pm10
35
co
579
o3
22
so2
4.6
南坝
2018-10 2020-05

index
2020-05
2020-04
2020-03
2020-02
2020-01
2019-12
2019-11
2019-10
2019-09
2019-08
2019-07
2019-06
2019-05
2019-04
2019-03
2019-02
2019-01
2018-12
2018-11
2018-10
pm25
28
24
28
41
50
55
33
21
23
17
16
20
32
24
34
47
52
52
38
30
co
596
514
431
583
749
647
297
504
794
772
498
493
560
757
764
1
1
1
581
548
no2
28
27
35
25
32
38
27
20
22
21
18
22
22
29
36
27
43
32
28
29
o3
150
113
92
69
65
44
45
62
69
118
96
90
86
88
72
56
62
37
57
74
pm10
66
47
75
70
74
90
62
35
39
37
33
38
68
46
63
75
86
105
65
56
so2
15
14
16
17
12
12
13
8.3
6.5
12
7.4
9.9
10
10
15
6.5
11
11
9.9
14
* Pollution data source:
https://openaq.org
(ChinaAQIData)
The data is licensed under CC-By 4.0
PM2,5 61 (Unhealthy)
NO2 22 (Good)
PM10 69 (Unhealthy for Sensitive Groups)
CO 219 (Good)
O3 0 (Good)
SO2 8 (Good)
Data on air pollution from recent days in Niunaichang
| index | 2022-05-27 |
|---|---|
| pm25 | 28 Moderate |
| no2 | 22 Good |
| pm10 | 35 Moderate |
| co | 579 Good |
| o3 | 22 Good |
| so2 | 5 Good |

| index | 2020-05 | 2020-04 | 2020-03 | 2020-02 | 2020-01 | 2019-12 | 2019-11 | 2019-10 | 2019-09 | 2019-08 | 2019-07 | 2019-06 | 2019-05 | 2019-04 | 2019-03 | 2019-02 | 2019-01 | 2018-12 | 2018-11 | 2018-10 |
|---|---|---|---|---|---|---|---|---|---|---|---|---|---|---|---|---|---|---|---|---|
| pm25 | 28 (Moderate) | 24 (Moderate) | 28 (Moderate) | 41 (Unhealthy for Sensitive Groups) | 50 (Unhealthy for Sensitive Groups) | 55 (Unhealthy for Sensitive Groups) | 33 (Moderate) | 21 (Moderate) | 23 (Moderate) | 17 (Moderate) | 16 (Moderate) | 20 (Moderate) | 32 (Moderate) | 24 (Moderate) | 34 (Moderate) | 47 (Unhealthy for Sensitive Groups) | 52 (Unhealthy for Sensitive Groups) | 52 (Unhealthy for Sensitive Groups) | 38 (Unhealthy for Sensitive Groups) | 30 (Moderate) |
| co | 596 (Good) | 514 (Good) | 431 (Good) | 583 (Good) | 749 (Good) | 647 (Good) | 297 (Good) | 504 (Good) | 794 (Good) | 772 (Good) | 498 (Good) | 493 (Good) | 560 (Good) | 757 (Good) | 764 (Good) | 1 (Good) | 1 (Good) | 1 (Good) | 581 (Good) | 548 (Good) |
| no2 | 28 (Good) | 27 (Good) | 35 (Good) | 25 (Good) | 32 (Good) | 38 (Good) | 27 (Good) | 20 (Good) | 22 (Good) | 21 (Good) | 18 (Good) | 22 (Good) | 22 (Good) | 29 (Good) | 36 (Good) | 27 (Good) | 43 (Moderate) | 32 (Good) | 28 (Good) | 29 (Good) |
| o3 | 150 (Unhealthy) | 113 (Moderate) | 92 (Moderate) | 69 (Good) | 65 (Good) | 44 (Good) | 45 (Good) | 62 (Good) | 69 (Good) | 118 (Moderate) | 96 (Moderate) | 90 (Moderate) | 86 (Moderate) | 88 (Moderate) | 72 (Moderate) | 56 (Good) | 62 (Good) | 37 (Good) | 57 (Good) | 74 (Moderate) |
| pm10 | 66 (Unhealthy for Sensitive Groups) | 47 (Moderate) | 75 (Unhealthy for Sensitive Groups) | 70 (Unhealthy for Sensitive Groups) | 74 (Unhealthy for Sensitive Groups) | 90 (Unhealthy) | 62 (Unhealthy for Sensitive Groups) | 35 (Moderate) | 39 (Moderate) | 37 (Moderate) | 33 (Moderate) | 38 (Moderate) | 68 (Unhealthy for Sensitive Groups) | 46 (Moderate) | 63 (Unhealthy for Sensitive Groups) | 75 (Unhealthy for Sensitive Groups) | 86 (Unhealthy) | 105 (Unhealthy) | 65 (Unhealthy for Sensitive Groups) | 56 (Unhealthy for Sensitive Groups) |
| so2 | 15 (Good) | 14 (Good) | 16 (Good) | 17 (Good) | 12 (Good) | 12 (Good) | 13 (Good) | 8.3 (Good) | 6.5 (Good) | 12 (Good) | 7.4 (Good) | 9.9 (Good) | 10 (Good) | 10 (Good) | 15 (Good) | 6.5 (Good) | 11 (Good) | 11 (Good) | 9.9 (Good) | 14 (Good) |
PM2,5 61 (Unhealthy)
particulate matter (PM2.5) dustNO2 22 (Good)
nitrogen dioxide (NO2)PM10 69 (Unhealthy for Sensitive Groups)
particulate matter (PM10) suspended dustCO 219 (Good)
carbon monoxide (CO)O3 0.05 (Good)
ozone (O3)SO2 7.7 (Good)
sulfur dioxide (SO2)南坝
| index | 2022-05-27 |
|---|---|
| pm25 | 28 |
| no2 | 22 |
| pm10 | 35 |
| co | 579 |
| o3 | 22 |
| so2 | 4.6 |
南坝

| index | 2020-05 | 2020-04 | 2020-03 | 2020-02 | 2020-01 | 2019-12 | 2019-11 | 2019-10 | 2019-09 | 2019-08 | 2019-07 | 2019-06 | 2019-05 | 2019-04 | 2019-03 | 2019-02 | 2019-01 | 2018-12 | 2018-11 | 2018-10 |
|---|---|---|---|---|---|---|---|---|---|---|---|---|---|---|---|---|---|---|---|---|
| pm25 | 28 | 24 | 28 | 41 | 50 | 55 | 33 | 21 | 23 | 17 | 16 | 20 | 32 | 24 | 34 | 47 | 52 | 52 | 38 | 30 |
| co | 596 | 514 | 431 | 583 | 749 | 647 | 297 | 504 | 794 | 772 | 498 | 493 | 560 | 757 | 764 | 1 | 1 | 1 | 581 | 548 |
| no2 | 28 | 27 | 35 | 25 | 32 | 38 | 27 | 20 | 22 | 21 | 18 | 22 | 22 | 29 | 36 | 27 | 43 | 32 | 28 | 29 |
| o3 | 150 | 113 | 92 | 69 | 65 | 44 | 45 | 62 | 69 | 118 | 96 | 90 | 86 | 88 | 72 | 56 | 62 | 37 | 57 | 74 |
| pm10 | 66 | 47 | 75 | 70 | 74 | 90 | 62 | 35 | 39 | 37 | 33 | 38 | 68 | 46 | 63 | 75 | 86 | 105 | 65 | 56 |
| so2 | 15 | 14 | 16 | 17 | 12 | 12 | 13 | 8.3 | 6.5 | 12 | 7.4 | 9.9 | 10 | 10 | 15 | 6.5 | 11 | 11 | 9.9 | 14 |