Air Pollution in Mao’ergouliang: Real-time Air Quality Index and smog alert.
Pollution and air quality forecast for Mao’ergouliang. Today is Tuesday, June 16, 2026. The following air pollution values have been recorded for Mao’ergouliang:- particulate matter (PM2.5) dust - 61 (Unhealthy)
- nitrogen dioxide (NO2) - 22 (Good)
- particulate matter (PM10) suspended dust - 69 (Unhealthy for Sensitive Groups)
- carbon monoxide (CO) - 219 (Good)
- ozone (O3) - 0 (Good)
- sulfur dioxide (SO2) - 8 (Good)

What is the air quality in Mao’ergouliang today? Is the air polluted in Mao’ergouliang?. Is there smog?
What is the current level of PM2.5 in Mao’ergouliang? (particulate matter (PM2.5) dust)
Today's PM2.5 level is:
61 (Unhealthy)
For comparison, the highest level of PM2.5 in Mao’ergouliang in the last 7 days was: 28 (Friday, May 27, 2022) and the lowest: 28 (Friday, May 27, 2022).
The highest PM2.5 values were recorded: 50 (December 2019).
The lowest level of particulate matter PM2.5 pollution occurs in month: July (12).
How high is the level of NO2? (nitrogen dioxide (NO2))
22 (Good)
What is the level of PM10 today in Mao’ergouliang? (particulate matter (PM10) suspended dust)
The current level of particulate matter PM10 in Mao’ergouliang is:
69 (Unhealthy for Sensitive Groups)
The highest PM10 values usually occur in month: 77 (December 2018).
The lowest value of particulate matter PM10 pollution in Mao’ergouliang is usually recorded in: July (22).
How high is the CO level? (carbon monoxide (CO))
219 (Good)
How is the O3 level today in Mao’ergouliang? (ozone (O3))
0 (Good)
What is the level of SO2 pollution? (sulfur dioxide (SO2))
8 (Good)
Current data Friday, May 27, 2022, 3:00 PM
PM2,5 61 (Unhealthy)
NO2 22 (Good)
PM10 69 (Unhealthy for Sensitive Groups)
CO 219 (Good)
O3 0 (Good)
SO2 8 (Good)
Data on air pollution from recent days in Mao’ergouliang
index
2022-05-27
pm25
28
Moderate
no2
22
Good
pm10
35
Moderate
co
579
Good
o3
22
Good
so2
5
Good
data source »
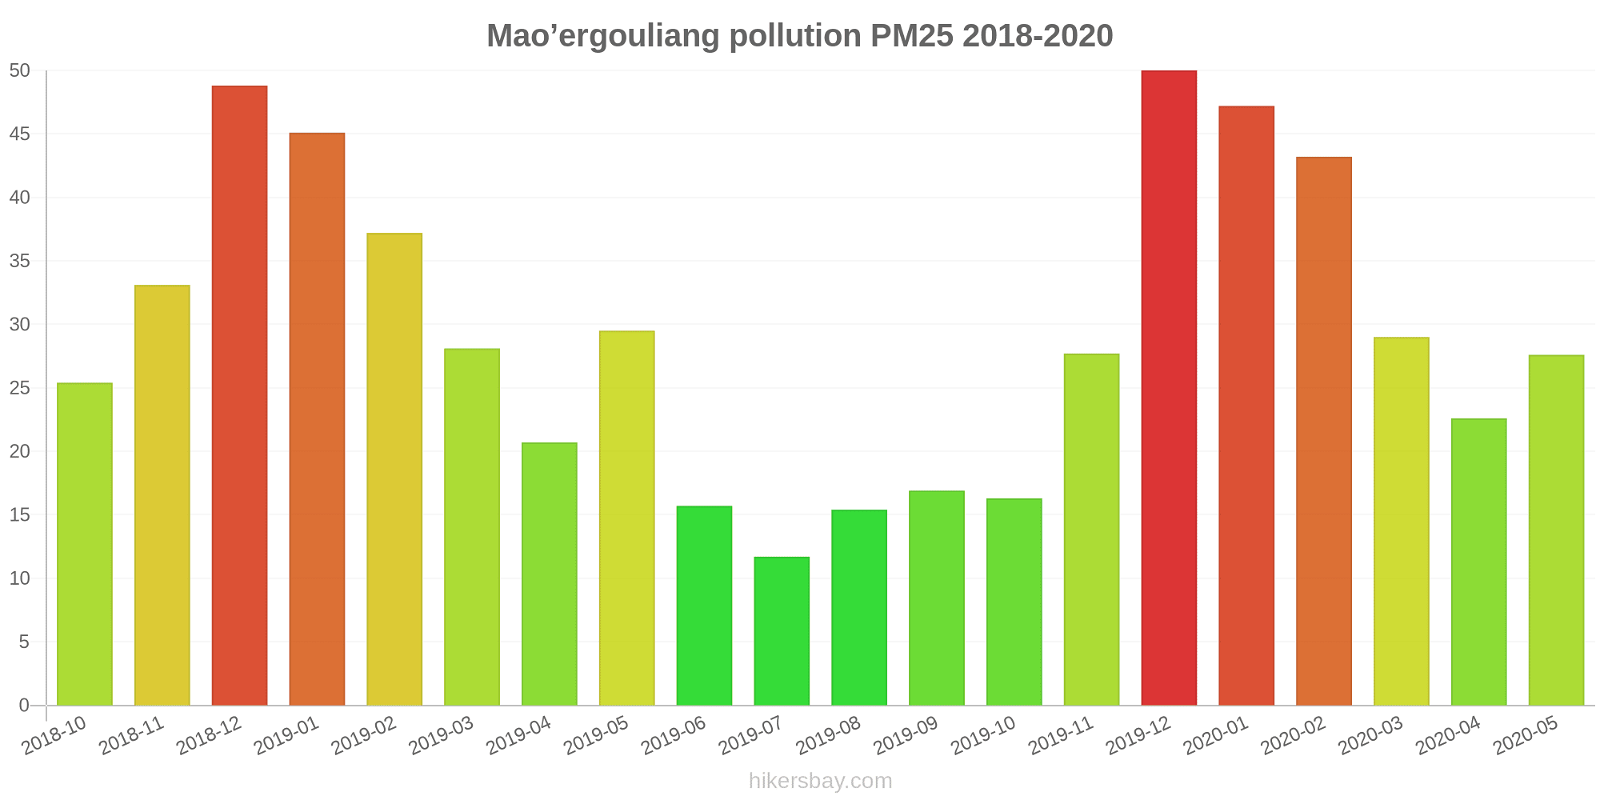
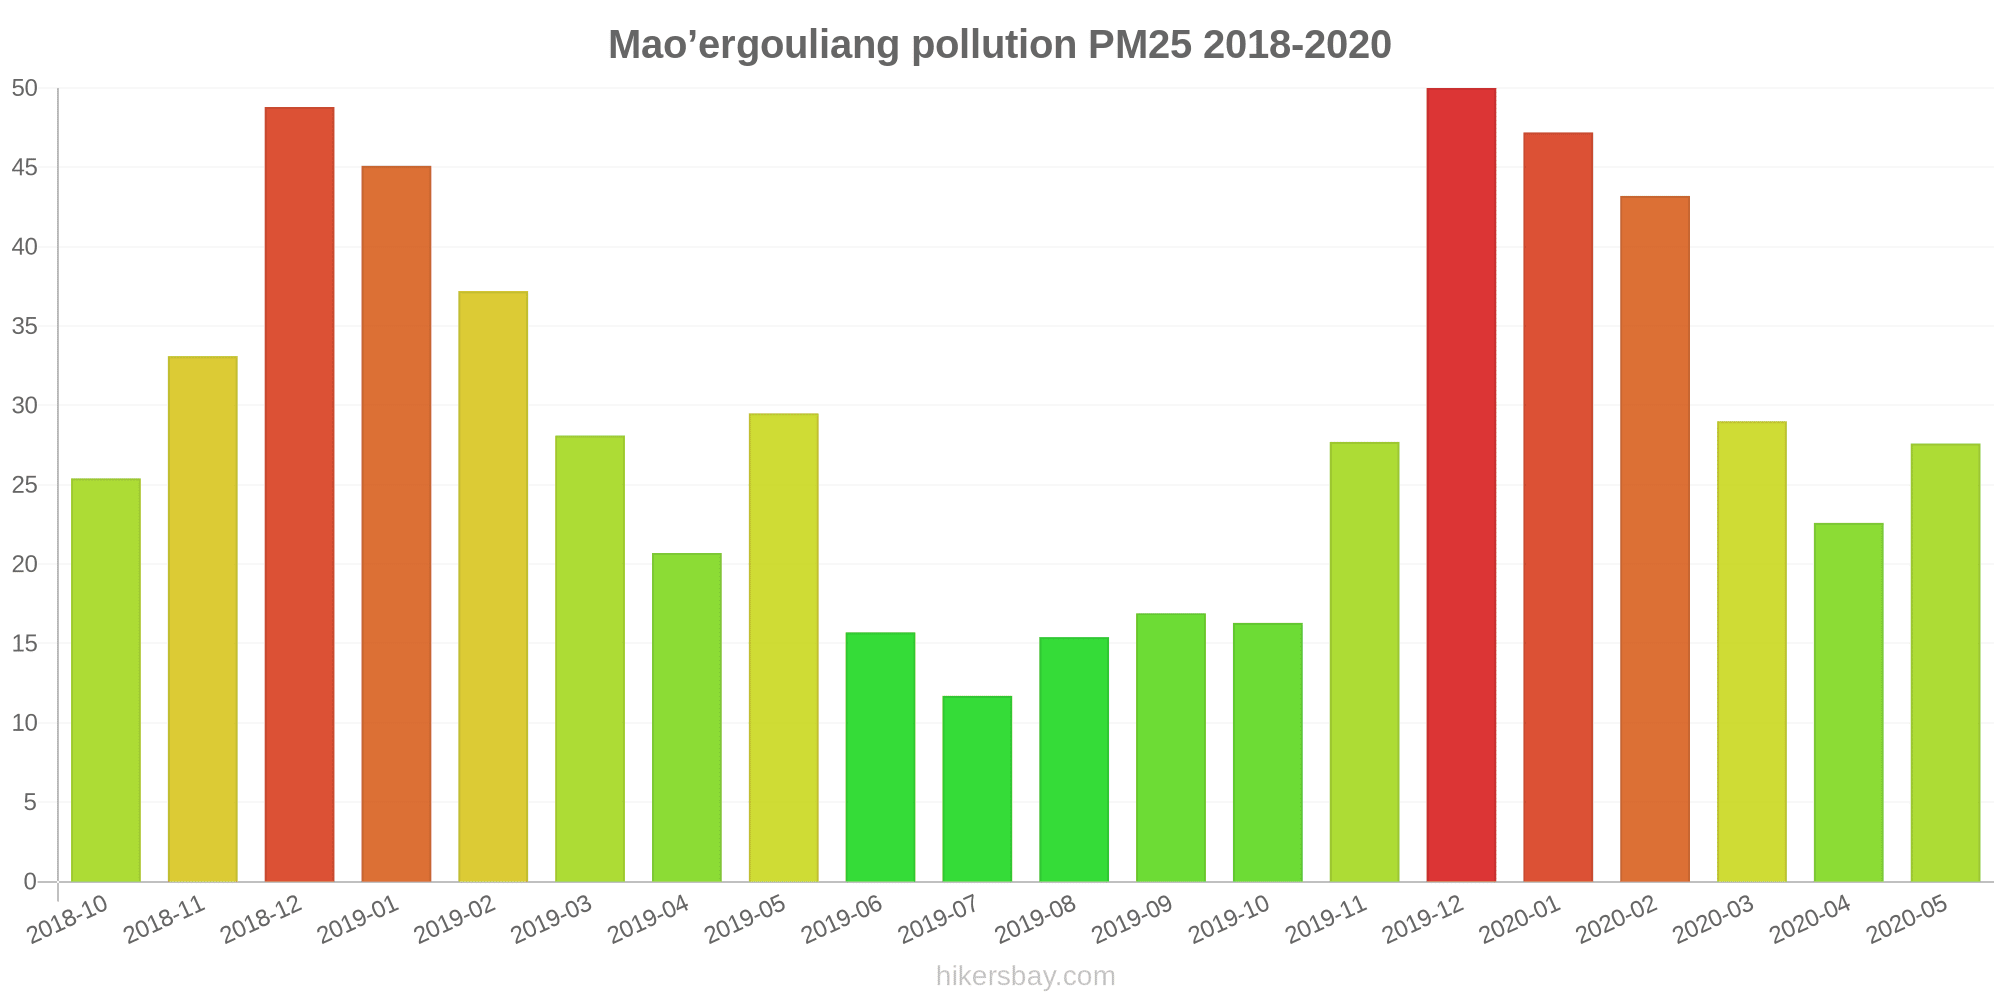
Air pollution in Mao’ergouliang from October 2018 to May 2020
index
2020-05
2020-04
2020-03
2020-02
2020-01
2019-12
2019-11
2019-10
2019-09
2019-08
2019-07
2019-06
2019-05
2019-04
2019-03
2019-02
2019-01
2018-12
2018-11
2018-10
pm25
28 (Moderate)
23 (Moderate)
29 (Moderate)
43 (Unhealthy for Sensitive Groups)
47 (Unhealthy for Sensitive Groups)
50 (Unhealthy for Sensitive Groups)
28 (Moderate)
16 (Moderate)
17 (Moderate)
15 (Moderate)
12 (Good)
16 (Moderate)
30 (Moderate)
21 (Moderate)
28 (Moderate)
37 (Unhealthy for Sensitive Groups)
45 (Unhealthy for Sensitive Groups)
49 (Unhealthy for Sensitive Groups)
33 (Moderate)
25 (Moderate)
co
317 (Good)
259 (Good)
561 (Good)
754 (Good)
751 (Good)
585 (Good)
246 (Good)
536 (Good)
721 (Good)
416 (Good)
377 (Good)
361 (Good)
473 (Good)
391 (Good)
602 (Good)
658 (Good)
1 (Good)
947 (Good)
487 (Good)
506 (Good)
no2
16 (Good)
16 (Good)
21 (Good)
15 (Good)
18 (Good)
33 (Good)
24 (Good)
15 (Good)
18 (Good)
16 (Good)
17 (Good)
18 (Good)
20 (Good)
15 (Good)
19 (Good)
22 (Good)
38 (Good)
28 (Good)
22 (Good)
23 (Good)
o3
144 (Unhealthy for Sensitive Groups)
122 (Unhealthy for Sensitive Groups)
104 (Moderate)
87 (Moderate)
79 (Moderate)
58 (Good)
63 (Good)
77 (Moderate)
78 (Moderate)
118 (Moderate)
93 (Moderate)
96 (Moderate)
89 (Moderate)
102 (Moderate)
87 (Moderate)
71 (Moderate)
77 (Moderate)
56 (Good)
72 (Moderate)
78 (Moderate)
pm10
55 (Unhealthy for Sensitive Groups)
36 (Moderate)
53 (Unhealthy for Sensitive Groups)
57 (Unhealthy for Sensitive Groups)
53 (Unhealthy for Sensitive Groups)
62 (Unhealthy for Sensitive Groups)
43 (Moderate)
24 (Moderate)
26 (Moderate)
24 (Moderate)
22 (Moderate)
27 (Moderate)
54 (Unhealthy for Sensitive Groups)
34 (Moderate)
44 (Moderate)
55 (Unhealthy for Sensitive Groups)
64 (Unhealthy for Sensitive Groups)
77 (Unhealthy for Sensitive Groups)
49 (Moderate)
42 (Moderate)
so2
8 (Good)
9 (Good)
11 (Good)
6.7 (Good)
4.7 (Good)
8.9 (Good)
8.2 (Good)
8.2 (Good)
5.9 (Good)
11 (Good)
8.4 (Good)
9.9 (Good)
9.2 (Good)
13 (Good)
7.3 (Good)
5.4 (Good)
7.7 (Good)
5.2 (Good)
5.1 (Good)
4.3 (Good)
data source »
黑石坡
Friday, May 27, 2022, 3:00 PM
PM2,5 61 (Unhealthy)
particulate matter (PM2.5) dust
NO2 22 (Good)
nitrogen dioxide (NO2)
PM10 69 (Unhealthy for Sensitive Groups)
particulate matter (PM10) suspended dust
CO 219 (Good)
carbon monoxide (CO)
O3 0.05 (Good)
ozone (O3)
SO2 7.7 (Good)
sulfur dioxide (SO2)
黑石坡
index
2022-05-27
pm25
28
no2
22
pm10
35
co
579
o3
22
so2
4.6
黑石坡
2018-10 2020-05
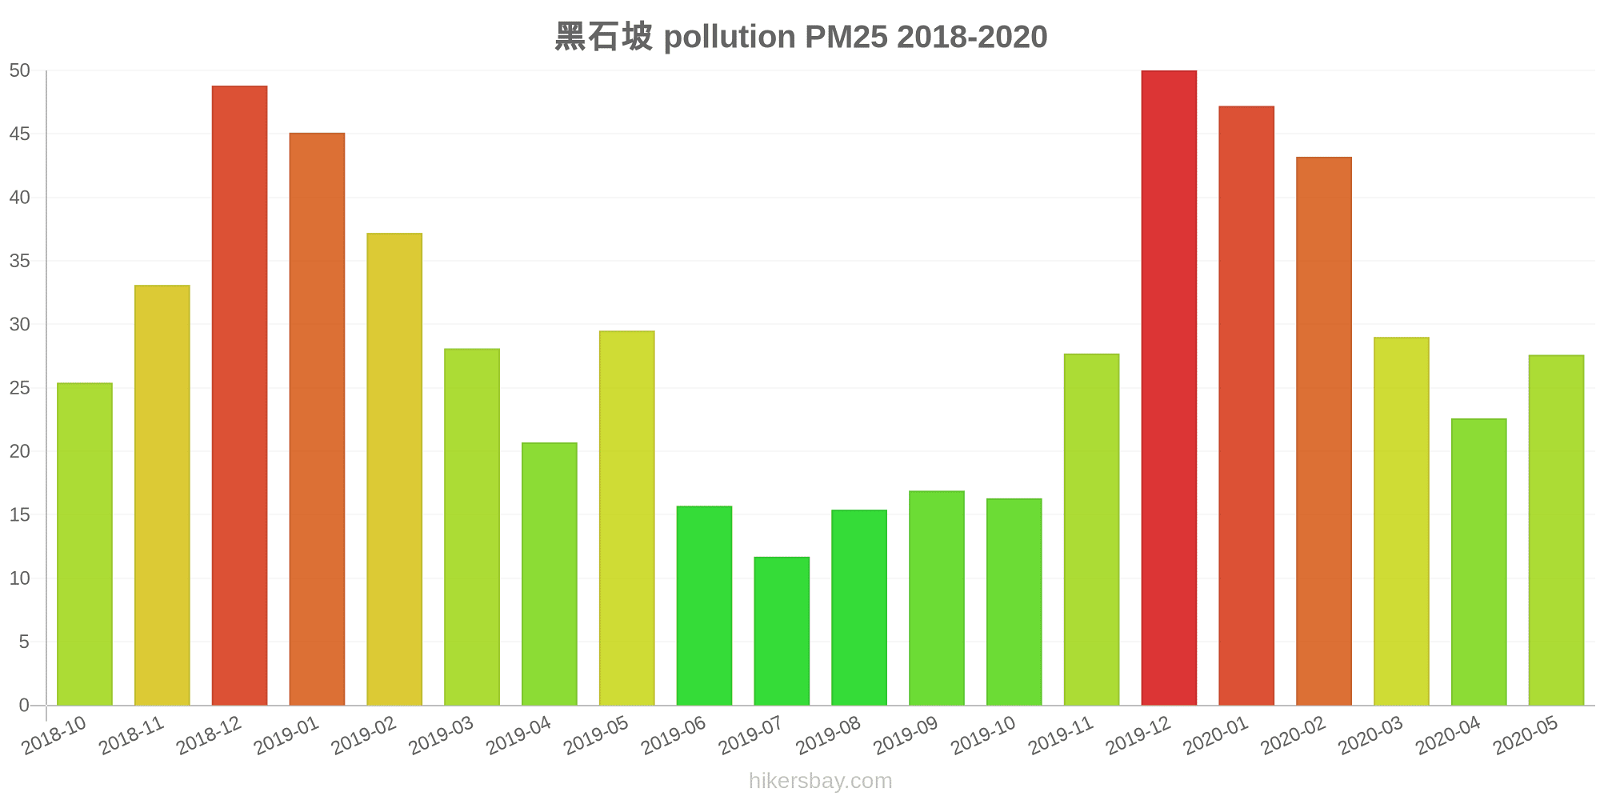
index
2020-05
2020-04
2020-03
2020-02
2020-01
2019-12
2019-11
2019-10
2019-09
2019-08
2019-07
2019-06
2019-05
2019-04
2019-03
2019-02
2019-01
2018-12
2018-11
2018-10
pm25
28
23
29
43
47
50
28
16
17
15
12
16
30
21
28
37
45
49
33
25
co
317
259
561
754
751
585
246
536
721
416
377
361
473
391
602
658
1
947
487
506
no2
16
16
21
15
18
33
24
15
18
16
17
18
20
15
19
22
38
28
22
23
o3
144
122
104
87
79
58
63
77
78
118
93
96
89
102
87
71
77
56
72
78
pm10
55
36
53
57
53
62
43
24
26
24
22
27
54
34
44
55
64
77
49
42
so2
8
9
11
6.7
4.7
8.9
8.2
8.2
5.9
11
8.4
9.9
9.2
13
7.3
5.4
7.7
5.2
5.1
4.3
* Pollution data source:
https://openaq.org
(ChinaAQIData)
The data is licensed under CC-By 4.0
PM2,5 61 (Unhealthy)
NO2 22 (Good)
PM10 69 (Unhealthy for Sensitive Groups)
CO 219 (Good)
O3 0 (Good)
SO2 8 (Good)
Data on air pollution from recent days in Mao’ergouliang
| index | 2022-05-27 |
|---|---|
| pm25 | 28 Moderate |
| no2 | 22 Good |
| pm10 | 35 Moderate |
| co | 579 Good |
| o3 | 22 Good |
| so2 | 5 Good |
| index | 2020-05 | 2020-04 | 2020-03 | 2020-02 | 2020-01 | 2019-12 | 2019-11 | 2019-10 | 2019-09 | 2019-08 | 2019-07 | 2019-06 | 2019-05 | 2019-04 | 2019-03 | 2019-02 | 2019-01 | 2018-12 | 2018-11 | 2018-10 |
|---|---|---|---|---|---|---|---|---|---|---|---|---|---|---|---|---|---|---|---|---|
| pm25 | 28 (Moderate) | 23 (Moderate) | 29 (Moderate) | 43 (Unhealthy for Sensitive Groups) | 47 (Unhealthy for Sensitive Groups) | 50 (Unhealthy for Sensitive Groups) | 28 (Moderate) | 16 (Moderate) | 17 (Moderate) | 15 (Moderate) | 12 (Good) | 16 (Moderate) | 30 (Moderate) | 21 (Moderate) | 28 (Moderate) | 37 (Unhealthy for Sensitive Groups) | 45 (Unhealthy for Sensitive Groups) | 49 (Unhealthy for Sensitive Groups) | 33 (Moderate) | 25 (Moderate) |
| co | 317 (Good) | 259 (Good) | 561 (Good) | 754 (Good) | 751 (Good) | 585 (Good) | 246 (Good) | 536 (Good) | 721 (Good) | 416 (Good) | 377 (Good) | 361 (Good) | 473 (Good) | 391 (Good) | 602 (Good) | 658 (Good) | 1 (Good) | 947 (Good) | 487 (Good) | 506 (Good) |
| no2 | 16 (Good) | 16 (Good) | 21 (Good) | 15 (Good) | 18 (Good) | 33 (Good) | 24 (Good) | 15 (Good) | 18 (Good) | 16 (Good) | 17 (Good) | 18 (Good) | 20 (Good) | 15 (Good) | 19 (Good) | 22 (Good) | 38 (Good) | 28 (Good) | 22 (Good) | 23 (Good) |
| o3 | 144 (Unhealthy for Sensitive Groups) | 122 (Unhealthy for Sensitive Groups) | 104 (Moderate) | 87 (Moderate) | 79 (Moderate) | 58 (Good) | 63 (Good) | 77 (Moderate) | 78 (Moderate) | 118 (Moderate) | 93 (Moderate) | 96 (Moderate) | 89 (Moderate) | 102 (Moderate) | 87 (Moderate) | 71 (Moderate) | 77 (Moderate) | 56 (Good) | 72 (Moderate) | 78 (Moderate) |
| pm10 | 55 (Unhealthy for Sensitive Groups) | 36 (Moderate) | 53 (Unhealthy for Sensitive Groups) | 57 (Unhealthy for Sensitive Groups) | 53 (Unhealthy for Sensitive Groups) | 62 (Unhealthy for Sensitive Groups) | 43 (Moderate) | 24 (Moderate) | 26 (Moderate) | 24 (Moderate) | 22 (Moderate) | 27 (Moderate) | 54 (Unhealthy for Sensitive Groups) | 34 (Moderate) | 44 (Moderate) | 55 (Unhealthy for Sensitive Groups) | 64 (Unhealthy for Sensitive Groups) | 77 (Unhealthy for Sensitive Groups) | 49 (Moderate) | 42 (Moderate) |
| so2 | 8 (Good) | 9 (Good) | 11 (Good) | 6.7 (Good) | 4.7 (Good) | 8.9 (Good) | 8.2 (Good) | 8.2 (Good) | 5.9 (Good) | 11 (Good) | 8.4 (Good) | 9.9 (Good) | 9.2 (Good) | 13 (Good) | 7.3 (Good) | 5.4 (Good) | 7.7 (Good) | 5.2 (Good) | 5.1 (Good) | 4.3 (Good) |
PM2,5 61 (Unhealthy)
particulate matter (PM2.5) dustNO2 22 (Good)
nitrogen dioxide (NO2)PM10 69 (Unhealthy for Sensitive Groups)
particulate matter (PM10) suspended dustCO 219 (Good)
carbon monoxide (CO)O3 0.05 (Good)
ozone (O3)SO2 7.7 (Good)
sulfur dioxide (SO2)黑石坡
| index | 2022-05-27 |
|---|---|
| pm25 | 28 |
| no2 | 22 |
| pm10 | 35 |
| co | 579 |
| o3 | 22 |
| so2 | 4.6 |
黑石坡

| index | 2020-05 | 2020-04 | 2020-03 | 2020-02 | 2020-01 | 2019-12 | 2019-11 | 2019-10 | 2019-09 | 2019-08 | 2019-07 | 2019-06 | 2019-05 | 2019-04 | 2019-03 | 2019-02 | 2019-01 | 2018-12 | 2018-11 | 2018-10 |
|---|---|---|---|---|---|---|---|---|---|---|---|---|---|---|---|---|---|---|---|---|
| pm25 | 28 | 23 | 29 | 43 | 47 | 50 | 28 | 16 | 17 | 15 | 12 | 16 | 30 | 21 | 28 | 37 | 45 | 49 | 33 | 25 |
| co | 317 | 259 | 561 | 754 | 751 | 585 | 246 | 536 | 721 | 416 | 377 | 361 | 473 | 391 | 602 | 658 | 1 | 947 | 487 | 506 |
| no2 | 16 | 16 | 21 | 15 | 18 | 33 | 24 | 15 | 18 | 16 | 17 | 18 | 20 | 15 | 19 | 22 | 38 | 28 | 22 | 23 |
| o3 | 144 | 122 | 104 | 87 | 79 | 58 | 63 | 77 | 78 | 118 | 93 | 96 | 89 | 102 | 87 | 71 | 77 | 56 | 72 | 78 |
| pm10 | 55 | 36 | 53 | 57 | 53 | 62 | 43 | 24 | 26 | 24 | 22 | 27 | 54 | 34 | 44 | 55 | 64 | 77 | 49 | 42 |
| so2 | 8 | 9 | 11 | 6.7 | 4.7 | 8.9 | 8.2 | 8.2 | 5.9 | 11 | 8.4 | 9.9 | 9.2 | 13 | 7.3 | 5.4 | 7.7 | 5.2 | 5.1 | 4.3 |