Air Pollution in Qingwucun: Real-time Air Quality Index and smog alert.
Pollution and air quality forecast for Qingwucun. Today is Tuesday, June 16, 2026. The following air pollution values have been recorded for Qingwucun:- particulate matter (PM10) suspended dust - 7 (Good)
- particulate matter (PM2.5) dust - 2 (Good)
- carbon monoxide (CO) - 100 (Good)
- nitrogen dioxide (NO2) - 8 (Good)
- ozone (O3) - 0 (Good)
- sulfur dioxide (SO2) - 9 (Good)

What is the air quality in Qingwucun today? Is the air polluted in Qingwucun?. Is there smog?
What is the level of PM10 today in Qingwucun? (particulate matter (PM10) suspended dust)
The current level of particulate matter PM10 in Qingwucun is:
7 (Good)
The highest PM10 values usually occur in month: 78 (December 2019).
The lowest value of particulate matter PM10 pollution in Qingwucun is usually recorded in: June (16).
What is the current level of PM2.5 in Qingwucun? (particulate matter (PM2.5) dust)
Today's PM2.5 level is:
2 (Good)
For comparison, the highest level of PM2.5 in Qingwucun in the last 7 days was: 24 (Friday, May 27, 2022) and the lowest: 24 (Friday, May 27, 2022).
The highest PM2.5 values were recorded: 54 (January 2019).
The lowest level of particulate matter PM2.5 pollution occurs in month: June (9.5).
How high is the CO level? (carbon monoxide (CO))
100 (Good)
How high is the level of NO2? (nitrogen dioxide (NO2))
8 (Good)
How is the O3 level today in Qingwucun? (ozone (O3))
0 (Good)
What is the level of SO2 pollution? (sulfur dioxide (SO2))
9 (Good)
Current data Friday, May 27, 2022, 12:00 PM
PM10 7 (Good)
PM2,5 2 (Good)
CO 100 (Good)
NO2 8 (Good)
O3 0 (Good)
SO2 9 (Good)
Data on air pollution from recent days in Qingwucun
index
2022-05-27
pm10
32
Moderate
pm25
24
Moderate
co
468
Good
no2
21
Good
o3
32
Good
so2
5
Good
data source »
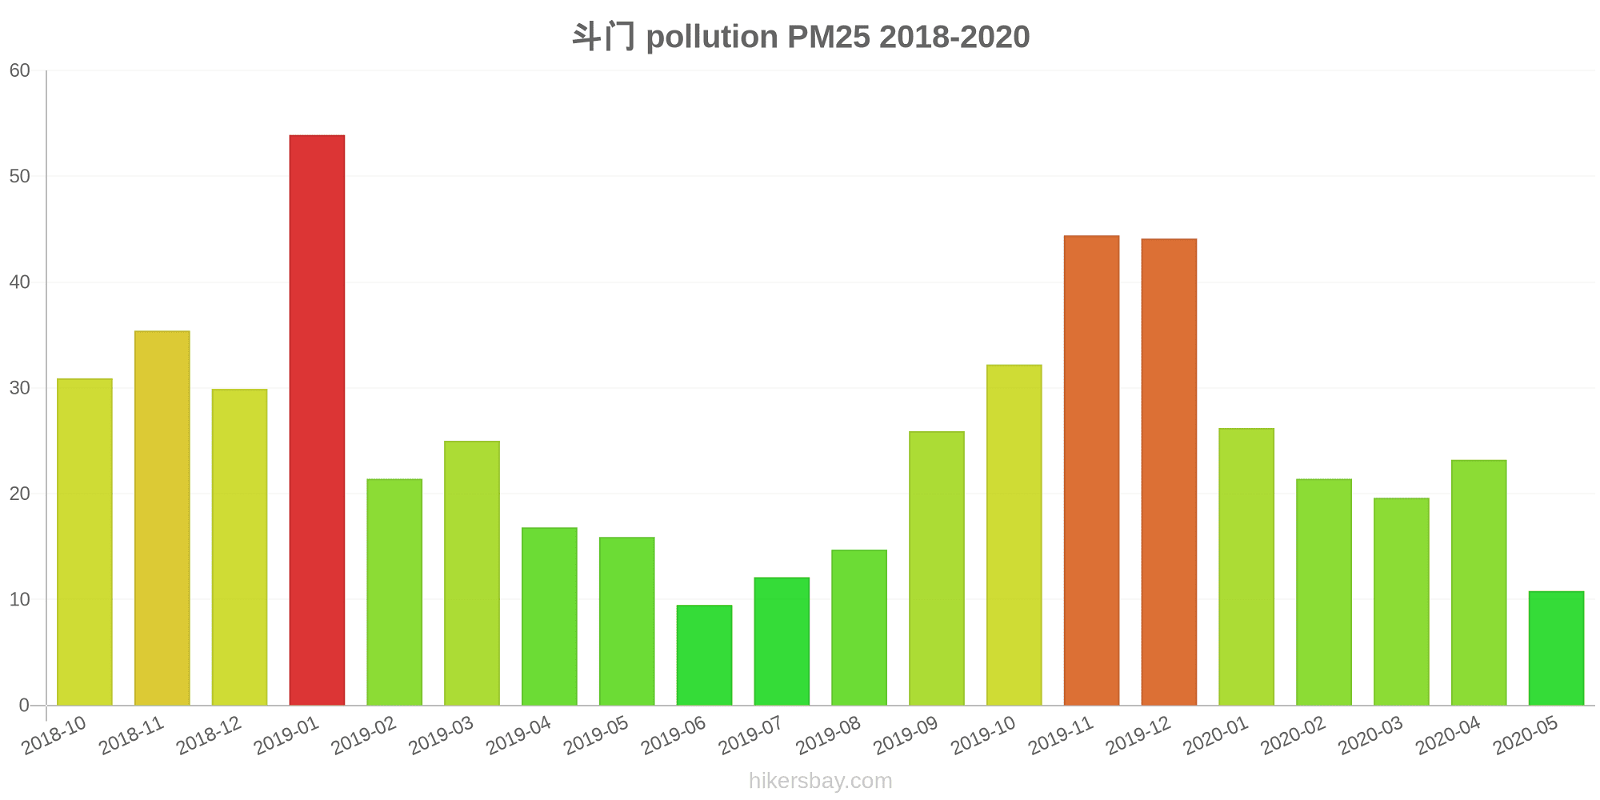
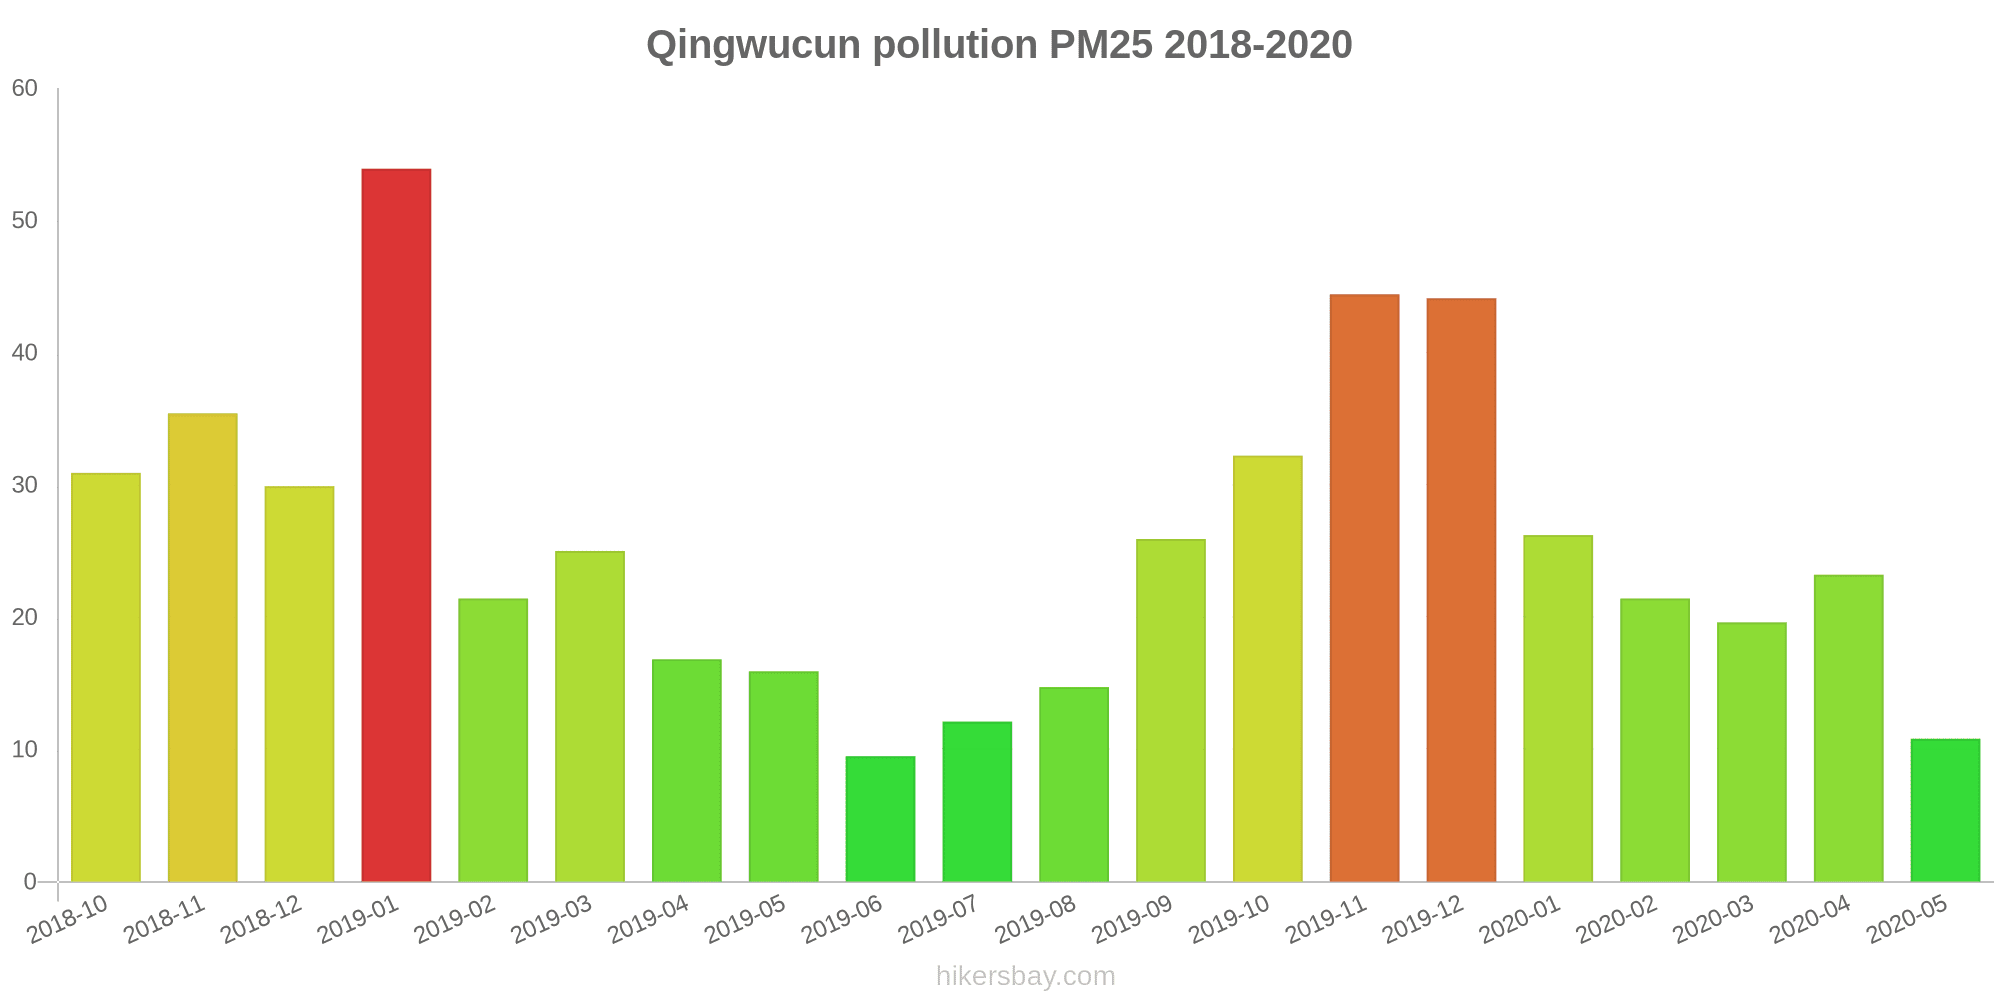
Air pollution in Qingwucun from October 2018 to May 2020

index
2020-05
2020-04
2020-03
2020-02
2020-01
2019-12
2019-11
2019-10
2019-09
2019-08
2019-07
2019-06
2019-05
2019-04
2019-03
2019-02
2019-01
2018-12
2018-11
2018-10
pm25
11 (Good)
23 (Moderate)
20 (Moderate)
21 (Moderate)
26 (Moderate)
44 (Unhealthy for Sensitive Groups)
44 (Unhealthy for Sensitive Groups)
32 (Moderate)
26 (Moderate)
15 (Moderate)
12 (Good)
9.5 (Good)
16 (Moderate)
17 (Moderate)
25 (Moderate)
21 (Moderate)
54 (Unhealthy for Sensitive Groups)
30 (Moderate)
35 (Unhealthy for Sensitive Groups)
31 (Moderate)
co
534 (Good)
611 (Good)
595 (Good)
527 (Good)
669 (Good)
808 (Good)
692 (Good)
695 (Good)
613 (Good)
584 (Good)
575 (Good)
650 (Good)
639 (Good)
626 (Good)
782 (Good)
854 (Good)
1 (Good)
685 (Good)
764 (Good)
769 (Good)
no2
8 (Good)
28 (Good)
22 (Good)
15 (Good)
24 (Good)
52 (Moderate)
35 (Good)
24 (Good)
18 (Good)
15 (Good)
13 (Good)
12 (Good)
21 (Good)
18 (Good)
32 (Good)
20 (Good)
50 (Moderate)
36 (Good)
42 (Moderate)
41 (Moderate)
o3
75 (Moderate)
104 (Moderate)
87 (Moderate)
88 (Moderate)
93 (Moderate)
109 (Moderate)
168 (Unhealthy)
158 (Unhealthy)
173 (Unhealthy)
121 (Unhealthy for Sensitive Groups)
85 (Moderate)
81 (Moderate)
86 (Moderate)
69 (Good)
61 (Good)
61 (Good)
75 (Moderate)
66 (Good)
111 (Moderate)
142 (Unhealthy for Sensitive Groups)
pm10
19 (Good)
41 (Moderate)
35 (Moderate)
32 (Moderate)
46 (Moderate)
78 (Unhealthy for Sensitive Groups)
70 (Unhealthy for Sensitive Groups)
48 (Moderate)
40 (Moderate)
22 (Moderate)
21 (Moderate)
16 (Good)
24 (Moderate)
25 (Moderate)
36 (Moderate)
31 (Moderate)
68 (Unhealthy for Sensitive Groups)
45 (Moderate)
54 (Unhealthy for Sensitive Groups)
51 (Unhealthy for Sensitive Groups)
so2
2.8 (Good)
3.4 (Good)
2.3 (Good)
3.6 (Good)
3.6 (Good)
7 (Good)
6 (Good)
4.1 (Good)
4.6 (Good)
4.1 (Good)
3.3 (Good)
3.1 (Good)
3.5 (Good)
3.1 (Good)
5.7 (Good)
4.5 (Good)
7.9 (Good)
6.5 (Good)
6.2 (Good)
7.4 (Good)
data source »
斗门
Friday, May 27, 2022, 12:00 PM
PM10 6.7 (Good)
particulate matter (PM10) suspended dust
PM2,5 1.7 (Good)
particulate matter (PM2.5) dust
CO 100 (Good)
carbon monoxide (CO)
NO2 7.6 (Good)
nitrogen dioxide (NO2)
O3 0.02 (Good)
ozone (O3)
SO2 8.6 (Good)
sulfur dioxide (SO2)
斗门
index
2022-05-27
pm10
32
pm25
24
co
468
no2
21
o3
32
so2
4.6
斗门
2018-10 2020-05
index
2020-05
2020-04
2020-03
2020-02
2020-01
2019-12
2019-11
2019-10
2019-09
2019-08
2019-07
2019-06
2019-05
2019-04
2019-03
2019-02
2019-01
2018-12
2018-11
2018-10
pm25
11
23
20
21
26
44
44
32
26
15
12
9.5
16
17
25
21
54
30
35
31
co
534
611
595
527
669
808
692
695
613
584
575
650
639
626
782
854
1
685
764
769
no2
8
28
22
15
24
52
35
24
18
15
13
12
21
18
32
20
50
36
42
41
o3
75
104
87
88
93
109
168
158
173
121
85
81
86
69
61
61
75
66
111
142
pm10
19
41
35
32
46
78
70
48
40
22
21
16
24
25
36
31
68
45
54
51
so2
2.8
3.4
2.3
3.6
3.6
7
6
4.1
4.6
4.1
3.3
3.1
3.5
3.1
5.7
4.5
7.9
6.5
6.2
7.4
* Pollution data source:
https://openaq.org
(ChinaAQIData)
The data is licensed under CC-By 4.0
PM10 7 (Good)
PM2,5 2 (Good)
CO 100 (Good)
NO2 8 (Good)
O3 0 (Good)
SO2 9 (Good)
Data on air pollution from recent days in Qingwucun
| index | 2022-05-27 |
|---|---|
| pm10 | 32 Moderate |
| pm25 | 24 Moderate |
| co | 468 Good |
| no2 | 21 Good |
| o3 | 32 Good |
| so2 | 5 Good |
| index | 2020-05 | 2020-04 | 2020-03 | 2020-02 | 2020-01 | 2019-12 | 2019-11 | 2019-10 | 2019-09 | 2019-08 | 2019-07 | 2019-06 | 2019-05 | 2019-04 | 2019-03 | 2019-02 | 2019-01 | 2018-12 | 2018-11 | 2018-10 |
|---|---|---|---|---|---|---|---|---|---|---|---|---|---|---|---|---|---|---|---|---|
| pm25 | 11 (Good) | 23 (Moderate) | 20 (Moderate) | 21 (Moderate) | 26 (Moderate) | 44 (Unhealthy for Sensitive Groups) | 44 (Unhealthy for Sensitive Groups) | 32 (Moderate) | 26 (Moderate) | 15 (Moderate) | 12 (Good) | 9.5 (Good) | 16 (Moderate) | 17 (Moderate) | 25 (Moderate) | 21 (Moderate) | 54 (Unhealthy for Sensitive Groups) | 30 (Moderate) | 35 (Unhealthy for Sensitive Groups) | 31 (Moderate) |
| co | 534 (Good) | 611 (Good) | 595 (Good) | 527 (Good) | 669 (Good) | 808 (Good) | 692 (Good) | 695 (Good) | 613 (Good) | 584 (Good) | 575 (Good) | 650 (Good) | 639 (Good) | 626 (Good) | 782 (Good) | 854 (Good) | 1 (Good) | 685 (Good) | 764 (Good) | 769 (Good) |
| no2 | 8 (Good) | 28 (Good) | 22 (Good) | 15 (Good) | 24 (Good) | 52 (Moderate) | 35 (Good) | 24 (Good) | 18 (Good) | 15 (Good) | 13 (Good) | 12 (Good) | 21 (Good) | 18 (Good) | 32 (Good) | 20 (Good) | 50 (Moderate) | 36 (Good) | 42 (Moderate) | 41 (Moderate) |
| o3 | 75 (Moderate) | 104 (Moderate) | 87 (Moderate) | 88 (Moderate) | 93 (Moderate) | 109 (Moderate) | 168 (Unhealthy) | 158 (Unhealthy) | 173 (Unhealthy) | 121 (Unhealthy for Sensitive Groups) | 85 (Moderate) | 81 (Moderate) | 86 (Moderate) | 69 (Good) | 61 (Good) | 61 (Good) | 75 (Moderate) | 66 (Good) | 111 (Moderate) | 142 (Unhealthy for Sensitive Groups) |
| pm10 | 19 (Good) | 41 (Moderate) | 35 (Moderate) | 32 (Moderate) | 46 (Moderate) | 78 (Unhealthy for Sensitive Groups) | 70 (Unhealthy for Sensitive Groups) | 48 (Moderate) | 40 (Moderate) | 22 (Moderate) | 21 (Moderate) | 16 (Good) | 24 (Moderate) | 25 (Moderate) | 36 (Moderate) | 31 (Moderate) | 68 (Unhealthy for Sensitive Groups) | 45 (Moderate) | 54 (Unhealthy for Sensitive Groups) | 51 (Unhealthy for Sensitive Groups) |
| so2 | 2.8 (Good) | 3.4 (Good) | 2.3 (Good) | 3.6 (Good) | 3.6 (Good) | 7 (Good) | 6 (Good) | 4.1 (Good) | 4.6 (Good) | 4.1 (Good) | 3.3 (Good) | 3.1 (Good) | 3.5 (Good) | 3.1 (Good) | 5.7 (Good) | 4.5 (Good) | 7.9 (Good) | 6.5 (Good) | 6.2 (Good) | 7.4 (Good) |
PM10 6.7 (Good)
particulate matter (PM10) suspended dustPM2,5 1.7 (Good)
particulate matter (PM2.5) dustCO 100 (Good)
carbon monoxide (CO)NO2 7.6 (Good)
nitrogen dioxide (NO2)O3 0.02 (Good)
ozone (O3)SO2 8.6 (Good)
sulfur dioxide (SO2)斗门
| index | 2022-05-27 |
|---|---|
| pm10 | 32 |
| pm25 | 24 |
| co | 468 |
| no2 | 21 |
| o3 | 32 |
| so2 | 4.6 |
斗门

| index | 2020-05 | 2020-04 | 2020-03 | 2020-02 | 2020-01 | 2019-12 | 2019-11 | 2019-10 | 2019-09 | 2019-08 | 2019-07 | 2019-06 | 2019-05 | 2019-04 | 2019-03 | 2019-02 | 2019-01 | 2018-12 | 2018-11 | 2018-10 |
|---|---|---|---|---|---|---|---|---|---|---|---|---|---|---|---|---|---|---|---|---|
| pm25 | 11 | 23 | 20 | 21 | 26 | 44 | 44 | 32 | 26 | 15 | 12 | 9.5 | 16 | 17 | 25 | 21 | 54 | 30 | 35 | 31 |
| co | 534 | 611 | 595 | 527 | 669 | 808 | 692 | 695 | 613 | 584 | 575 | 650 | 639 | 626 | 782 | 854 | 1 | 685 | 764 | 769 |
| no2 | 8 | 28 | 22 | 15 | 24 | 52 | 35 | 24 | 18 | 15 | 13 | 12 | 21 | 18 | 32 | 20 | 50 | 36 | 42 | 41 |
| o3 | 75 | 104 | 87 | 88 | 93 | 109 | 168 | 158 | 173 | 121 | 85 | 81 | 86 | 69 | 61 | 61 | 75 | 66 | 111 | 142 |
| pm10 | 19 | 41 | 35 | 32 | 46 | 78 | 70 | 48 | 40 | 22 | 21 | 16 | 24 | 25 | 36 | 31 | 68 | 45 | 54 | 51 |
| so2 | 2.8 | 3.4 | 2.3 | 3.6 | 3.6 | 7 | 6 | 4.1 | 4.6 | 4.1 | 3.3 | 3.1 | 3.5 | 3.1 | 5.7 | 4.5 | 7.9 | 6.5 | 6.2 | 7.4 |