Air Pollution in Shitang: Real-time Air Quality Index and smog alert.
Pollution and air quality forecast for Shitang. Today is Tuesday, June 16, 2026. The following air pollution values have been recorded for Shitang:- particulate matter (PM2.5) dust - 61 (Unhealthy)
- nitrogen dioxide (NO2) - 22 (Good)
- particulate matter (PM10) suspended dust - 69 (Unhealthy for Sensitive Groups)
- carbon monoxide (CO) - 219 (Good)
- ozone (O3) - 0 (Good)
- sulfur dioxide (SO2) - 8 (Good)

What is the air quality in Shitang today? Is the air polluted in Shitang?. Is there smog?
What is the current level of PM2.5 in Shitang? (particulate matter (PM2.5) dust)
Today's PM2.5 level is:
61 (Unhealthy)
For comparison, the highest level of PM2.5 in Shitang in the last 7 days was: 28 (Friday, May 27, 2022) and the lowest: 28 (Friday, May 27, 2022).
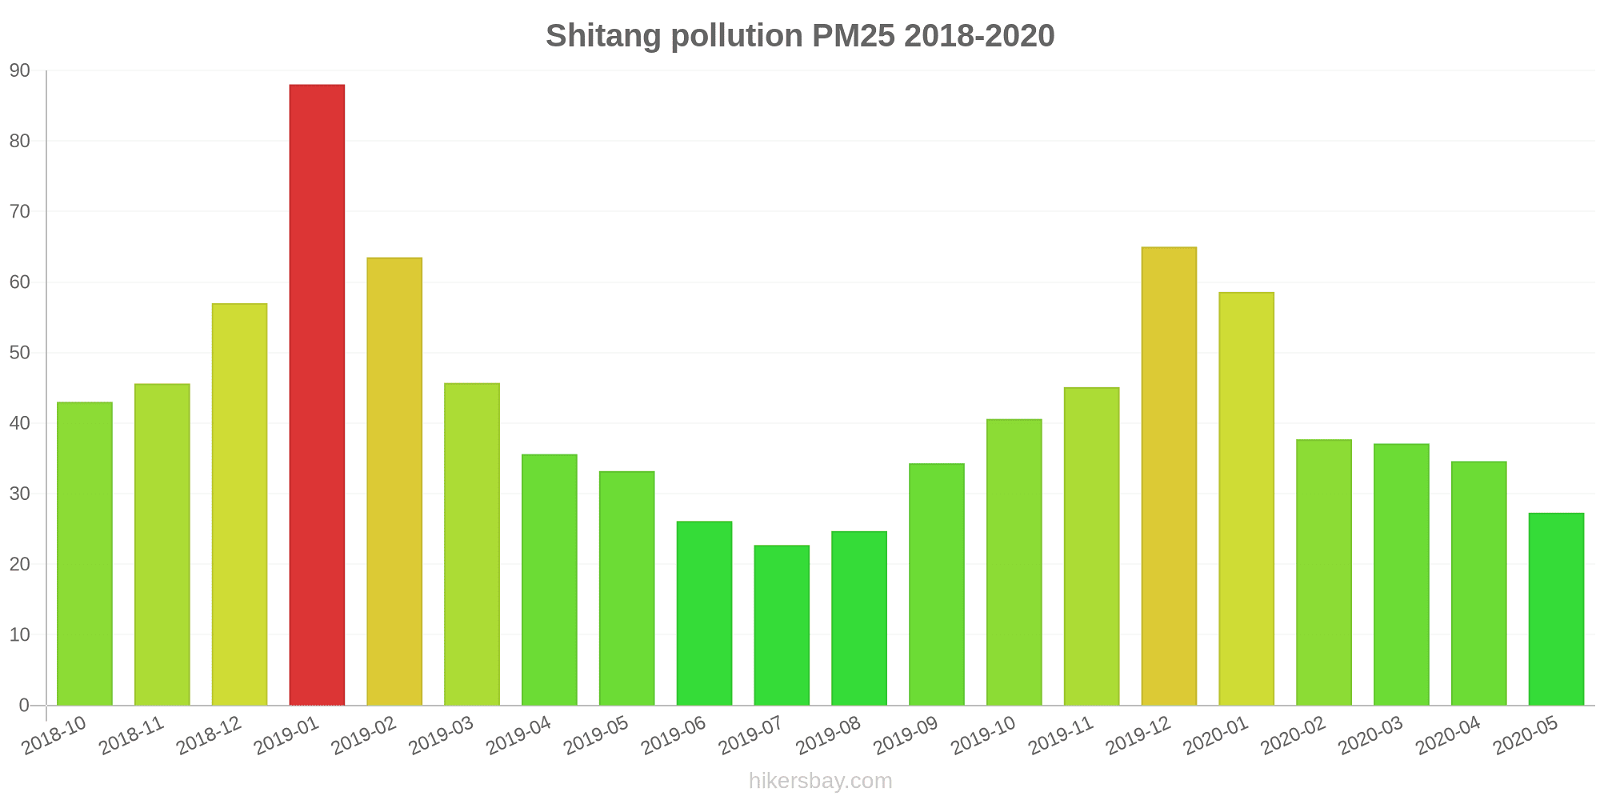
The highest PM2.5 values were recorded: 88 (January 2019).
The lowest level of particulate matter PM2.5 pollution occurs in month: July (23).
How high is the level of NO2? (nitrogen dioxide (NO2))
22 (Good)
What is the level of PM10 today in Shitang? (particulate matter (PM10) suspended dust)
The current level of particulate matter PM10 in Shitang is:
69 (Unhealthy for Sensitive Groups)
The highest PM10 values usually occur in month: 93 (January 2019).
The lowest value of particulate matter PM10 pollution in Shitang is usually recorded in: February (43).
How high is the CO level? (carbon monoxide (CO))
219 (Good)
How is the O3 level today in Shitang? (ozone (O3))
0 (Good)
What is the level of SO2 pollution? (sulfur dioxide (SO2))
8 (Good)
Current data Friday, May 27, 2022, 3:00 PM
PM2,5 61 (Unhealthy)
NO2 22 (Good)
PM10 69 (Unhealthy for Sensitive Groups)
CO 219 (Good)
O3 0 (Good)
SO2 8 (Good)
Data on air pollution from recent days in Shitang
index
2022-05-27
pm25
28
Moderate
no2
22
Good
pm10
35
Moderate
co
579
Good
o3
22
Good
so2
5
Good
data source »
Air pollution in Shitang from October 2018 to May 2020
index
2020-05
2020-04
2020-03
2020-02
2020-01
2019-12
2019-11
2019-10
2019-09
2019-08
2019-07
2019-06
2019-05
2019-04
2019-03
2019-02
2019-01
2018-12
2018-11
2018-10
pm25
27 (Moderate)
35 (Moderate)
37 (Unhealthy for Sensitive Groups)
38 (Unhealthy for Sensitive Groups)
59 (Unhealthy)
65 (Unhealthy)
45 (Unhealthy for Sensitive Groups)
41 (Unhealthy for Sensitive Groups)
34 (Moderate)
25 (Moderate)
23 (Moderate)
26 (Moderate)
33 (Moderate)
36 (Unhealthy for Sensitive Groups)
46 (Unhealthy for Sensitive Groups)
64 (Unhealthy)
88 (Very Unhealthy)
57 (Unhealthy)
46 (Unhealthy for Sensitive Groups)
43 (Unhealthy for Sensitive Groups)
co
712 (Good)
673 (Good)
760 (Good)
680 (Good)
887 (Good)
798 (Good)
801 (Good)
854 (Good)
715 (Good)
761 (Good)
623 (Good)
745 (Good)
689 (Good)
765 (Good)
741 (Good)
972 (Good)
1 (Good)
833 (Good)
856 (Good)
705 (Good)
no2
23 (Good)
30 (Good)
30 (Good)
20 (Good)
32 (Good)
45 (Moderate)
39 (Good)
31 (Good)
20 (Good)
15 (Good)
16 (Good)
24 (Good)
29 (Good)
31 (Good)
39 (Good)
24 (Good)
41 (Moderate)
35 (Good)
40 (Good)
44 (Moderate)
o3
140 (Unhealthy for Sensitive Groups)
140 (Unhealthy for Sensitive Groups)
100 (Moderate)
85 (Moderate)
71 (Moderate)
69 (Good)
109 (Moderate)
131 (Unhealthy for Sensitive Groups)
182 (Very Unhealthy)
166 (Unhealthy)
145 (Unhealthy for Sensitive Groups)
162 (Unhealthy)
163 (Unhealthy)
129 (Unhealthy for Sensitive Groups)
116 (Moderate)
64 (Good)
58 (Good)
56 (Good)
86 (Moderate)
115 (Moderate)
pm10
56 (Unhealthy for Sensitive Groups)
59 (Unhealthy for Sensitive Groups)
54 (Unhealthy for Sensitive Groups)
43 (Moderate)
66 (Unhealthy for Sensitive Groups)
75 (Unhealthy for Sensitive Groups)
76 (Unhealthy for Sensitive Groups)
71 (Unhealthy for Sensitive Groups)
58 (Unhealthy for Sensitive Groups)
45 (Moderate)
46 (Moderate)
52 (Unhealthy for Sensitive Groups)
71 (Unhealthy for Sensitive Groups)
57 (Unhealthy for Sensitive Groups)
70 (Unhealthy for Sensitive Groups)
78 (Unhealthy for Sensitive Groups)
93 (Unhealthy)
77 (Unhealthy for Sensitive Groups)
72 (Unhealthy for Sensitive Groups)
72 (Unhealthy for Sensitive Groups)
so2
9.4 (Good)
11 (Good)
8.9 (Good)
8.1 (Good)
7.1 (Good)
9.3 (Good)
9.5 (Good)
10 (Good)
8.6 (Good)
7.8 (Good)
6.4 (Good)
6.7 (Good)
7 (Good)
6.4 (Good)
7 (Good)
6.1 (Good)
7.4 (Good)
8 (Good)
6.8 (Good)
9.1 (Good)
data source »
市人大
Friday, May 27, 2022, 3:00 PM
PM2,5 61 (Unhealthy)
particulate matter (PM2.5) dust
NO2 22 (Good)
nitrogen dioxide (NO2)
PM10 69 (Unhealthy for Sensitive Groups)
particulate matter (PM10) suspended dust
CO 219 (Good)
carbon monoxide (CO)
O3 0.05 (Good)
ozone (O3)
SO2 7.7 (Good)
sulfur dioxide (SO2)
市人大
index
2022-05-27
pm25
28
no2
22
pm10
35
co
579
o3
22
so2
4.6
市人大
2018-10 2020-05

index
2020-05
2020-04
2020-03
2020-02
2020-01
2019-12
2019-11
2019-10
2019-09
2019-08
2019-07
2019-06
2019-05
2019-04
2019-03
2019-02
2019-01
2018-12
2018-11
2018-10
pm25
27
35
37
38
59
65
45
41
34
25
23
26
33
36
46
64
88
57
46
43
co
712
673
760
680
887
798
801
854
715
761
623
745
689
765
741
972
1
833
856
705
no2
23
30
30
20
32
45
39
31
20
15
16
24
29
31
39
24
41
35
40
44
o3
140
140
100
85
71
69
109
131
182
166
145
162
163
129
116
64
58
56
86
115
pm10
56
59
54
43
66
75
76
71
58
45
46
52
71
57
70
78
93
77
72
72
so2
9.4
11
8.9
8.1
7.1
9.3
9.5
10
8.6
7.8
6.4
6.7
7
6.4
7
6.1
7.4
8
6.8
9.1
* Pollution data source:
https://openaq.org
(ChinaAQIData)
The data is licensed under CC-By 4.0
PM2,5 61 (Unhealthy)
NO2 22 (Good)
PM10 69 (Unhealthy for Sensitive Groups)
CO 219 (Good)
O3 0 (Good)
SO2 8 (Good)
Data on air pollution from recent days in Shitang
| index | 2022-05-27 |
|---|---|
| pm25 | 28 Moderate |
| no2 | 22 Good |
| pm10 | 35 Moderate |
| co | 579 Good |
| o3 | 22 Good |
| so2 | 5 Good |

| index | 2020-05 | 2020-04 | 2020-03 | 2020-02 | 2020-01 | 2019-12 | 2019-11 | 2019-10 | 2019-09 | 2019-08 | 2019-07 | 2019-06 | 2019-05 | 2019-04 | 2019-03 | 2019-02 | 2019-01 | 2018-12 | 2018-11 | 2018-10 |
|---|---|---|---|---|---|---|---|---|---|---|---|---|---|---|---|---|---|---|---|---|
| pm25 | 27 (Moderate) | 35 (Moderate) | 37 (Unhealthy for Sensitive Groups) | 38 (Unhealthy for Sensitive Groups) | 59 (Unhealthy) | 65 (Unhealthy) | 45 (Unhealthy for Sensitive Groups) | 41 (Unhealthy for Sensitive Groups) | 34 (Moderate) | 25 (Moderate) | 23 (Moderate) | 26 (Moderate) | 33 (Moderate) | 36 (Unhealthy for Sensitive Groups) | 46 (Unhealthy for Sensitive Groups) | 64 (Unhealthy) | 88 (Very Unhealthy) | 57 (Unhealthy) | 46 (Unhealthy for Sensitive Groups) | 43 (Unhealthy for Sensitive Groups) |
| co | 712 (Good) | 673 (Good) | 760 (Good) | 680 (Good) | 887 (Good) | 798 (Good) | 801 (Good) | 854 (Good) | 715 (Good) | 761 (Good) | 623 (Good) | 745 (Good) | 689 (Good) | 765 (Good) | 741 (Good) | 972 (Good) | 1 (Good) | 833 (Good) | 856 (Good) | 705 (Good) |
| no2 | 23 (Good) | 30 (Good) | 30 (Good) | 20 (Good) | 32 (Good) | 45 (Moderate) | 39 (Good) | 31 (Good) | 20 (Good) | 15 (Good) | 16 (Good) | 24 (Good) | 29 (Good) | 31 (Good) | 39 (Good) | 24 (Good) | 41 (Moderate) | 35 (Good) | 40 (Good) | 44 (Moderate) |
| o3 | 140 (Unhealthy for Sensitive Groups) | 140 (Unhealthy for Sensitive Groups) | 100 (Moderate) | 85 (Moderate) | 71 (Moderate) | 69 (Good) | 109 (Moderate) | 131 (Unhealthy for Sensitive Groups) | 182 (Very Unhealthy) | 166 (Unhealthy) | 145 (Unhealthy for Sensitive Groups) | 162 (Unhealthy) | 163 (Unhealthy) | 129 (Unhealthy for Sensitive Groups) | 116 (Moderate) | 64 (Good) | 58 (Good) | 56 (Good) | 86 (Moderate) | 115 (Moderate) |
| pm10 | 56 (Unhealthy for Sensitive Groups) | 59 (Unhealthy for Sensitive Groups) | 54 (Unhealthy for Sensitive Groups) | 43 (Moderate) | 66 (Unhealthy for Sensitive Groups) | 75 (Unhealthy for Sensitive Groups) | 76 (Unhealthy for Sensitive Groups) | 71 (Unhealthy for Sensitive Groups) | 58 (Unhealthy for Sensitive Groups) | 45 (Moderate) | 46 (Moderate) | 52 (Unhealthy for Sensitive Groups) | 71 (Unhealthy for Sensitive Groups) | 57 (Unhealthy for Sensitive Groups) | 70 (Unhealthy for Sensitive Groups) | 78 (Unhealthy for Sensitive Groups) | 93 (Unhealthy) | 77 (Unhealthy for Sensitive Groups) | 72 (Unhealthy for Sensitive Groups) | 72 (Unhealthy for Sensitive Groups) |
| so2 | 9.4 (Good) | 11 (Good) | 8.9 (Good) | 8.1 (Good) | 7.1 (Good) | 9.3 (Good) | 9.5 (Good) | 10 (Good) | 8.6 (Good) | 7.8 (Good) | 6.4 (Good) | 6.7 (Good) | 7 (Good) | 6.4 (Good) | 7 (Good) | 6.1 (Good) | 7.4 (Good) | 8 (Good) | 6.8 (Good) | 9.1 (Good) |
PM2,5 61 (Unhealthy)
particulate matter (PM2.5) dustNO2 22 (Good)
nitrogen dioxide (NO2)PM10 69 (Unhealthy for Sensitive Groups)
particulate matter (PM10) suspended dustCO 219 (Good)
carbon monoxide (CO)O3 0.05 (Good)
ozone (O3)SO2 7.7 (Good)
sulfur dioxide (SO2)市人大
| index | 2022-05-27 |
|---|---|
| pm25 | 28 |
| no2 | 22 |
| pm10 | 35 |
| co | 579 |
| o3 | 22 |
| so2 | 4.6 |
市人大

| index | 2020-05 | 2020-04 | 2020-03 | 2020-02 | 2020-01 | 2019-12 | 2019-11 | 2019-10 | 2019-09 | 2019-08 | 2019-07 | 2019-06 | 2019-05 | 2019-04 | 2019-03 | 2019-02 | 2019-01 | 2018-12 | 2018-11 | 2018-10 |
|---|---|---|---|---|---|---|---|---|---|---|---|---|---|---|---|---|---|---|---|---|
| pm25 | 27 | 35 | 37 | 38 | 59 | 65 | 45 | 41 | 34 | 25 | 23 | 26 | 33 | 36 | 46 | 64 | 88 | 57 | 46 | 43 |
| co | 712 | 673 | 760 | 680 | 887 | 798 | 801 | 854 | 715 | 761 | 623 | 745 | 689 | 765 | 741 | 972 | 1 | 833 | 856 | 705 |
| no2 | 23 | 30 | 30 | 20 | 32 | 45 | 39 | 31 | 20 | 15 | 16 | 24 | 29 | 31 | 39 | 24 | 41 | 35 | 40 | 44 |
| o3 | 140 | 140 | 100 | 85 | 71 | 69 | 109 | 131 | 182 | 166 | 145 | 162 | 163 | 129 | 116 | 64 | 58 | 56 | 86 | 115 |
| pm10 | 56 | 59 | 54 | 43 | 66 | 75 | 76 | 71 | 58 | 45 | 46 | 52 | 71 | 57 | 70 | 78 | 93 | 77 | 72 | 72 |
| so2 | 9.4 | 11 | 8.9 | 8.1 | 7.1 | 9.3 | 9.5 | 10 | 8.6 | 7.8 | 6.4 | 6.7 | 7 | 6.4 | 7 | 6.1 | 7.4 | 8 | 6.8 | 9.1 |