Air Pollution in Xinjian: Real-time Air Quality Index and smog alert.
Pollution and air quality forecast for Xinjian. Today is Tuesday, June 16, 2026. The following air pollution values have been recorded for Xinjian:- particulate matter (PM2.5) dust - 61 (Unhealthy)
- nitrogen dioxide (NO2) - 22 (Good)
- particulate matter (PM10) suspended dust - 69 (Unhealthy for Sensitive Groups)
- carbon monoxide (CO) - 219 (Good)
- ozone (O3) - 0 (Good)
- sulfur dioxide (SO2) - 8 (Good)

What is the air quality in Xinjian today? Is the air polluted in Xinjian?. Is there smog?
What is the current level of PM2.5 in Xinjian? (particulate matter (PM2.5) dust)
Today's PM2.5 level is:
61 (Unhealthy)
For comparison, the highest level of PM2.5 in Xinjian in the last 7 days was: 28 (Friday, May 27, 2022) and the lowest: 28 (Friday, May 27, 2022).
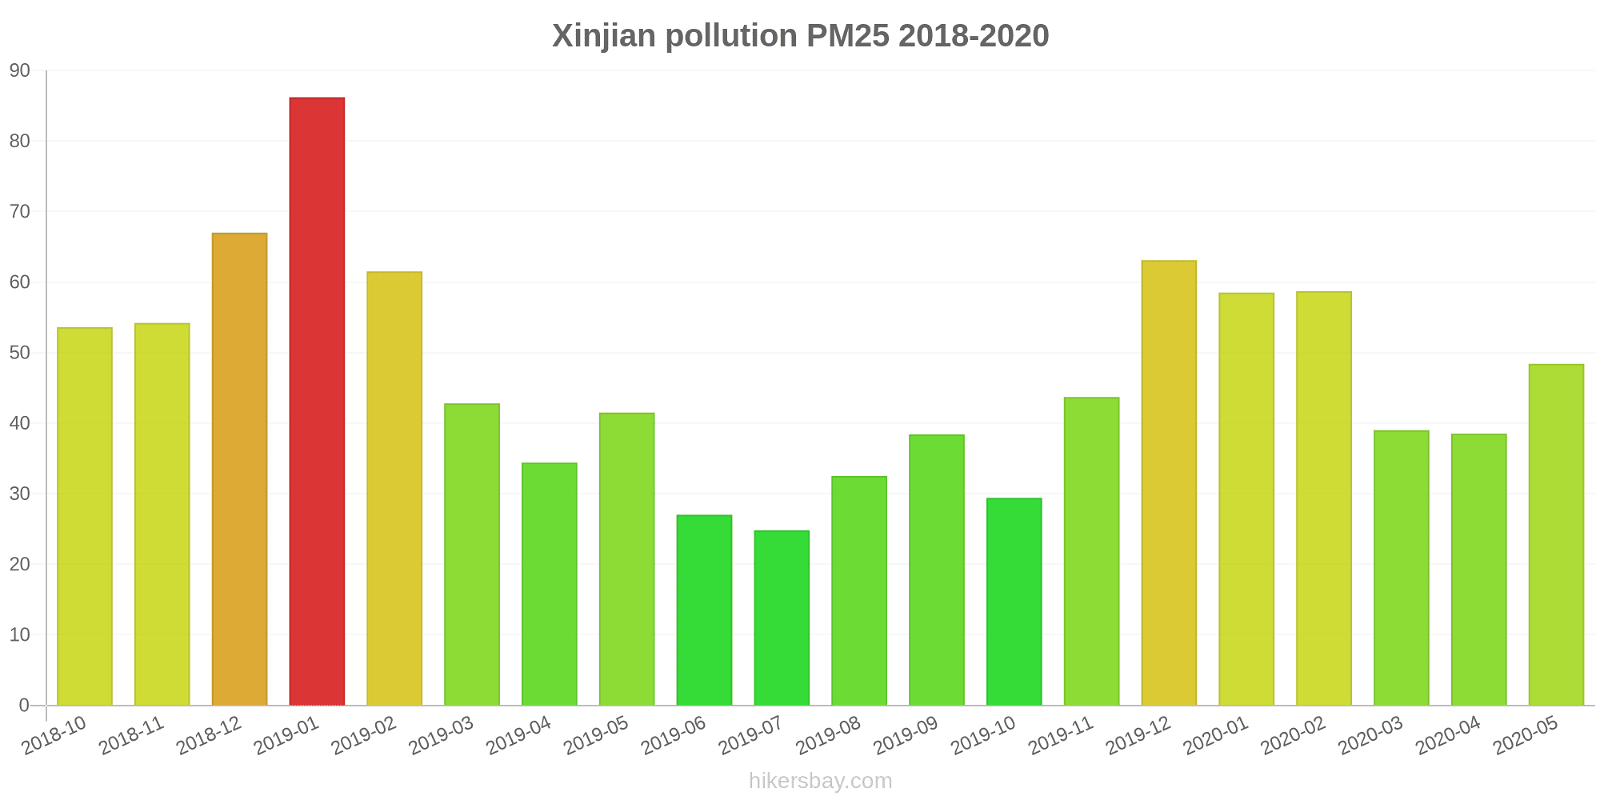
The highest PM2.5 values were recorded: 86 (January 2019).
The lowest level of particulate matter PM2.5 pollution occurs in month: July (25).
How high is the level of NO2? (nitrogen dioxide (NO2))
22 (Good)
What is the level of PM10 today in Xinjian? (particulate matter (PM10) suspended dust)
The current level of particulate matter PM10 in Xinjian is:
69 (Unhealthy for Sensitive Groups)
The highest PM10 values usually occur in month: 111 (January 2019).
The lowest value of particulate matter PM10 pollution in Xinjian is usually recorded in: July (37).
How high is the CO level? (carbon monoxide (CO))
219 (Good)
How is the O3 level today in Xinjian? (ozone (O3))
0 (Good)
What is the level of SO2 pollution? (sulfur dioxide (SO2))
8 (Good)
Current data Friday, May 27, 2022, 3:00 PM
PM2,5 61 (Unhealthy)
NO2 22 (Good)
PM10 69 (Unhealthy for Sensitive Groups)
CO 219 (Good)
O3 0 (Good)
SO2 8 (Good)
Data on air pollution from recent days in Xinjian
index
2022-05-27
pm25
28
Moderate
no2
22
Good
pm10
35
Moderate
co
579
Good
o3
22
Good
so2
5
Good
data source »
Air pollution in Xinjian from October 2018 to May 2020
index
2020-05
2020-04
2020-03
2020-02
2020-01
2019-12
2019-11
2019-10
2019-09
2019-08
2019-07
2019-06
2019-05
2019-04
2019-03
2019-02
2019-01
2018-12
2018-11
2018-10
pm25
48 (Unhealthy for Sensitive Groups)
39 (Unhealthy for Sensitive Groups)
39 (Unhealthy for Sensitive Groups)
59 (Unhealthy)
59 (Unhealthy)
63 (Unhealthy)
44 (Unhealthy for Sensitive Groups)
29 (Moderate)
38 (Unhealthy for Sensitive Groups)
33 (Moderate)
25 (Moderate)
27 (Moderate)
42 (Unhealthy for Sensitive Groups)
34 (Moderate)
43 (Unhealthy for Sensitive Groups)
62 (Unhealthy)
86 (Very Unhealthy)
67 (Unhealthy)
54 (Unhealthy for Sensitive Groups)
54 (Unhealthy for Sensitive Groups)
co
568 (Good)
556 (Good)
568 (Good)
699 (Good)
914 (Good)
844 (Good)
714 (Good)
672 (Good)
771 (Good)
597 (Good)
524 (Good)
749 (Good)
757 (Good)
859 (Good)
784 (Good)
976 (Good)
1 (Good)
871 (Good)
783 (Good)
816 (Good)
no2
39 (Good)
32 (Good)
23 (Good)
17 (Good)
23 (Good)
29 (Good)
27 (Good)
24 (Good)
19 (Good)
20 (Good)
20 (Good)
21 (Good)
20 (Good)
27 (Good)
27 (Good)
23 (Good)
33 (Good)
28 (Good)
32 (Good)
35 (Good)
o3
142 (Unhealthy for Sensitive Groups)
109 (Moderate)
104 (Moderate)
78 (Moderate)
70 (Moderate)
63 (Good)
58 (Good)
77 (Moderate)
88 (Moderate)
138 (Unhealthy for Sensitive Groups)
108 (Moderate)
110 (Moderate)
119 (Moderate)
123 (Unhealthy for Sensitive Groups)
95 (Moderate)
76 (Moderate)
46 (Good)
42 (Good)
63 (Good)
80 (Moderate)
pm10
83 (Unhealthy)
57 (Unhealthy for Sensitive Groups)
65 (Unhealthy for Sensitive Groups)
71 (Unhealthy for Sensitive Groups)
73 (Unhealthy for Sensitive Groups)
86 (Unhealthy)
67 (Unhealthy for Sensitive Groups)
43 (Moderate)
55 (Unhealthy for Sensitive Groups)
57 (Unhealthy for Sensitive Groups)
37 (Moderate)
38 (Moderate)
65 (Unhealthy for Sensitive Groups)
56 (Unhealthy for Sensitive Groups)
73 (Unhealthy for Sensitive Groups)
87 (Unhealthy)
111 (Very Unhealthy)
89 (Unhealthy)
70 (Unhealthy for Sensitive Groups)
69 (Unhealthy for Sensitive Groups)
so2
4.7 (Good)
3.7 (Good)
7.3 (Good)
10 (Good)
5.4 (Good)
5.3 (Good)
4.6 (Good)
6.5 (Good)
5.8 (Good)
3.5 (Good)
2.9 (Good)
6.4 (Good)
6.4 (Good)
4.4 (Good)
5.5 (Good)
6.1 (Good)
5.6 (Good)
5 (Good)
3.7 (Good)
7.2 (Good)
data source »
南充市委
Friday, May 27, 2022, 3:00 PM
PM2,5 61 (Unhealthy)
particulate matter (PM2.5) dust
NO2 22 (Good)
nitrogen dioxide (NO2)
PM10 69 (Unhealthy for Sensitive Groups)
particulate matter (PM10) suspended dust
CO 219 (Good)
carbon monoxide (CO)
O3 0.05 (Good)
ozone (O3)
SO2 7.7 (Good)
sulfur dioxide (SO2)
南充市委
index
2022-05-27
pm25
28
no2
22
pm10
35
co
579
o3
22
so2
4.6
南充市委
2018-10 2020-05

index
2020-05
2020-04
2020-03
2020-02
2020-01
2019-12
2019-11
2019-10
2019-09
2019-08
2019-07
2019-06
2019-05
2019-04
2019-03
2019-02
2019-01
2018-12
2018-11
2018-10
pm25
48
39
39
59
59
63
44
29
38
33
25
27
42
34
43
62
86
67
54
54
co
568
556
568
699
914
844
714
672
771
597
524
749
757
859
784
976
1
871
783
816
no2
39
32
23
17
23
29
27
24
19
20
20
21
20
27
27
23
33
28
32
35
o3
142
109
104
78
70
63
58
77
88
138
108
110
119
123
95
76
46
42
63
80
pm10
83
57
65
71
73
86
67
43
55
57
37
38
65
56
73
87
111
89
70
69
so2
4.7
3.7
7.3
10
5.4
5.3
4.6
6.5
5.8
3.5
2.9
6.4
6.4
4.4
5.5
6.1
5.6
5
3.7
7.2
* Pollution data source:
https://openaq.org
(ChinaAQIData)
The data is licensed under CC-By 4.0
PM2,5 61 (Unhealthy)
NO2 22 (Good)
PM10 69 (Unhealthy for Sensitive Groups)
CO 219 (Good)
O3 0 (Good)
SO2 8 (Good)
Data on air pollution from recent days in Xinjian
| index | 2022-05-27 |
|---|---|
| pm25 | 28 Moderate |
| no2 | 22 Good |
| pm10 | 35 Moderate |
| co | 579 Good |
| o3 | 22 Good |
| so2 | 5 Good |

| index | 2020-05 | 2020-04 | 2020-03 | 2020-02 | 2020-01 | 2019-12 | 2019-11 | 2019-10 | 2019-09 | 2019-08 | 2019-07 | 2019-06 | 2019-05 | 2019-04 | 2019-03 | 2019-02 | 2019-01 | 2018-12 | 2018-11 | 2018-10 |
|---|---|---|---|---|---|---|---|---|---|---|---|---|---|---|---|---|---|---|---|---|
| pm25 | 48 (Unhealthy for Sensitive Groups) | 39 (Unhealthy for Sensitive Groups) | 39 (Unhealthy for Sensitive Groups) | 59 (Unhealthy) | 59 (Unhealthy) | 63 (Unhealthy) | 44 (Unhealthy for Sensitive Groups) | 29 (Moderate) | 38 (Unhealthy for Sensitive Groups) | 33 (Moderate) | 25 (Moderate) | 27 (Moderate) | 42 (Unhealthy for Sensitive Groups) | 34 (Moderate) | 43 (Unhealthy for Sensitive Groups) | 62 (Unhealthy) | 86 (Very Unhealthy) | 67 (Unhealthy) | 54 (Unhealthy for Sensitive Groups) | 54 (Unhealthy for Sensitive Groups) |
| co | 568 (Good) | 556 (Good) | 568 (Good) | 699 (Good) | 914 (Good) | 844 (Good) | 714 (Good) | 672 (Good) | 771 (Good) | 597 (Good) | 524 (Good) | 749 (Good) | 757 (Good) | 859 (Good) | 784 (Good) | 976 (Good) | 1 (Good) | 871 (Good) | 783 (Good) | 816 (Good) |
| no2 | 39 (Good) | 32 (Good) | 23 (Good) | 17 (Good) | 23 (Good) | 29 (Good) | 27 (Good) | 24 (Good) | 19 (Good) | 20 (Good) | 20 (Good) | 21 (Good) | 20 (Good) | 27 (Good) | 27 (Good) | 23 (Good) | 33 (Good) | 28 (Good) | 32 (Good) | 35 (Good) |
| o3 | 142 (Unhealthy for Sensitive Groups) | 109 (Moderate) | 104 (Moderate) | 78 (Moderate) | 70 (Moderate) | 63 (Good) | 58 (Good) | 77 (Moderate) | 88 (Moderate) | 138 (Unhealthy for Sensitive Groups) | 108 (Moderate) | 110 (Moderate) | 119 (Moderate) | 123 (Unhealthy for Sensitive Groups) | 95 (Moderate) | 76 (Moderate) | 46 (Good) | 42 (Good) | 63 (Good) | 80 (Moderate) |
| pm10 | 83 (Unhealthy) | 57 (Unhealthy for Sensitive Groups) | 65 (Unhealthy for Sensitive Groups) | 71 (Unhealthy for Sensitive Groups) | 73 (Unhealthy for Sensitive Groups) | 86 (Unhealthy) | 67 (Unhealthy for Sensitive Groups) | 43 (Moderate) | 55 (Unhealthy for Sensitive Groups) | 57 (Unhealthy for Sensitive Groups) | 37 (Moderate) | 38 (Moderate) | 65 (Unhealthy for Sensitive Groups) | 56 (Unhealthy for Sensitive Groups) | 73 (Unhealthy for Sensitive Groups) | 87 (Unhealthy) | 111 (Very Unhealthy) | 89 (Unhealthy) | 70 (Unhealthy for Sensitive Groups) | 69 (Unhealthy for Sensitive Groups) |
| so2 | 4.7 (Good) | 3.7 (Good) | 7.3 (Good) | 10 (Good) | 5.4 (Good) | 5.3 (Good) | 4.6 (Good) | 6.5 (Good) | 5.8 (Good) | 3.5 (Good) | 2.9 (Good) | 6.4 (Good) | 6.4 (Good) | 4.4 (Good) | 5.5 (Good) | 6.1 (Good) | 5.6 (Good) | 5 (Good) | 3.7 (Good) | 7.2 (Good) |
PM2,5 61 (Unhealthy)
particulate matter (PM2.5) dustNO2 22 (Good)
nitrogen dioxide (NO2)PM10 69 (Unhealthy for Sensitive Groups)
particulate matter (PM10) suspended dustCO 219 (Good)
carbon monoxide (CO)O3 0.05 (Good)
ozone (O3)SO2 7.7 (Good)
sulfur dioxide (SO2)南充市委
| index | 2022-05-27 |
|---|---|
| pm25 | 28 |
| no2 | 22 |
| pm10 | 35 |
| co | 579 |
| o3 | 22 |
| so2 | 4.6 |
南充市委

| index | 2020-05 | 2020-04 | 2020-03 | 2020-02 | 2020-01 | 2019-12 | 2019-11 | 2019-10 | 2019-09 | 2019-08 | 2019-07 | 2019-06 | 2019-05 | 2019-04 | 2019-03 | 2019-02 | 2019-01 | 2018-12 | 2018-11 | 2018-10 |
|---|---|---|---|---|---|---|---|---|---|---|---|---|---|---|---|---|---|---|---|---|
| pm25 | 48 | 39 | 39 | 59 | 59 | 63 | 44 | 29 | 38 | 33 | 25 | 27 | 42 | 34 | 43 | 62 | 86 | 67 | 54 | 54 |
| co | 568 | 556 | 568 | 699 | 914 | 844 | 714 | 672 | 771 | 597 | 524 | 749 | 757 | 859 | 784 | 976 | 1 | 871 | 783 | 816 |
| no2 | 39 | 32 | 23 | 17 | 23 | 29 | 27 | 24 | 19 | 20 | 20 | 21 | 20 | 27 | 27 | 23 | 33 | 28 | 32 | 35 |
| o3 | 142 | 109 | 104 | 78 | 70 | 63 | 58 | 77 | 88 | 138 | 108 | 110 | 119 | 123 | 95 | 76 | 46 | 42 | 63 | 80 |
| pm10 | 83 | 57 | 65 | 71 | 73 | 86 | 67 | 43 | 55 | 57 | 37 | 38 | 65 | 56 | 73 | 87 | 111 | 89 | 70 | 69 |
| so2 | 4.7 | 3.7 | 7.3 | 10 | 5.4 | 5.3 | 4.6 | 6.5 | 5.8 | 3.5 | 2.9 | 6.4 | 6.4 | 4.4 | 5.5 | 6.1 | 5.6 | 5 | 3.7 | 7.2 |