Air Pollution in Wufeng: Real-time Air Quality Index and smog alert.
Pollution and air quality forecast for Wufeng. Today is Tuesday, June 16, 2026. The following air pollution values have been recorded for Wufeng:- particulate matter (PM2.5) dust - 61 (Unhealthy)
- nitrogen dioxide (NO2) - 22 (Good)
- particulate matter (PM10) suspended dust - 69 (Unhealthy for Sensitive Groups)
- carbon monoxide (CO) - 219 (Good)
- ozone (O3) - 0 (Good)
- sulfur dioxide (SO2) - 8 (Good)

What is the air quality in Wufeng today? Is the air polluted in Wufeng?. Is there smog?
What is the current level of PM2.5 in Wufeng? (particulate matter (PM2.5) dust)
Today's PM2.5 level is:
61 (Unhealthy)
For comparison, the highest level of PM2.5 in Wufeng in the last 7 days was: 28 (Friday, May 27, 2022) and the lowest: 28 (Friday, May 27, 2022).
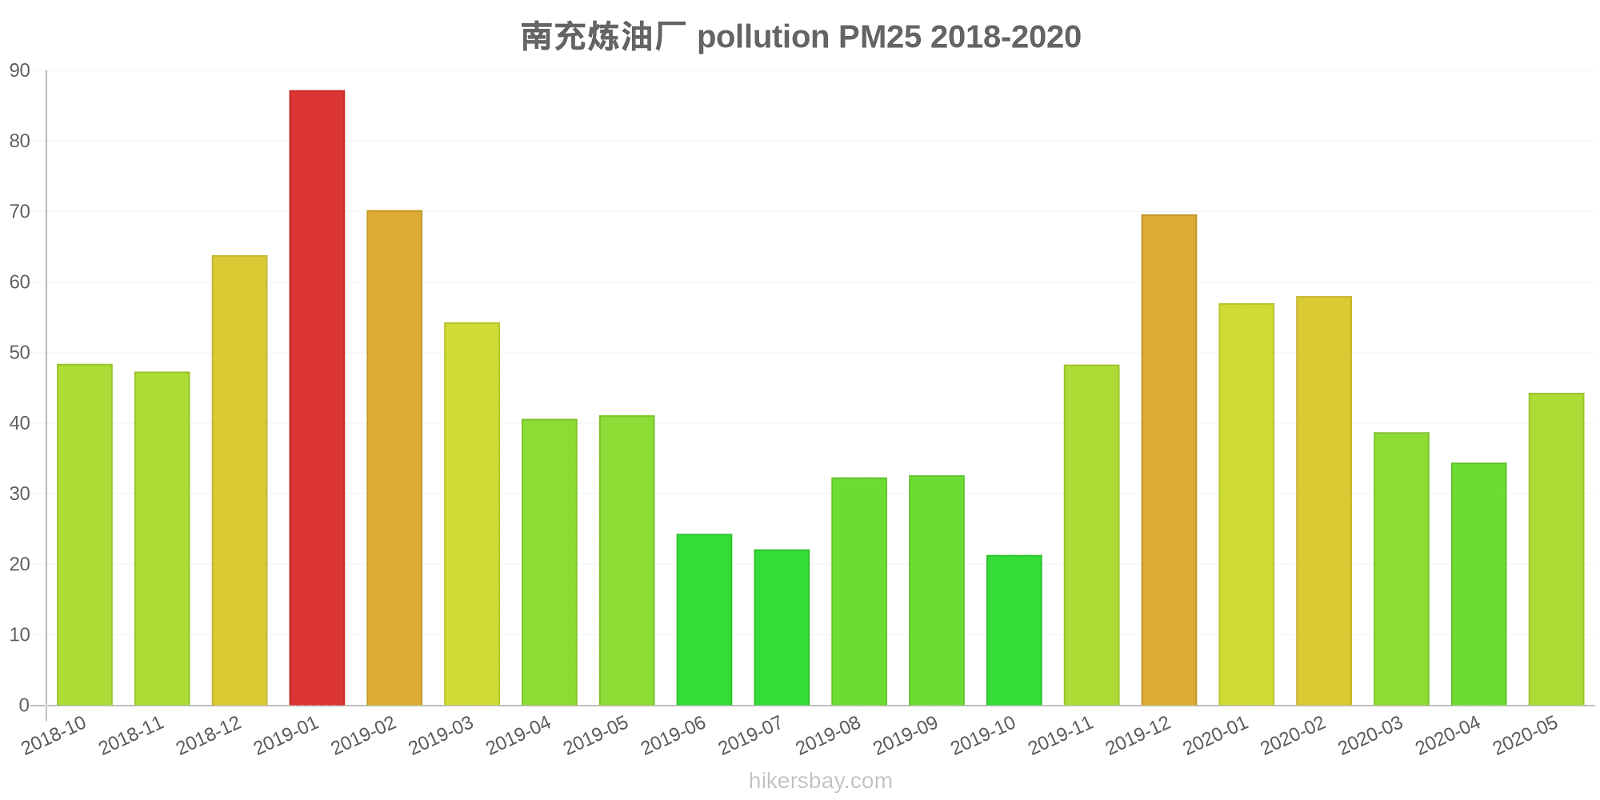
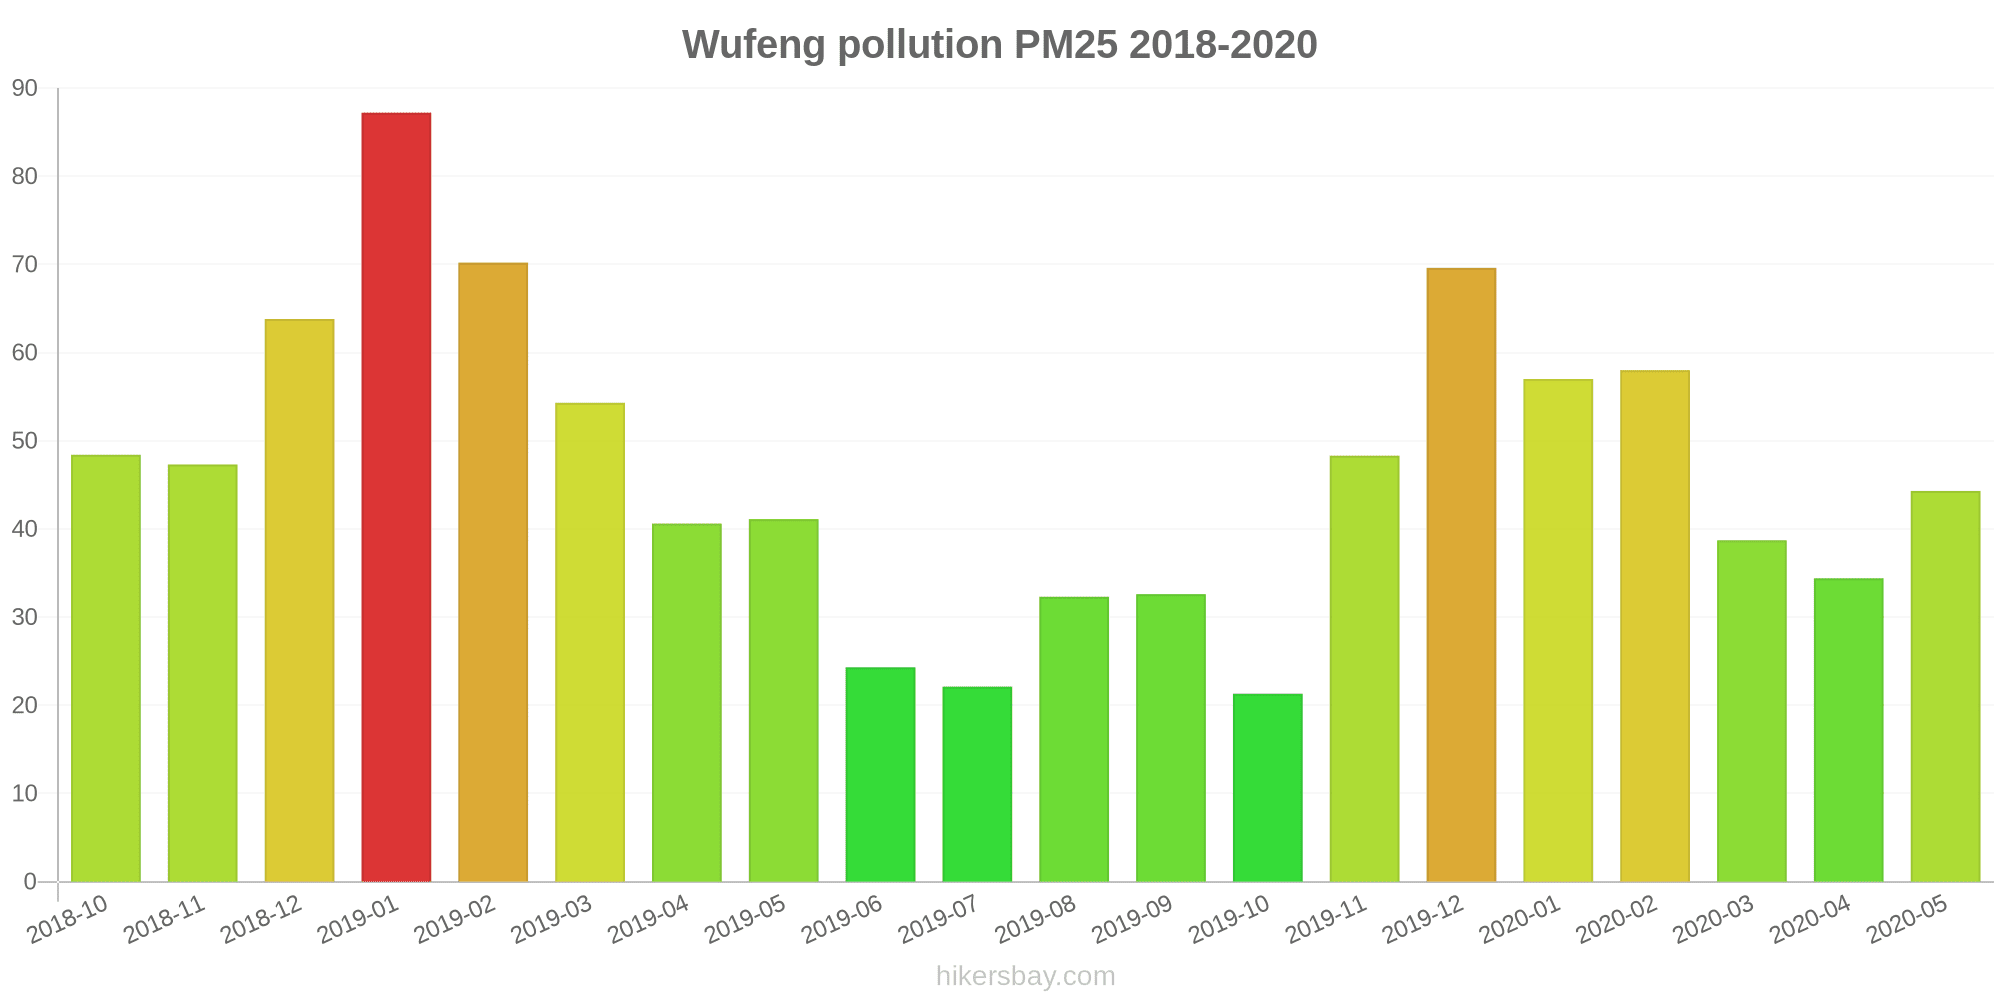
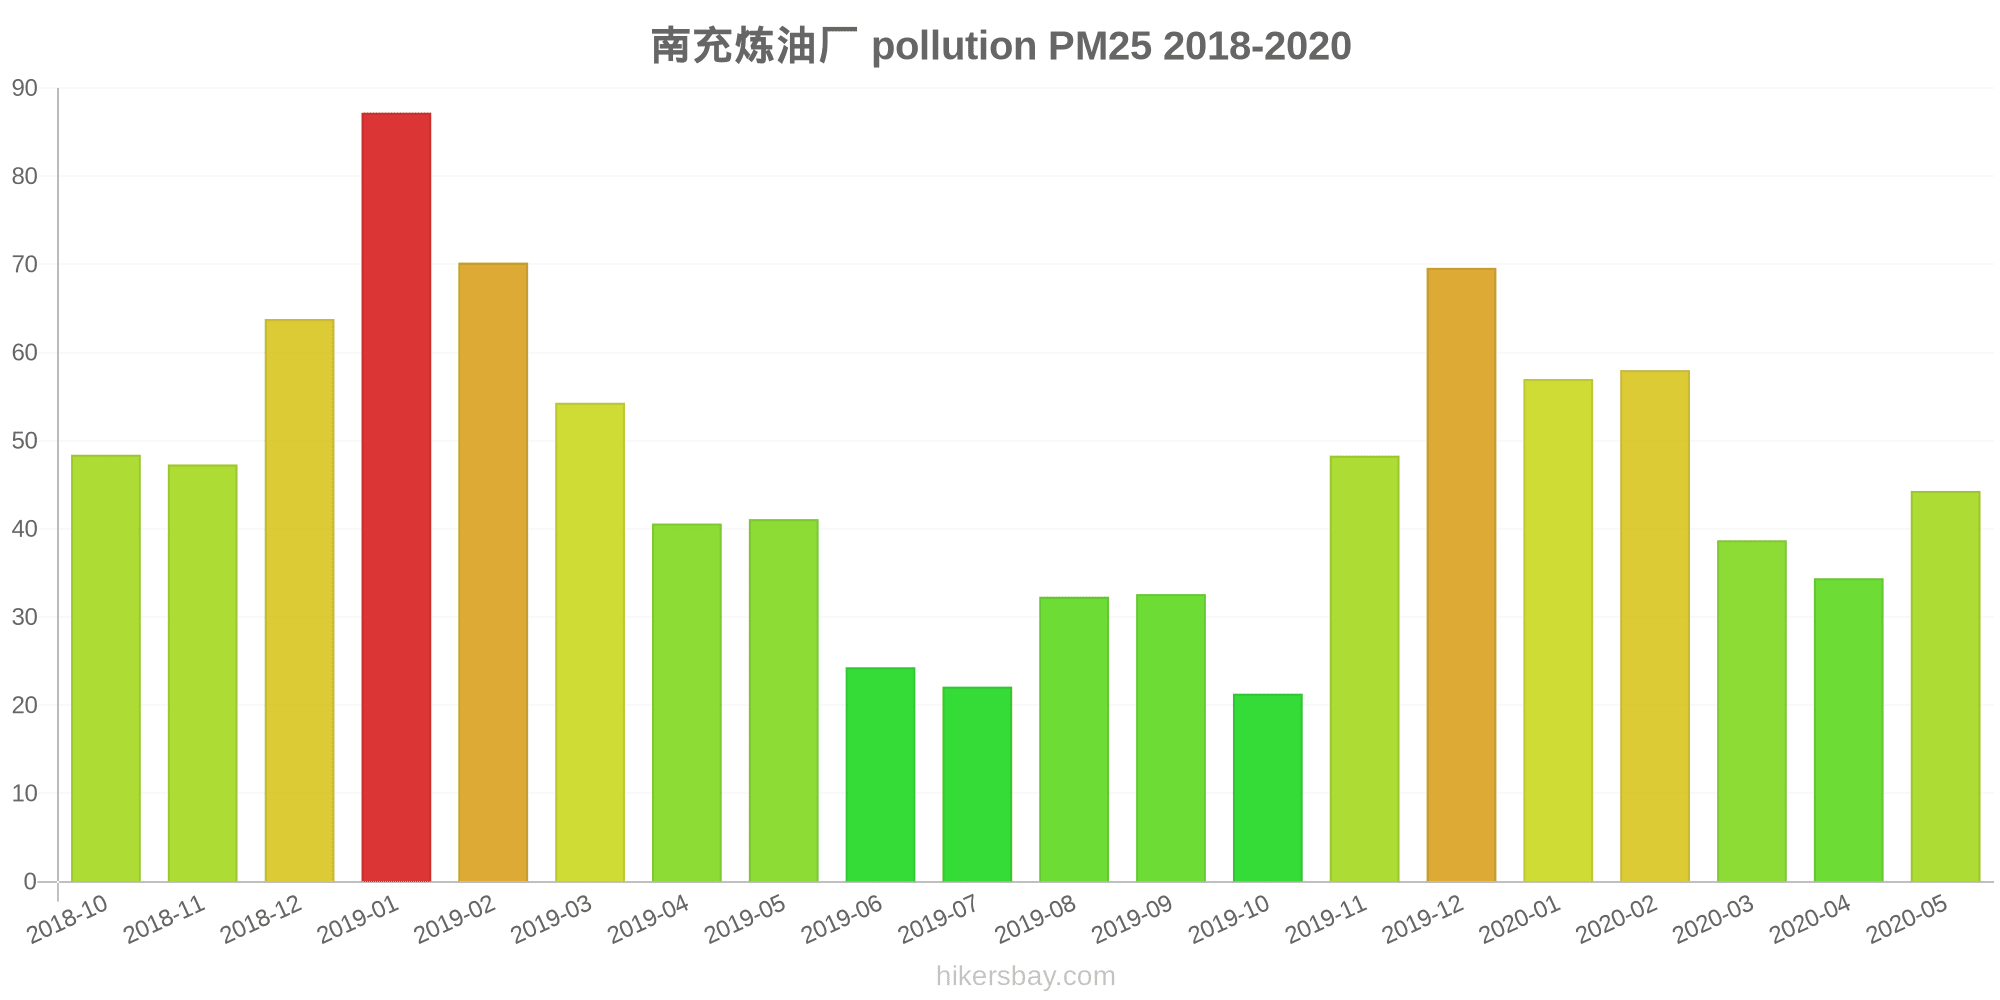
The highest PM2.5 values were recorded: 87 (January 2019).
The lowest level of particulate matter PM2.5 pollution occurs in month: October (21).
How high is the level of NO2? (nitrogen dioxide (NO2))
22 (Good)
What is the level of PM10 today in Wufeng? (particulate matter (PM10) suspended dust)
The current level of particulate matter PM10 in Wufeng is:
69 (Unhealthy for Sensitive Groups)
The highest PM10 values usually occur in month: 118 (January 2019).
The lowest value of particulate matter PM10 pollution in Wufeng is usually recorded in: October (39).
How high is the CO level? (carbon monoxide (CO))
219 (Good)
How is the O3 level today in Wufeng? (ozone (O3))
0 (Good)
What is the level of SO2 pollution? (sulfur dioxide (SO2))
8 (Good)
Current data Friday, May 27, 2022, 3:00 PM
PM2,5 61 (Unhealthy)
NO2 22 (Good)
PM10 69 (Unhealthy for Sensitive Groups)
CO 219 (Good)
O3 0 (Good)
SO2 8 (Good)
Data on air pollution from recent days in Wufeng
index
2022-05-27
pm25
28
Moderate
no2
22
Good
pm10
35
Moderate
co
579
Good
o3
22
Good
so2
5
Good
data source »
Air pollution in Wufeng from October 2018 to May 2020

index
2020-05
2020-04
2020-03
2020-02
2020-01
2019-12
2019-11
2019-10
2019-09
2019-08
2019-07
2019-06
2019-05
2019-04
2019-03
2019-02
2019-01
2018-12
2018-11
2018-10
pm25
44 (Unhealthy for Sensitive Groups)
34 (Moderate)
39 (Unhealthy for Sensitive Groups)
58 (Unhealthy)
57 (Unhealthy)
70 (Unhealthy)
48 (Unhealthy for Sensitive Groups)
21 (Moderate)
33 (Moderate)
32 (Moderate)
22 (Moderate)
24 (Moderate)
41 (Unhealthy for Sensitive Groups)
41 (Unhealthy for Sensitive Groups)
54 (Unhealthy for Sensitive Groups)
70 (Unhealthy)
87 (Very Unhealthy)
64 (Unhealthy)
47 (Unhealthy for Sensitive Groups)
48 (Unhealthy for Sensitive Groups)
co
607 (Good)
569 (Good)
560 (Good)
647 (Good)
863 (Good)
803 (Good)
656 (Good)
544 (Good)
500 (Good)
401 (Good)
387 (Good)
474 (Good)
503 (Good)
603 (Good)
650 (Good)
794 (Good)
899 (Good)
826 (Good)
678 (Good)
737 (Good)
no2
28 (Good)
29 (Good)
30 (Good)
21 (Good)
30 (Good)
39 (Good)
31 (Good)
24 (Good)
28 (Good)
29 (Good)
25 (Good)
24 (Good)
21 (Good)
24 (Good)
28 (Good)
20 (Good)
36 (Good)
28 (Good)
32 (Good)
27 (Good)
o3
128 (Unhealthy for Sensitive Groups)
104 (Moderate)
92 (Moderate)
75 (Moderate)
54 (Good)
47 (Good)
57 (Good)
86 (Moderate)
94 (Moderate)
118 (Moderate)
100 (Moderate)
121 (Unhealthy for Sensitive Groups)
119 (Moderate)
120 (Unhealthy for Sensitive Groups)
99 (Moderate)
80 (Moderate)
68 (Good)
60 (Good)
85 (Moderate)
80 (Moderate)
pm10
81 (Unhealthy)
59 (Unhealthy for Sensitive Groups)
65 (Unhealthy for Sensitive Groups)
74 (Unhealthy for Sensitive Groups)
75 (Unhealthy for Sensitive Groups)
87 (Unhealthy)
79 (Unhealthy for Sensitive Groups)
39 (Moderate)
52 (Unhealthy for Sensitive Groups)
59 (Unhealthy for Sensitive Groups)
39 (Moderate)
47 (Moderate)
69 (Unhealthy for Sensitive Groups)
63 (Unhealthy for Sensitive Groups)
78 (Unhealthy for Sensitive Groups)
97 (Unhealthy)
118 (Very Unhealthy)
91 (Unhealthy)
75 (Unhealthy for Sensitive Groups)
71 (Unhealthy for Sensitive Groups)
so2
9 (Good)
9 (Good)
8.4 (Good)
9.9 (Good)
8.3 (Good)
8.6 (Good)
6.8 (Good)
6.7 (Good)
6.4 (Good)
5.3 (Good)
5.7 (Good)
8.4 (Good)
4.3 (Good)
3.7 (Good)
4 (Good)
4.2 (Good)
3.7 (Good)
3.9 (Good)
5.5 (Good)
7.5 (Good)
data source »
南充炼油厂
Friday, May 27, 2022, 3:00 PM
PM2,5 61 (Unhealthy)
particulate matter (PM2.5) dust
NO2 22 (Good)
nitrogen dioxide (NO2)
PM10 69 (Unhealthy for Sensitive Groups)
particulate matter (PM10) suspended dust
CO 219 (Good)
carbon monoxide (CO)
O3 0.05 (Good)
ozone (O3)
SO2 7.7 (Good)
sulfur dioxide (SO2)
南充炼油厂
index
2022-05-27
pm25
28
no2
22
pm10
35
co
579
o3
22
so2
4.6
南充炼油厂
2018-10 2020-05
index
2020-05
2020-04
2020-03
2020-02
2020-01
2019-12
2019-11
2019-10
2019-09
2019-08
2019-07
2019-06
2019-05
2019-04
2019-03
2019-02
2019-01
2018-12
2018-11
2018-10
pm25
44
34
39
58
57
70
48
21
33
32
22
24
41
41
54
70
87
64
47
48
co
607
569
560
647
863
803
656
544
500
401
387
474
503
603
650
794
899
826
678
737
no2
28
29
30
21
30
39
31
24
28
29
25
24
21
24
28
20
36
28
32
27
o3
128
104
92
75
54
47
57
86
94
118
100
121
119
120
99
80
68
60
85
80
pm10
81
59
65
74
75
87
79
39
52
59
39
47
69
63
78
97
118
91
75
71
so2
9
9
8.4
9.9
8.3
8.6
6.8
6.7
6.4
5.3
5.7
8.4
4.3
3.7
4
4.2
3.7
3.9
5.5
7.5
* Pollution data source:
https://openaq.org
(ChinaAQIData)
The data is licensed under CC-By 4.0
PM2,5 61 (Unhealthy)
NO2 22 (Good)
PM10 69 (Unhealthy for Sensitive Groups)
CO 219 (Good)
O3 0 (Good)
SO2 8 (Good)
Data on air pollution from recent days in Wufeng
| index | 2022-05-27 |
|---|---|
| pm25 | 28 Moderate |
| no2 | 22 Good |
| pm10 | 35 Moderate |
| co | 579 Good |
| o3 | 22 Good |
| so2 | 5 Good |
| index | 2020-05 | 2020-04 | 2020-03 | 2020-02 | 2020-01 | 2019-12 | 2019-11 | 2019-10 | 2019-09 | 2019-08 | 2019-07 | 2019-06 | 2019-05 | 2019-04 | 2019-03 | 2019-02 | 2019-01 | 2018-12 | 2018-11 | 2018-10 |
|---|---|---|---|---|---|---|---|---|---|---|---|---|---|---|---|---|---|---|---|---|
| pm25 | 44 (Unhealthy for Sensitive Groups) | 34 (Moderate) | 39 (Unhealthy for Sensitive Groups) | 58 (Unhealthy) | 57 (Unhealthy) | 70 (Unhealthy) | 48 (Unhealthy for Sensitive Groups) | 21 (Moderate) | 33 (Moderate) | 32 (Moderate) | 22 (Moderate) | 24 (Moderate) | 41 (Unhealthy for Sensitive Groups) | 41 (Unhealthy for Sensitive Groups) | 54 (Unhealthy for Sensitive Groups) | 70 (Unhealthy) | 87 (Very Unhealthy) | 64 (Unhealthy) | 47 (Unhealthy for Sensitive Groups) | 48 (Unhealthy for Sensitive Groups) |
| co | 607 (Good) | 569 (Good) | 560 (Good) | 647 (Good) | 863 (Good) | 803 (Good) | 656 (Good) | 544 (Good) | 500 (Good) | 401 (Good) | 387 (Good) | 474 (Good) | 503 (Good) | 603 (Good) | 650 (Good) | 794 (Good) | 899 (Good) | 826 (Good) | 678 (Good) | 737 (Good) |
| no2 | 28 (Good) | 29 (Good) | 30 (Good) | 21 (Good) | 30 (Good) | 39 (Good) | 31 (Good) | 24 (Good) | 28 (Good) | 29 (Good) | 25 (Good) | 24 (Good) | 21 (Good) | 24 (Good) | 28 (Good) | 20 (Good) | 36 (Good) | 28 (Good) | 32 (Good) | 27 (Good) |
| o3 | 128 (Unhealthy for Sensitive Groups) | 104 (Moderate) | 92 (Moderate) | 75 (Moderate) | 54 (Good) | 47 (Good) | 57 (Good) | 86 (Moderate) | 94 (Moderate) | 118 (Moderate) | 100 (Moderate) | 121 (Unhealthy for Sensitive Groups) | 119 (Moderate) | 120 (Unhealthy for Sensitive Groups) | 99 (Moderate) | 80 (Moderate) | 68 (Good) | 60 (Good) | 85 (Moderate) | 80 (Moderate) |
| pm10 | 81 (Unhealthy) | 59 (Unhealthy for Sensitive Groups) | 65 (Unhealthy for Sensitive Groups) | 74 (Unhealthy for Sensitive Groups) | 75 (Unhealthy for Sensitive Groups) | 87 (Unhealthy) | 79 (Unhealthy for Sensitive Groups) | 39 (Moderate) | 52 (Unhealthy for Sensitive Groups) | 59 (Unhealthy for Sensitive Groups) | 39 (Moderate) | 47 (Moderate) | 69 (Unhealthy for Sensitive Groups) | 63 (Unhealthy for Sensitive Groups) | 78 (Unhealthy for Sensitive Groups) | 97 (Unhealthy) | 118 (Very Unhealthy) | 91 (Unhealthy) | 75 (Unhealthy for Sensitive Groups) | 71 (Unhealthy for Sensitive Groups) |
| so2 | 9 (Good) | 9 (Good) | 8.4 (Good) | 9.9 (Good) | 8.3 (Good) | 8.6 (Good) | 6.8 (Good) | 6.7 (Good) | 6.4 (Good) | 5.3 (Good) | 5.7 (Good) | 8.4 (Good) | 4.3 (Good) | 3.7 (Good) | 4 (Good) | 4.2 (Good) | 3.7 (Good) | 3.9 (Good) | 5.5 (Good) | 7.5 (Good) |
PM2,5 61 (Unhealthy)
particulate matter (PM2.5) dustNO2 22 (Good)
nitrogen dioxide (NO2)PM10 69 (Unhealthy for Sensitive Groups)
particulate matter (PM10) suspended dustCO 219 (Good)
carbon monoxide (CO)O3 0.05 (Good)
ozone (O3)SO2 7.7 (Good)
sulfur dioxide (SO2)南充炼油厂
| index | 2022-05-27 |
|---|---|
| pm25 | 28 |
| no2 | 22 |
| pm10 | 35 |
| co | 579 |
| o3 | 22 |
| so2 | 4.6 |
南充炼油厂
| index | 2020-05 | 2020-04 | 2020-03 | 2020-02 | 2020-01 | 2019-12 | 2019-11 | 2019-10 | 2019-09 | 2019-08 | 2019-07 | 2019-06 | 2019-05 | 2019-04 | 2019-03 | 2019-02 | 2019-01 | 2018-12 | 2018-11 | 2018-10 |
|---|---|---|---|---|---|---|---|---|---|---|---|---|---|---|---|---|---|---|---|---|
| pm25 | 44 | 34 | 39 | 58 | 57 | 70 | 48 | 21 | 33 | 32 | 22 | 24 | 41 | 41 | 54 | 70 | 87 | 64 | 47 | 48 |
| co | 607 | 569 | 560 | 647 | 863 | 803 | 656 | 544 | 500 | 401 | 387 | 474 | 503 | 603 | 650 | 794 | 899 | 826 | 678 | 737 |
| no2 | 28 | 29 | 30 | 21 | 30 | 39 | 31 | 24 | 28 | 29 | 25 | 24 | 21 | 24 | 28 | 20 | 36 | 28 | 32 | 27 |
| o3 | 128 | 104 | 92 | 75 | 54 | 47 | 57 | 86 | 94 | 118 | 100 | 121 | 119 | 120 | 99 | 80 | 68 | 60 | 85 | 80 |
| pm10 | 81 | 59 | 65 | 74 | 75 | 87 | 79 | 39 | 52 | 59 | 39 | 47 | 69 | 63 | 78 | 97 | 118 | 91 | 75 | 71 |
| so2 | 9 | 9 | 8.4 | 9.9 | 8.3 | 8.6 | 6.8 | 6.7 | 6.4 | 5.3 | 5.7 | 8.4 | 4.3 | 3.7 | 4 | 4.2 | 3.7 | 3.9 | 5.5 | 7.5 |