Air Pollution in Huohua: Real-time Air Quality Index and smog alert.
Pollution and air quality forecast for Huohua. Today is Tuesday, June 16, 2026. The following air pollution values have been recorded for Huohua:- particulate matter (PM2.5) dust - 61 (Unhealthy)
- nitrogen dioxide (NO2) - 22 (Good)
- particulate matter (PM10) suspended dust - 69 (Unhealthy for Sensitive Groups)
- carbon monoxide (CO) - 219 (Good)
- ozone (O3) - 0 (Good)
- sulfur dioxide (SO2) - 8 (Good)

What is the air quality in Huohua today? Is the air polluted in Huohua?. Is there smog?
What is the current level of PM2.5 in Huohua? (particulate matter (PM2.5) dust)
Today's PM2.5 level is:
61 (Unhealthy)
For comparison, the highest level of PM2.5 in Huohua in the last 7 days was: 28 (Friday, May 27, 2022) and the lowest: 28 (Friday, May 27, 2022).
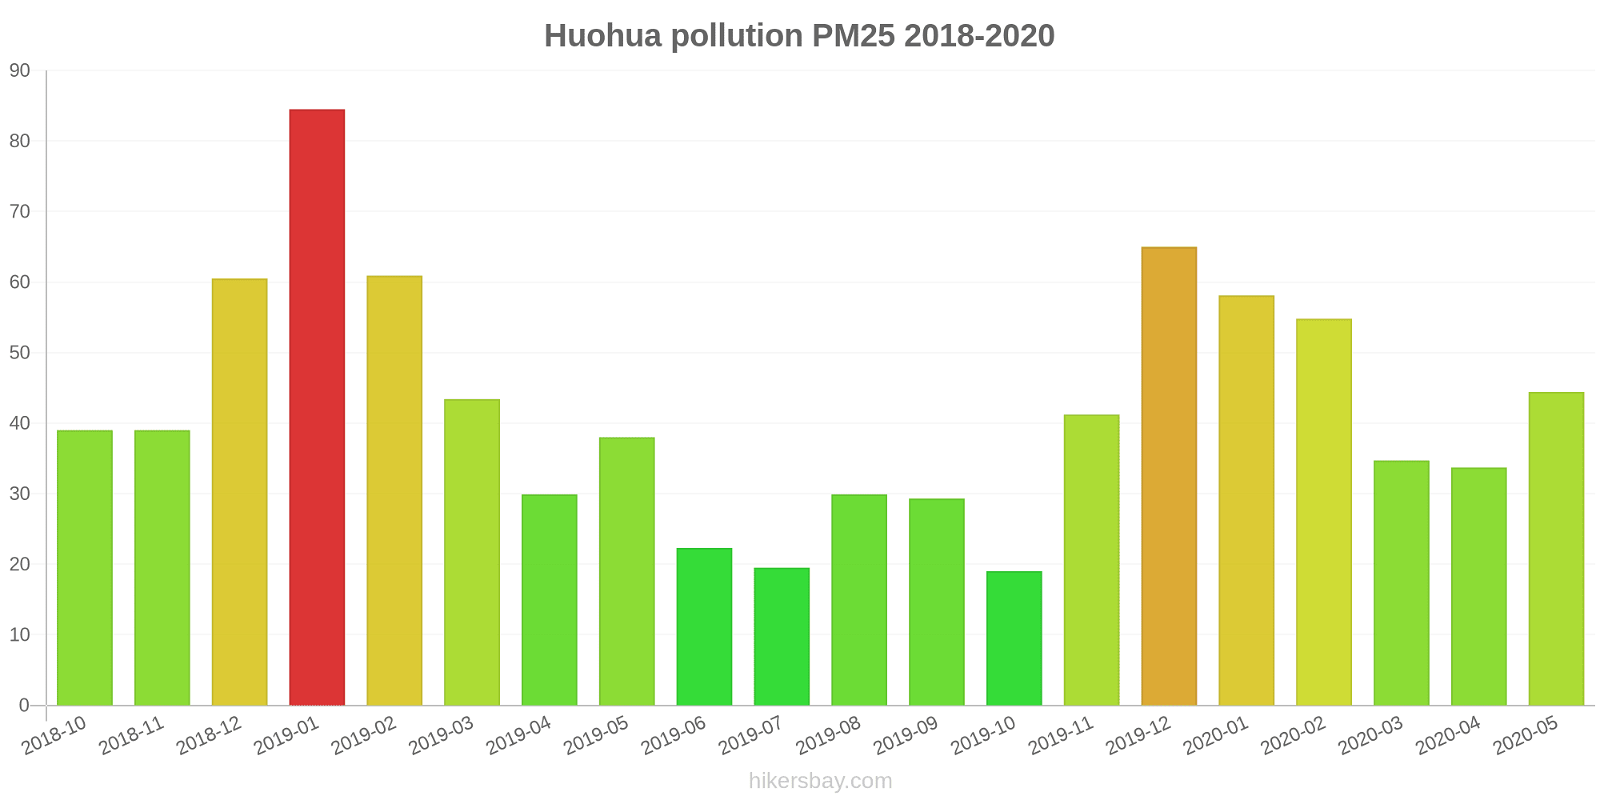
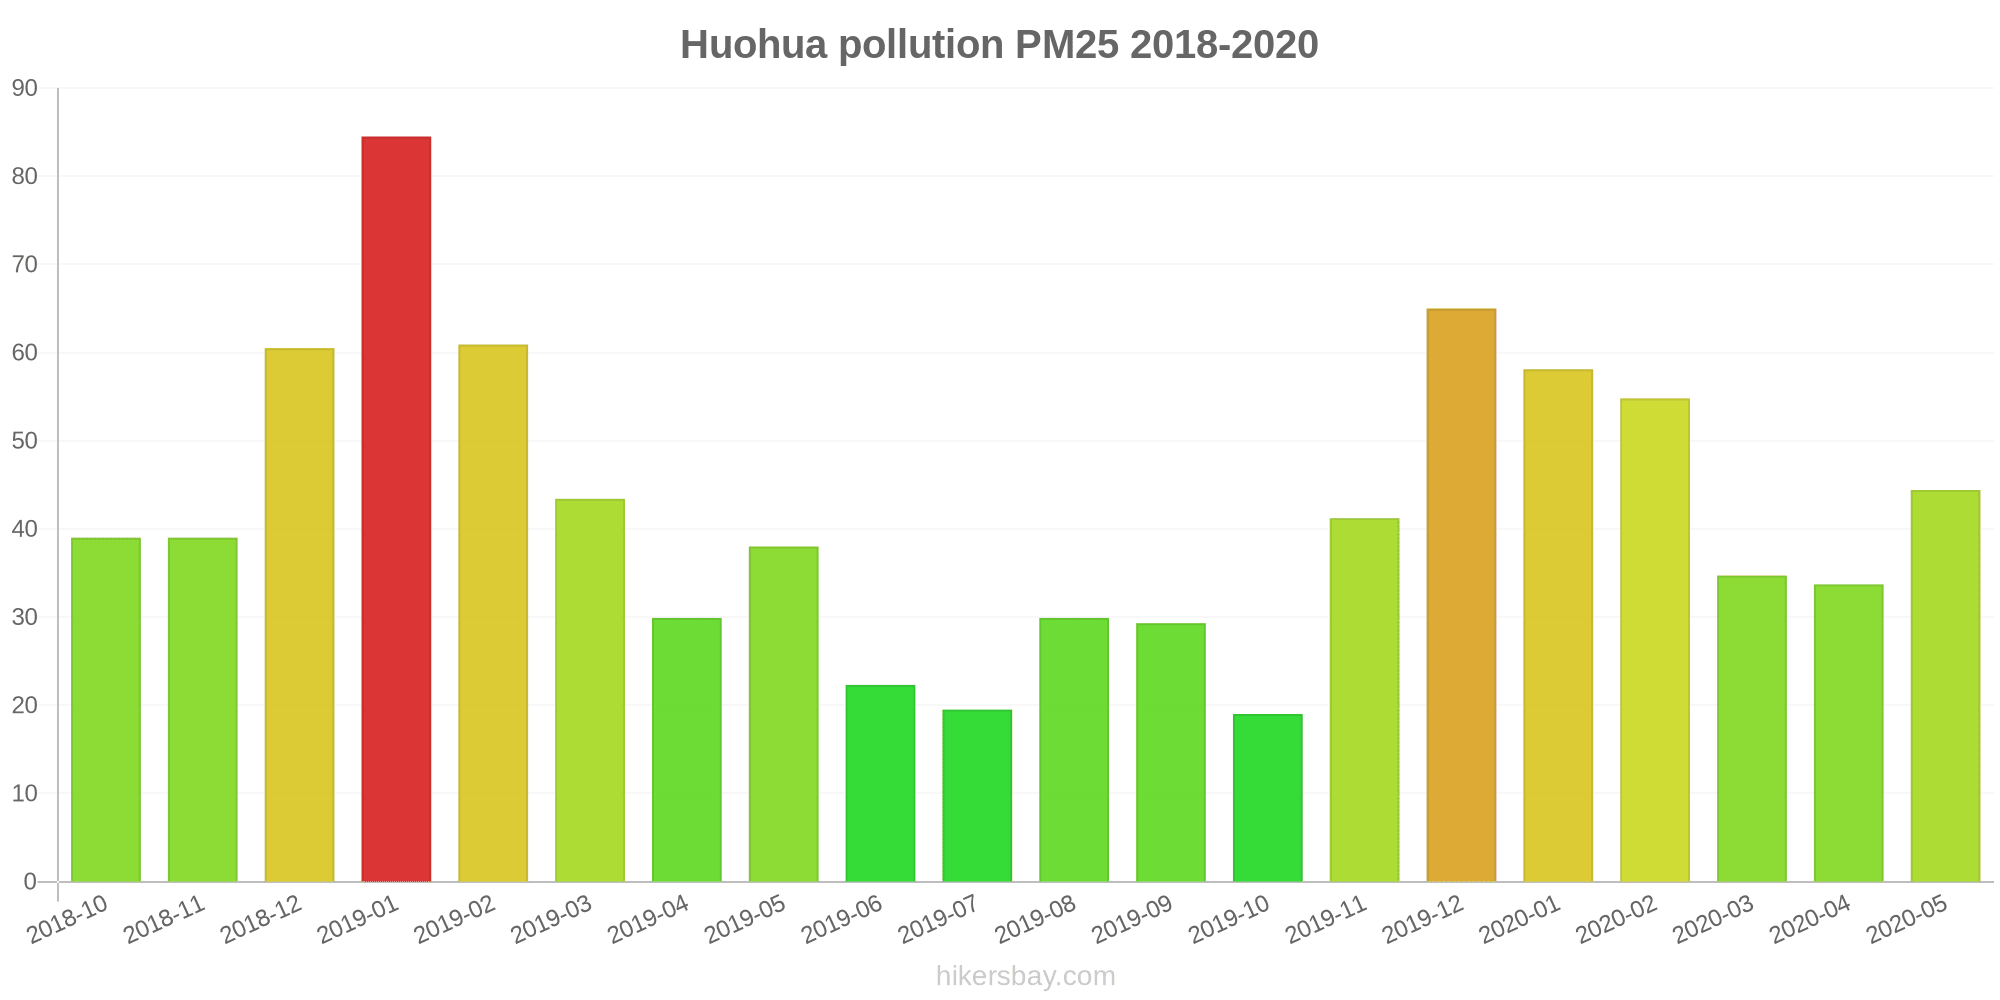
The highest PM2.5 values were recorded: 85 (January 2019).
The lowest level of particulate matter PM2.5 pollution occurs in month: October (19).
How high is the level of NO2? (nitrogen dioxide (NO2))
22 (Good)
What is the level of PM10 today in Huohua? (particulate matter (PM10) suspended dust)
The current level of particulate matter PM10 in Huohua is:
69 (Unhealthy for Sensitive Groups)
The highest PM10 values usually occur in month: 99 (January 2019).
The lowest value of particulate matter PM10 pollution in Huohua is usually recorded in: October (29).
How high is the CO level? (carbon monoxide (CO))
219 (Good)
How is the O3 level today in Huohua? (ozone (O3))
0 (Good)
What is the level of SO2 pollution? (sulfur dioxide (SO2))
8 (Good)
Current data Friday, May 27, 2022, 3:00 PM
PM2,5 61 (Unhealthy)
NO2 22 (Good)
PM10 69 (Unhealthy for Sensitive Groups)
CO 219 (Good)
O3 0 (Good)
SO2 8 (Good)
Data on air pollution from recent days in Huohua
index
2022-05-27
pm25
28
Moderate
no2
22
Good
pm10
35
Moderate
co
579
Good
o3
22
Good
so2
5
Good
data source »
Air pollution in Huohua from October 2018 to May 2020
index
2020-05
2020-04
2020-03
2020-02
2020-01
2019-12
2019-11
2019-10
2019-09
2019-08
2019-07
2019-06
2019-05
2019-04
2019-03
2019-02
2019-01
2018-12
2018-11
2018-10
pm25
44 (Unhealthy for Sensitive Groups)
34 (Moderate)
35 (Moderate)
55 (Unhealthy for Sensitive Groups)
58 (Unhealthy)
65 (Unhealthy)
41 (Unhealthy for Sensitive Groups)
19 (Moderate)
29 (Moderate)
30 (Moderate)
20 (Moderate)
22 (Moderate)
38 (Unhealthy for Sensitive Groups)
30 (Moderate)
43 (Unhealthy for Sensitive Groups)
61 (Unhealthy)
85 (Very Unhealthy)
61 (Unhealthy)
39 (Unhealthy for Sensitive Groups)
39 (Unhealthy for Sensitive Groups)
co
705 (Good)
654 (Good)
668 (Good)
759 (Good)
1 (Good)
938 (Good)
681 (Good)
528 (Good)
612 (Good)
600 (Good)
481 (Good)
666 (Good)
623 (Good)
760 (Good)
791 (Good)
969 (Good)
1 (Good)
967 (Good)
845 (Good)
867 (Good)
no2
35 (Good)
31 (Good)
36 (Good)
21 (Good)
31 (Good)
35 (Good)
33 (Good)
22 (Good)
27 (Good)
25 (Good)
24 (Good)
28 (Good)
30 (Good)
35 (Good)
38 (Good)
29 (Good)
37 (Good)
27 (Good)
31 (Good)
32 (Good)
o3
129 (Unhealthy for Sensitive Groups)
110 (Moderate)
92 (Moderate)
74 (Moderate)
65 (Good)
49 (Good)
43 (Good)
83 (Moderate)
98 (Moderate)
137 (Unhealthy for Sensitive Groups)
105 (Moderate)
114 (Moderate)
117 (Moderate)
120 (Unhealthy for Sensitive Groups)
85 (Moderate)
83 (Moderate)
74 (Moderate)
61 (Good)
73 (Moderate)
91 (Moderate)
pm10
66 (Unhealthy for Sensitive Groups)
49 (Moderate)
55 (Unhealthy for Sensitive Groups)
67 (Unhealthy for Sensitive Groups)
69 (Unhealthy for Sensitive Groups)
81 (Unhealthy)
62 (Unhealthy for Sensitive Groups)
29 (Moderate)
41 (Moderate)
45 (Moderate)
31 (Moderate)
34 (Moderate)
55 (Unhealthy for Sensitive Groups)
51 (Unhealthy for Sensitive Groups)
63 (Unhealthy for Sensitive Groups)
74 (Unhealthy for Sensitive Groups)
99 (Unhealthy)
73 (Unhealthy for Sensitive Groups)
55 (Unhealthy for Sensitive Groups)
56 (Unhealthy for Sensitive Groups)
so2
4.8 (Good)
3.4 (Good)
5.4 (Good)
3.8 (Good)
4.4 (Good)
6 (Good)
4 (Good)
4.2 (Good)
3.1 (Good)
6.2 (Good)
11 (Good)
12 (Good)
6.2 (Good)
6.1 (Good)
6.4 (Good)
5.8 (Good)
5 (Good)
5.2 (Good)
5.5 (Good)
5.5 (Good)
data source »
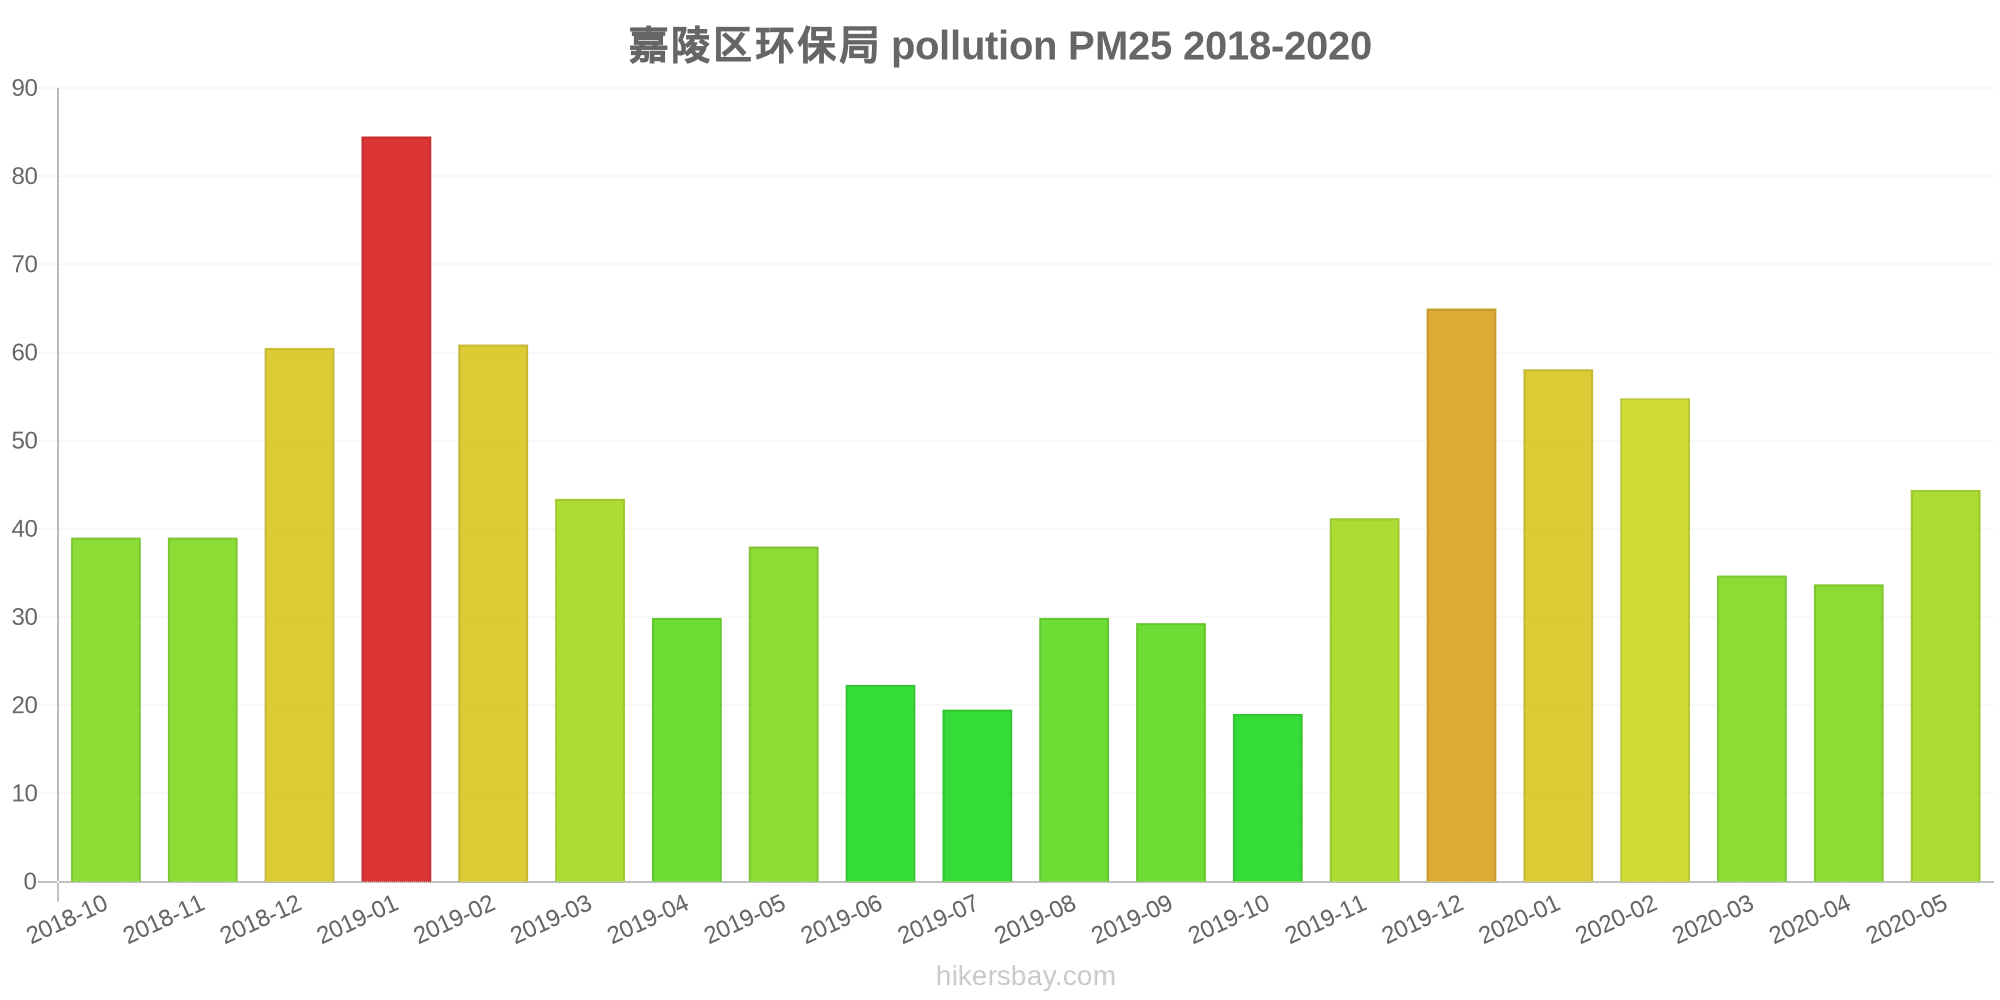
嘉陵区环保局
Friday, May 27, 2022, 3:00 PM
PM2,5 61 (Unhealthy)
particulate matter (PM2.5) dust
NO2 22 (Good)
nitrogen dioxide (NO2)
PM10 69 (Unhealthy for Sensitive Groups)
particulate matter (PM10) suspended dust
CO 219 (Good)
carbon monoxide (CO)
O3 0.05 (Good)
ozone (O3)
SO2 7.7 (Good)
sulfur dioxide (SO2)
嘉陵区环保局
index
2022-05-27
pm25
28
no2
22
pm10
35
co
579
o3
22
so2
4.6
嘉陵区环保局
2018-10 2020-05

index
2020-05
2020-04
2020-03
2020-02
2020-01
2019-12
2019-11
2019-10
2019-09
2019-08
2019-07
2019-06
2019-05
2019-04
2019-03
2019-02
2019-01
2018-12
2018-11
2018-10
pm25
44
34
35
55
58
65
41
19
29
30
20
22
38
30
43
61
85
61
39
39
co
705
654
668
759
1
938
681
528
612
600
481
666
623
760
791
969
1
967
845
867
no2
35
31
36
21
31
35
33
22
27
25
24
28
30
35
38
29
37
27
31
32
o3
129
110
92
74
65
49
43
83
98
137
105
114
117
120
85
83
74
61
73
91
pm10
66
49
55
67
69
81
62
29
41
45
31
34
55
51
63
74
99
73
55
56
so2
4.8
3.4
5.4
3.8
4.4
6
4
4.2
3.1
6.2
11
12
6.2
6.1
6.4
5.8
5
5.2
5.5
5.5
* Pollution data source:
https://openaq.org
(ChinaAQIData)
The data is licensed under CC-By 4.0
PM2,5 61 (Unhealthy)
NO2 22 (Good)
PM10 69 (Unhealthy for Sensitive Groups)
CO 219 (Good)
O3 0 (Good)
SO2 8 (Good)
Data on air pollution from recent days in Huohua
| index | 2022-05-27 |
|---|---|
| pm25 | 28 Moderate |
| no2 | 22 Good |
| pm10 | 35 Moderate |
| co | 579 Good |
| o3 | 22 Good |
| so2 | 5 Good |
| index | 2020-05 | 2020-04 | 2020-03 | 2020-02 | 2020-01 | 2019-12 | 2019-11 | 2019-10 | 2019-09 | 2019-08 | 2019-07 | 2019-06 | 2019-05 | 2019-04 | 2019-03 | 2019-02 | 2019-01 | 2018-12 | 2018-11 | 2018-10 |
|---|---|---|---|---|---|---|---|---|---|---|---|---|---|---|---|---|---|---|---|---|
| pm25 | 44 (Unhealthy for Sensitive Groups) | 34 (Moderate) | 35 (Moderate) | 55 (Unhealthy for Sensitive Groups) | 58 (Unhealthy) | 65 (Unhealthy) | 41 (Unhealthy for Sensitive Groups) | 19 (Moderate) | 29 (Moderate) | 30 (Moderate) | 20 (Moderate) | 22 (Moderate) | 38 (Unhealthy for Sensitive Groups) | 30 (Moderate) | 43 (Unhealthy for Sensitive Groups) | 61 (Unhealthy) | 85 (Very Unhealthy) | 61 (Unhealthy) | 39 (Unhealthy for Sensitive Groups) | 39 (Unhealthy for Sensitive Groups) |
| co | 705 (Good) | 654 (Good) | 668 (Good) | 759 (Good) | 1 (Good) | 938 (Good) | 681 (Good) | 528 (Good) | 612 (Good) | 600 (Good) | 481 (Good) | 666 (Good) | 623 (Good) | 760 (Good) | 791 (Good) | 969 (Good) | 1 (Good) | 967 (Good) | 845 (Good) | 867 (Good) |
| no2 | 35 (Good) | 31 (Good) | 36 (Good) | 21 (Good) | 31 (Good) | 35 (Good) | 33 (Good) | 22 (Good) | 27 (Good) | 25 (Good) | 24 (Good) | 28 (Good) | 30 (Good) | 35 (Good) | 38 (Good) | 29 (Good) | 37 (Good) | 27 (Good) | 31 (Good) | 32 (Good) |
| o3 | 129 (Unhealthy for Sensitive Groups) | 110 (Moderate) | 92 (Moderate) | 74 (Moderate) | 65 (Good) | 49 (Good) | 43 (Good) | 83 (Moderate) | 98 (Moderate) | 137 (Unhealthy for Sensitive Groups) | 105 (Moderate) | 114 (Moderate) | 117 (Moderate) | 120 (Unhealthy for Sensitive Groups) | 85 (Moderate) | 83 (Moderate) | 74 (Moderate) | 61 (Good) | 73 (Moderate) | 91 (Moderate) |
| pm10 | 66 (Unhealthy for Sensitive Groups) | 49 (Moderate) | 55 (Unhealthy for Sensitive Groups) | 67 (Unhealthy for Sensitive Groups) | 69 (Unhealthy for Sensitive Groups) | 81 (Unhealthy) | 62 (Unhealthy for Sensitive Groups) | 29 (Moderate) | 41 (Moderate) | 45 (Moderate) | 31 (Moderate) | 34 (Moderate) | 55 (Unhealthy for Sensitive Groups) | 51 (Unhealthy for Sensitive Groups) | 63 (Unhealthy for Sensitive Groups) | 74 (Unhealthy for Sensitive Groups) | 99 (Unhealthy) | 73 (Unhealthy for Sensitive Groups) | 55 (Unhealthy for Sensitive Groups) | 56 (Unhealthy for Sensitive Groups) |
| so2 | 4.8 (Good) | 3.4 (Good) | 5.4 (Good) | 3.8 (Good) | 4.4 (Good) | 6 (Good) | 4 (Good) | 4.2 (Good) | 3.1 (Good) | 6.2 (Good) | 11 (Good) | 12 (Good) | 6.2 (Good) | 6.1 (Good) | 6.4 (Good) | 5.8 (Good) | 5 (Good) | 5.2 (Good) | 5.5 (Good) | 5.5 (Good) |
PM2,5 61 (Unhealthy)
particulate matter (PM2.5) dustNO2 22 (Good)
nitrogen dioxide (NO2)PM10 69 (Unhealthy for Sensitive Groups)
particulate matter (PM10) suspended dustCO 219 (Good)
carbon monoxide (CO)O3 0.05 (Good)
ozone (O3)SO2 7.7 (Good)
sulfur dioxide (SO2)嘉陵区环保局
| index | 2022-05-27 |
|---|---|
| pm25 | 28 |
| no2 | 22 |
| pm10 | 35 |
| co | 579 |
| o3 | 22 |
| so2 | 4.6 |
嘉陵区环保局
| index | 2020-05 | 2020-04 | 2020-03 | 2020-02 | 2020-01 | 2019-12 | 2019-11 | 2019-10 | 2019-09 | 2019-08 | 2019-07 | 2019-06 | 2019-05 | 2019-04 | 2019-03 | 2019-02 | 2019-01 | 2018-12 | 2018-11 | 2018-10 |
|---|---|---|---|---|---|---|---|---|---|---|---|---|---|---|---|---|---|---|---|---|
| pm25 | 44 | 34 | 35 | 55 | 58 | 65 | 41 | 19 | 29 | 30 | 20 | 22 | 38 | 30 | 43 | 61 | 85 | 61 | 39 | 39 |
| co | 705 | 654 | 668 | 759 | 1 | 938 | 681 | 528 | 612 | 600 | 481 | 666 | 623 | 760 | 791 | 969 | 1 | 967 | 845 | 867 |
| no2 | 35 | 31 | 36 | 21 | 31 | 35 | 33 | 22 | 27 | 25 | 24 | 28 | 30 | 35 | 38 | 29 | 37 | 27 | 31 | 32 |
| o3 | 129 | 110 | 92 | 74 | 65 | 49 | 43 | 83 | 98 | 137 | 105 | 114 | 117 | 120 | 85 | 83 | 74 | 61 | 73 | 91 |
| pm10 | 66 | 49 | 55 | 67 | 69 | 81 | 62 | 29 | 41 | 45 | 31 | 34 | 55 | 51 | 63 | 74 | 99 | 73 | 55 | 56 |
| so2 | 4.8 | 3.4 | 5.4 | 3.8 | 4.4 | 6 | 4 | 4.2 | 3.1 | 6.2 | 11 | 12 | 6.2 | 6.1 | 6.4 | 5.8 | 5 | 5.2 | 5.5 | 5.5 |