Air Pollution in Huanxiling: Real-time Air Quality Index and smog alert.
Pollution and air quality forecast for Huanxiling. Today is Tuesday, June 16, 2026. The following air pollution values have been recorded for Huanxiling:- particulate matter (PM10) suspended dust - 7 (Good)
- particulate matter (PM2.5) dust - 2 (Good)
- carbon monoxide (CO) - 100 (Good)
- nitrogen dioxide (NO2) - 8 (Good)
- ozone (O3) - 0 (Good)
- sulfur dioxide (SO2) - 9 (Good)

What is the air quality in Huanxiling today? Is the air polluted in Huanxiling?. Is there smog?
What is the level of PM10 today in Huanxiling? (particulate matter (PM10) suspended dust)
The current level of particulate matter PM10 in Huanxiling is:
7 (Good)
The highest PM10 values usually occur in month: 137 (January 2020).
The lowest value of particulate matter PM10 pollution in Huanxiling is usually recorded in: August (23).
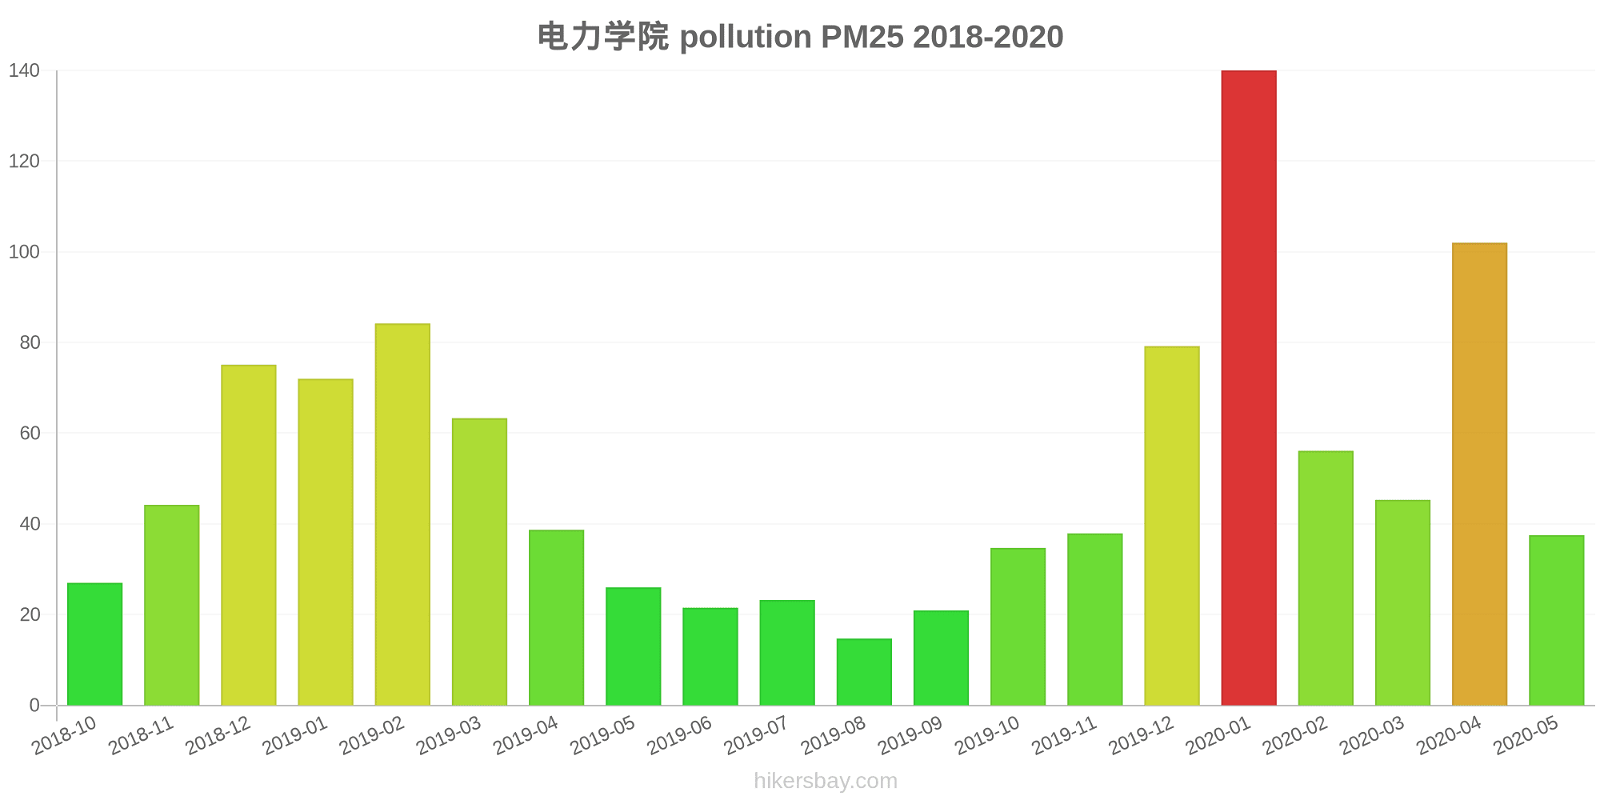
What is the current level of PM2.5 in Huanxiling? (particulate matter (PM2.5) dust)
Today's PM2.5 level is:
2 (Good)
For comparison, the highest level of PM2.5 in Huanxiling in the last 7 days was: 24 (Friday, May 27, 2022) and the lowest: 24 (Friday, May 27, 2022).
The highest PM2.5 values were recorded: 140 (January 2020).
The lowest level of particulate matter PM2.5 pollution occurs in month: August (15).
How high is the CO level? (carbon monoxide (CO))
100 (Good)
How high is the level of NO2? (nitrogen dioxide (NO2))
8 (Good)
How is the O3 level today in Huanxiling? (ozone (O3))
0 (Good)
What is the level of SO2 pollution? (sulfur dioxide (SO2))
9 (Good)
Current data Friday, May 27, 2022, 12:00 PM
PM10 7 (Good)
PM2,5 2 (Good)
CO 100 (Good)
NO2 8 (Good)
O3 0 (Good)
SO2 9 (Good)
Data on air pollution from recent days in Huanxiling
index
2022-05-27
pm10
32
Moderate
pm25
24
Moderate
co
468
Good
no2
21
Good
o3
32
Good
so2
5
Good
data source »
Air pollution in Huanxiling from October 2018 to May 2020

index
2020-05
2020-04
2020-03
2020-02
2020-01
2019-12
2019-11
2019-10
2019-09
2019-08
2019-07
2019-06
2019-05
2019-04
2019-03
2019-02
2019-01
2018-12
2018-11
2018-10
pm25
38 (Unhealthy for Sensitive Groups)
102 (Very Unhealthy)
45 (Unhealthy for Sensitive Groups)
56 (Unhealthy)
140 (Very bad Hazardous)
79 (Very Unhealthy)
38 (Unhealthy for Sensitive Groups)
35 (Moderate)
21 (Moderate)
15 (Moderate)
23 (Moderate)
22 (Moderate)
26 (Moderate)
39 (Unhealthy for Sensitive Groups)
63 (Unhealthy)
84 (Very Unhealthy)
72 (Unhealthy)
75 (Very Unhealthy)
44 (Unhealthy for Sensitive Groups)
27 (Moderate)
co
610 (Good)
915 (Good)
817 (Good)
1 (Good)
1 (Good)
1 (Good)
851 (Good)
823 (Good)
615 (Good)
721 (Good)
724 (Good)
504 (Good)
578 (Good)
707 (Good)
942 (Good)
1 (Good)
1 (Good)
1 (Good)
1 (Good)
910 (Good)
no2
18 (Good)
30 (Good)
19 (Good)
21 (Good)
45 (Moderate)
35 (Good)
26 (Good)
29 (Good)
21 (Good)
15 (Good)
17 (Good)
24 (Good)
18 (Good)
23 (Good)
26 (Good)
30 (Good)
35 (Good)
29 (Good)
32 (Good)
28 (Good)
o3
140 (Unhealthy for Sensitive Groups)
142 (Unhealthy for Sensitive Groups)
108 (Moderate)
97 (Moderate)
100 (Moderate)
68 (Good)
67 (Good)
96 (Moderate)
101 (Moderate)
91 (Moderate)
138 (Unhealthy for Sensitive Groups)
138 (Unhealthy for Sensitive Groups)
137 (Unhealthy for Sensitive Groups)
112 (Moderate)
112 (Moderate)
98 (Moderate)
77 (Moderate)
68 (Good)
55 (Good)
68 (Good)
pm10
65 (Unhealthy for Sensitive Groups)
115 (Very Unhealthy)
62 (Unhealthy for Sensitive Groups)
58 (Unhealthy for Sensitive Groups)
137 (Very Unhealthy)
83 (Unhealthy)
52 (Unhealthy for Sensitive Groups)
60 (Unhealthy for Sensitive Groups)
39 (Moderate)
23 (Moderate)
35 (Moderate)
41 (Moderate)
64 (Unhealthy for Sensitive Groups)
98 (Unhealthy)
112 (Very Unhealthy)
111 (Very Unhealthy)
106 (Unhealthy)
85 (Unhealthy)
70 (Unhealthy for Sensitive Groups)
52 (Unhealthy for Sensitive Groups)
so2
12 (Good)
13 (Good)
11 (Good)
18 (Good)
30 (Good)
22 (Good)
15 (Good)
12 (Good)
7.6 (Good)
6.9 (Good)
6 (Good)
7.8 (Good)
7.8 (Good)
9.3 (Good)
13 (Good)
18 (Good)
21 (Good)
17 (Good)
21 (Good)
12 (Good)
data source »
电力学院
Friday, May 27, 2022, 12:00 PM
PM10 6.7 (Good)
particulate matter (PM10) suspended dust
PM2,5 1.7 (Good)
particulate matter (PM2.5) dust
CO 100 (Good)
carbon monoxide (CO)
NO2 7.6 (Good)
nitrogen dioxide (NO2)
O3 0.02 (Good)
ozone (O3)
SO2 8.6 (Good)
sulfur dioxide (SO2)
电力学院
index
2022-05-27
pm10
32
pm25
24
co
468
no2
21
o3
32
so2
4.6
电力学院
2018-10 2020-05
index
2020-05
2020-04
2020-03
2020-02
2020-01
2019-12
2019-11
2019-10
2019-09
2019-08
2019-07
2019-06
2019-05
2019-04
2019-03
2019-02
2019-01
2018-12
2018-11
2018-10
pm25
38
102
45
56
140
79
38
35
21
15
23
22
26
39
63
84
72
75
44
27
co
610
915
817
1
1
1
851
823
615
721
724
504
578
707
942
1
1
1
1
910
no2
18
30
19
21
45
35
26
29
21
15
17
24
18
23
26
30
35
29
32
28
o3
140
142
108
97
100
68
67
96
101
91
138
138
137
112
112
98
77
68
55
68
pm10
65
115
62
58
137
83
52
60
39
23
35
41
64
98
112
111
106
85
70
52
so2
12
13
11
18
30
22
15
12
7.6
6.9
6
7.8
7.8
9.3
13
18
21
17
21
12
* Pollution data source:
https://openaq.org
(ChinaAQIData)
The data is licensed under CC-By 4.0
PM10 7 (Good)
PM2,5 2 (Good)
CO 100 (Good)
NO2 8 (Good)
O3 0 (Good)
SO2 9 (Good)
Data on air pollution from recent days in Huanxiling
| index | 2022-05-27 |
|---|---|
| pm10 | 32 Moderate |
| pm25 | 24 Moderate |
| co | 468 Good |
| no2 | 21 Good |
| o3 | 32 Good |
| so2 | 5 Good |

| index | 2020-05 | 2020-04 | 2020-03 | 2020-02 | 2020-01 | 2019-12 | 2019-11 | 2019-10 | 2019-09 | 2019-08 | 2019-07 | 2019-06 | 2019-05 | 2019-04 | 2019-03 | 2019-02 | 2019-01 | 2018-12 | 2018-11 | 2018-10 |
|---|---|---|---|---|---|---|---|---|---|---|---|---|---|---|---|---|---|---|---|---|
| pm25 | 38 (Unhealthy for Sensitive Groups) | 102 (Very Unhealthy) | 45 (Unhealthy for Sensitive Groups) | 56 (Unhealthy) | 140 (Very bad Hazardous) | 79 (Very Unhealthy) | 38 (Unhealthy for Sensitive Groups) | 35 (Moderate) | 21 (Moderate) | 15 (Moderate) | 23 (Moderate) | 22 (Moderate) | 26 (Moderate) | 39 (Unhealthy for Sensitive Groups) | 63 (Unhealthy) | 84 (Very Unhealthy) | 72 (Unhealthy) | 75 (Very Unhealthy) | 44 (Unhealthy for Sensitive Groups) | 27 (Moderate) |
| co | 610 (Good) | 915 (Good) | 817 (Good) | 1 (Good) | 1 (Good) | 1 (Good) | 851 (Good) | 823 (Good) | 615 (Good) | 721 (Good) | 724 (Good) | 504 (Good) | 578 (Good) | 707 (Good) | 942 (Good) | 1 (Good) | 1 (Good) | 1 (Good) | 1 (Good) | 910 (Good) |
| no2 | 18 (Good) | 30 (Good) | 19 (Good) | 21 (Good) | 45 (Moderate) | 35 (Good) | 26 (Good) | 29 (Good) | 21 (Good) | 15 (Good) | 17 (Good) | 24 (Good) | 18 (Good) | 23 (Good) | 26 (Good) | 30 (Good) | 35 (Good) | 29 (Good) | 32 (Good) | 28 (Good) |
| o3 | 140 (Unhealthy for Sensitive Groups) | 142 (Unhealthy for Sensitive Groups) | 108 (Moderate) | 97 (Moderate) | 100 (Moderate) | 68 (Good) | 67 (Good) | 96 (Moderate) | 101 (Moderate) | 91 (Moderate) | 138 (Unhealthy for Sensitive Groups) | 138 (Unhealthy for Sensitive Groups) | 137 (Unhealthy for Sensitive Groups) | 112 (Moderate) | 112 (Moderate) | 98 (Moderate) | 77 (Moderate) | 68 (Good) | 55 (Good) | 68 (Good) |
| pm10 | 65 (Unhealthy for Sensitive Groups) | 115 (Very Unhealthy) | 62 (Unhealthy for Sensitive Groups) | 58 (Unhealthy for Sensitive Groups) | 137 (Very Unhealthy) | 83 (Unhealthy) | 52 (Unhealthy for Sensitive Groups) | 60 (Unhealthy for Sensitive Groups) | 39 (Moderate) | 23 (Moderate) | 35 (Moderate) | 41 (Moderate) | 64 (Unhealthy for Sensitive Groups) | 98 (Unhealthy) | 112 (Very Unhealthy) | 111 (Very Unhealthy) | 106 (Unhealthy) | 85 (Unhealthy) | 70 (Unhealthy for Sensitive Groups) | 52 (Unhealthy for Sensitive Groups) |
| so2 | 12 (Good) | 13 (Good) | 11 (Good) | 18 (Good) | 30 (Good) | 22 (Good) | 15 (Good) | 12 (Good) | 7.6 (Good) | 6.9 (Good) | 6 (Good) | 7.8 (Good) | 7.8 (Good) | 9.3 (Good) | 13 (Good) | 18 (Good) | 21 (Good) | 17 (Good) | 21 (Good) | 12 (Good) |
PM10 6.7 (Good)
particulate matter (PM10) suspended dustPM2,5 1.7 (Good)
particulate matter (PM2.5) dustCO 100 (Good)
carbon monoxide (CO)NO2 7.6 (Good)
nitrogen dioxide (NO2)O3 0.02 (Good)
ozone (O3)SO2 8.6 (Good)
sulfur dioxide (SO2)电力学院
| index | 2022-05-27 |
|---|---|
| pm10 | 32 |
| pm25 | 24 |
| co | 468 |
| no2 | 21 |
| o3 | 32 |
| so2 | 4.6 |
电力学院

| index | 2020-05 | 2020-04 | 2020-03 | 2020-02 | 2020-01 | 2019-12 | 2019-11 | 2019-10 | 2019-09 | 2019-08 | 2019-07 | 2019-06 | 2019-05 | 2019-04 | 2019-03 | 2019-02 | 2019-01 | 2018-12 | 2018-11 | 2018-10 |
|---|---|---|---|---|---|---|---|---|---|---|---|---|---|---|---|---|---|---|---|---|
| pm25 | 38 | 102 | 45 | 56 | 140 | 79 | 38 | 35 | 21 | 15 | 23 | 22 | 26 | 39 | 63 | 84 | 72 | 75 | 44 | 27 |
| co | 610 | 915 | 817 | 1 | 1 | 1 | 851 | 823 | 615 | 721 | 724 | 504 | 578 | 707 | 942 | 1 | 1 | 1 | 1 | 910 |
| no2 | 18 | 30 | 19 | 21 | 45 | 35 | 26 | 29 | 21 | 15 | 17 | 24 | 18 | 23 | 26 | 30 | 35 | 29 | 32 | 28 |
| o3 | 140 | 142 | 108 | 97 | 100 | 68 | 67 | 96 | 101 | 91 | 138 | 138 | 137 | 112 | 112 | 98 | 77 | 68 | 55 | 68 |
| pm10 | 65 | 115 | 62 | 58 | 137 | 83 | 52 | 60 | 39 | 23 | 35 | 41 | 64 | 98 | 112 | 111 | 106 | 85 | 70 | 52 |
| so2 | 12 | 13 | 11 | 18 | 30 | 22 | 15 | 12 | 7.6 | 6.9 | 6 | 7.8 | 7.8 | 9.3 | 13 | 18 | 21 | 17 | 21 | 12 |