Air Pollution in Baicheng Shi: Real-time Air Quality Index and smog alert.
Pollution and air quality forecast for Baicheng Shi. Today is Tuesday, June 16, 2026. The following air pollution values have been recorded for Baicheng Shi:- particulate matter (PM10) suspended dust - 7 (Good)
- particulate matter (PM2.5) dust - 2 (Good)
- carbon monoxide (CO) - 100 (Good)
- nitrogen dioxide (NO2) - 8 (Good)
- ozone (O3) - 0 (Good)
- sulfur dioxide (SO2) - 9 (Good)

What is the air quality in Baicheng Shi today? Is the air polluted in Baicheng Shi?. Is there smog?
What is the level of PM10 today in Baicheng Shi? (particulate matter (PM10) suspended dust)
The current level of particulate matter PM10 in Baicheng Shi is:
7 (Good)
The highest PM10 values usually occur in month: 99 (February 2019).
The lowest value of particulate matter PM10 pollution in Baicheng Shi is usually recorded in: August (22).
What is the current level of PM2.5 in Baicheng Shi? (particulate matter (PM2.5) dust)
Today's PM2.5 level is:
2 (Good)
For comparison, the highest level of PM2.5 in Baicheng Shi in the last 7 days was: 24 (Friday, May 27, 2022) and the lowest: 24 (Friday, May 27, 2022).
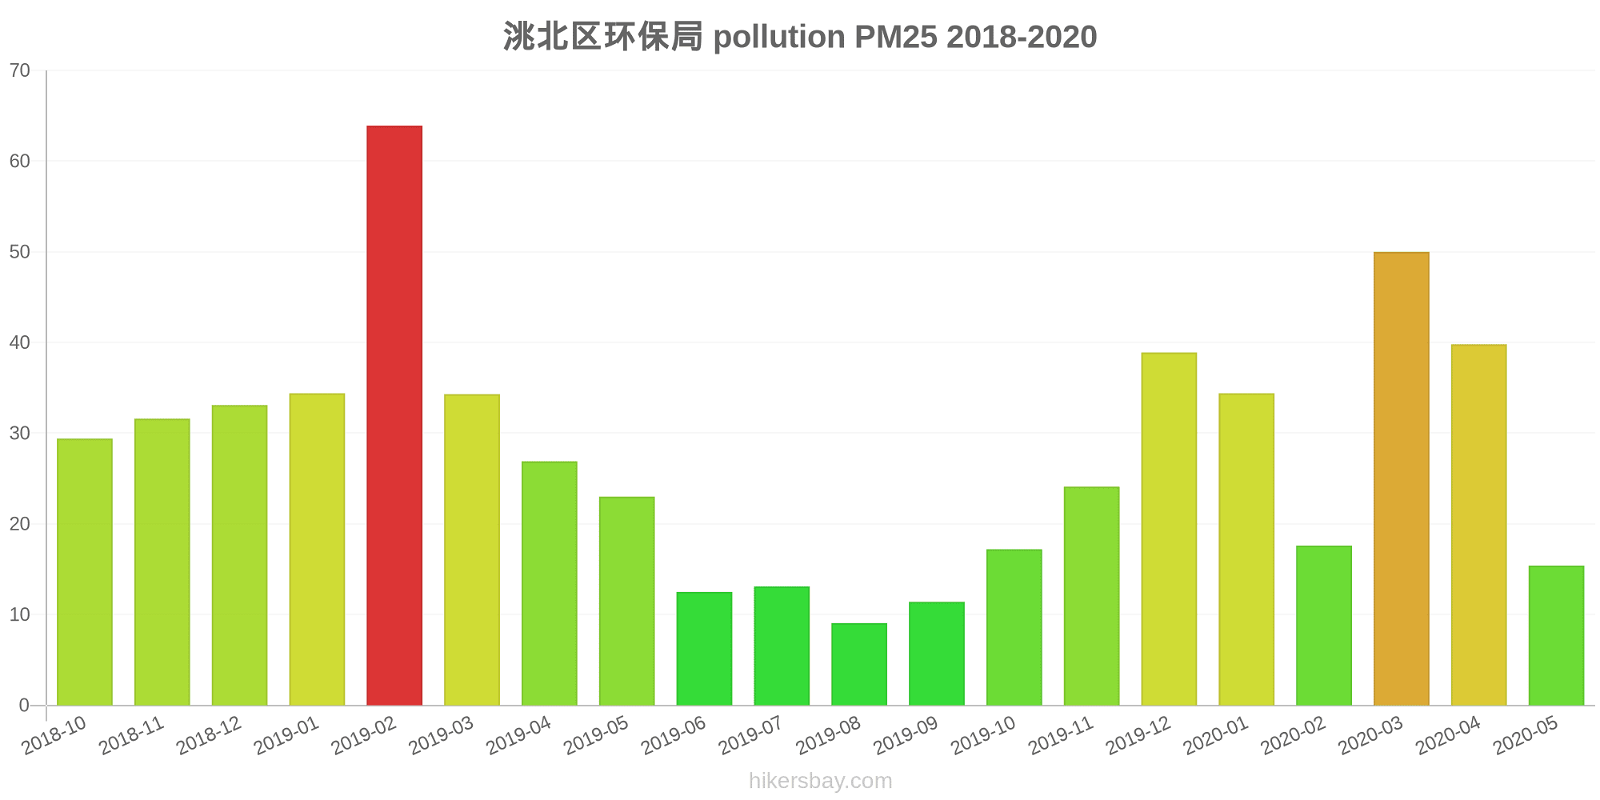
The highest PM2.5 values were recorded: 64 (February 2019).
The lowest level of particulate matter PM2.5 pollution occurs in month: August (9.1).
How high is the CO level? (carbon monoxide (CO))
100 (Good)
How high is the level of NO2? (nitrogen dioxide (NO2))
8 (Good)
How is the O3 level today in Baicheng Shi? (ozone (O3))
0 (Good)
What is the level of SO2 pollution? (sulfur dioxide (SO2))
9 (Good)
Current data Friday, May 27, 2022, 12:00 PM
PM10 7 (Good)
PM2,5 2 (Good)
CO 100 (Good)
NO2 8 (Good)
O3 0 (Good)
SO2 9 (Good)
Data on air pollution from recent days in Baicheng Shi
index
2022-05-27
pm10
32
Moderate
pm25
24
Moderate
co
468
Good
no2
21
Good
o3
32
Good
so2
5
Good
data source »
Air pollution in Baicheng Shi from October 2018 to May 2020

index
2020-05
2020-04
2020-03
2020-02
2020-01
2019-12
2019-11
2019-10
2019-09
2019-08
2019-07
2019-06
2019-05
2019-04
2019-03
2019-02
2019-01
2018-12
2018-11
2018-10
pm25
15 (Moderate)
40 (Unhealthy for Sensitive Groups)
50 (Unhealthy for Sensitive Groups)
18 (Moderate)
34 (Moderate)
39 (Unhealthy for Sensitive Groups)
24 (Moderate)
17 (Moderate)
11 (Good)
9.1 (Good)
13 (Moderate)
13 (Good)
23 (Moderate)
27 (Moderate)
34 (Moderate)
64 (Unhealthy)
34 (Moderate)
33 (Moderate)
32 (Moderate)
29 (Moderate)
co
214 (Good)
656 (Good)
695 (Good)
784 (Good)
874 (Good)
641 (Good)
659 (Good)
455 (Good)
498 (Good)
471 (Good)
297 (Good)
181 (Good)
199 (Good)
512 (Good)
358 (Good)
458 (Good)
473 (Good)
869 (Good)
727 (Good)
814 (Good)
no2
10 (Good)
14 (Good)
13 (Good)
11 (Good)
22 (Good)
20 (Good)
16 (Good)
16 (Good)
14 (Good)
11 (Good)
15 (Good)
10 (Good)
12 (Good)
14 (Good)
18 (Good)
21 (Good)
21 (Good)
20 (Good)
22 (Good)
22 (Good)
o3
101 (Moderate)
99 (Moderate)
96 (Moderate)
89 (Moderate)
86 (Moderate)
56 (Good)
66 (Good)
83 (Moderate)
92 (Moderate)
79 (Moderate)
117 (Moderate)
120 (Unhealthy for Sensitive Groups)
125 (Unhealthy for Sensitive Groups)
118 (Moderate)
104 (Moderate)
72 (Moderate)
74 (Moderate)
62 (Good)
62 (Good)
74 (Moderate)
pm10
30 (Moderate)
59 (Unhealthy for Sensitive Groups)
68 (Unhealthy for Sensitive Groups)
53 (Unhealthy for Sensitive Groups)
76 (Unhealthy for Sensitive Groups)
72 (Unhealthy for Sensitive Groups)
48 (Moderate)
42 (Moderate)
32 (Moderate)
22 (Moderate)
29 (Moderate)
29 (Moderate)
61 (Unhealthy for Sensitive Groups)
81 (Unhealthy)
71 (Unhealthy for Sensitive Groups)
99 (Unhealthy)
74 (Unhealthy for Sensitive Groups)
69 (Unhealthy for Sensitive Groups)
69 (Unhealthy for Sensitive Groups)
72 (Unhealthy for Sensitive Groups)
so2
6.8 (Good)
8 (Good)
6.9 (Good)
8 (Good)
12 (Good)
11 (Good)
7 (Good)
6.8 (Good)
5.9 (Good)
6.1 (Good)
20 (Good)
5.2 (Good)
6 (Good)
11 (Good)
13 (Good)
14 (Good)
12 (Good)
11 (Good)
12 (Good)
9.9 (Good)
data source »
洮北区环保局
Friday, May 27, 2022, 12:00 PM
PM10 6.7 (Good)
particulate matter (PM10) suspended dust
PM2,5 1.7 (Good)
particulate matter (PM2.5) dust
CO 100 (Good)
carbon monoxide (CO)
NO2 7.6 (Good)
nitrogen dioxide (NO2)
O3 0.02 (Good)
ozone (O3)
SO2 8.6 (Good)
sulfur dioxide (SO2)
洮北区环保局
index
2022-05-27
pm10
32
pm25
24
co
468
no2
21
o3
32
so2
4.6
洮北区环保局
2018-10 2020-05
index
2020-05
2020-04
2020-03
2020-02
2020-01
2019-12
2019-11
2019-10
2019-09
2019-08
2019-07
2019-06
2019-05
2019-04
2019-03
2019-02
2019-01
2018-12
2018-11
2018-10
pm25
15
40
50
18
34
39
24
17
11
9.1
13
13
23
27
34
64
34
33
32
29
co
214
656
695
784
874
641
659
455
498
471
297
181
199
512
358
458
473
869
727
814
no2
10
14
13
11
22
20
16
16
14
11
15
10
12
14
18
21
21
20
22
22
o3
101
99
96
89
86
56
66
83
92
79
117
120
125
118
104
72
74
62
62
74
pm10
30
59
68
53
76
72
48
42
32
22
29
29
61
81
71
99
74
69
69
72
so2
6.8
8
6.9
8
12
11
7
6.8
5.9
6.1
20
5.2
6
11
13
14
12
11
12
9.9
* Pollution data source:
https://openaq.org
(ChinaAQIData)
The data is licensed under CC-By 4.0
PM10 7 (Good)
PM2,5 2 (Good)
CO 100 (Good)
NO2 8 (Good)
O3 0 (Good)
SO2 9 (Good)
Data on air pollution from recent days in Baicheng Shi
| index | 2022-05-27 |
|---|---|
| pm10 | 32 Moderate |
| pm25 | 24 Moderate |
| co | 468 Good |
| no2 | 21 Good |
| o3 | 32 Good |
| so2 | 5 Good |

| index | 2020-05 | 2020-04 | 2020-03 | 2020-02 | 2020-01 | 2019-12 | 2019-11 | 2019-10 | 2019-09 | 2019-08 | 2019-07 | 2019-06 | 2019-05 | 2019-04 | 2019-03 | 2019-02 | 2019-01 | 2018-12 | 2018-11 | 2018-10 |
|---|---|---|---|---|---|---|---|---|---|---|---|---|---|---|---|---|---|---|---|---|
| pm25 | 15 (Moderate) | 40 (Unhealthy for Sensitive Groups) | 50 (Unhealthy for Sensitive Groups) | 18 (Moderate) | 34 (Moderate) | 39 (Unhealthy for Sensitive Groups) | 24 (Moderate) | 17 (Moderate) | 11 (Good) | 9.1 (Good) | 13 (Moderate) | 13 (Good) | 23 (Moderate) | 27 (Moderate) | 34 (Moderate) | 64 (Unhealthy) | 34 (Moderate) | 33 (Moderate) | 32 (Moderate) | 29 (Moderate) |
| co | 214 (Good) | 656 (Good) | 695 (Good) | 784 (Good) | 874 (Good) | 641 (Good) | 659 (Good) | 455 (Good) | 498 (Good) | 471 (Good) | 297 (Good) | 181 (Good) | 199 (Good) | 512 (Good) | 358 (Good) | 458 (Good) | 473 (Good) | 869 (Good) | 727 (Good) | 814 (Good) |
| no2 | 10 (Good) | 14 (Good) | 13 (Good) | 11 (Good) | 22 (Good) | 20 (Good) | 16 (Good) | 16 (Good) | 14 (Good) | 11 (Good) | 15 (Good) | 10 (Good) | 12 (Good) | 14 (Good) | 18 (Good) | 21 (Good) | 21 (Good) | 20 (Good) | 22 (Good) | 22 (Good) |
| o3 | 101 (Moderate) | 99 (Moderate) | 96 (Moderate) | 89 (Moderate) | 86 (Moderate) | 56 (Good) | 66 (Good) | 83 (Moderate) | 92 (Moderate) | 79 (Moderate) | 117 (Moderate) | 120 (Unhealthy for Sensitive Groups) | 125 (Unhealthy for Sensitive Groups) | 118 (Moderate) | 104 (Moderate) | 72 (Moderate) | 74 (Moderate) | 62 (Good) | 62 (Good) | 74 (Moderate) |
| pm10 | 30 (Moderate) | 59 (Unhealthy for Sensitive Groups) | 68 (Unhealthy for Sensitive Groups) | 53 (Unhealthy for Sensitive Groups) | 76 (Unhealthy for Sensitive Groups) | 72 (Unhealthy for Sensitive Groups) | 48 (Moderate) | 42 (Moderate) | 32 (Moderate) | 22 (Moderate) | 29 (Moderate) | 29 (Moderate) | 61 (Unhealthy for Sensitive Groups) | 81 (Unhealthy) | 71 (Unhealthy for Sensitive Groups) | 99 (Unhealthy) | 74 (Unhealthy for Sensitive Groups) | 69 (Unhealthy for Sensitive Groups) | 69 (Unhealthy for Sensitive Groups) | 72 (Unhealthy for Sensitive Groups) |
| so2 | 6.8 (Good) | 8 (Good) | 6.9 (Good) | 8 (Good) | 12 (Good) | 11 (Good) | 7 (Good) | 6.8 (Good) | 5.9 (Good) | 6.1 (Good) | 20 (Good) | 5.2 (Good) | 6 (Good) | 11 (Good) | 13 (Good) | 14 (Good) | 12 (Good) | 11 (Good) | 12 (Good) | 9.9 (Good) |
PM10 6.7 (Good)
particulate matter (PM10) suspended dustPM2,5 1.7 (Good)
particulate matter (PM2.5) dustCO 100 (Good)
carbon monoxide (CO)NO2 7.6 (Good)
nitrogen dioxide (NO2)O3 0.02 (Good)
ozone (O3)SO2 8.6 (Good)
sulfur dioxide (SO2)洮北区环保局
| index | 2022-05-27 |
|---|---|
| pm10 | 32 |
| pm25 | 24 |
| co | 468 |
| no2 | 21 |
| o3 | 32 |
| so2 | 4.6 |
洮北区环保局

| index | 2020-05 | 2020-04 | 2020-03 | 2020-02 | 2020-01 | 2019-12 | 2019-11 | 2019-10 | 2019-09 | 2019-08 | 2019-07 | 2019-06 | 2019-05 | 2019-04 | 2019-03 | 2019-02 | 2019-01 | 2018-12 | 2018-11 | 2018-10 |
|---|---|---|---|---|---|---|---|---|---|---|---|---|---|---|---|---|---|---|---|---|
| pm25 | 15 | 40 | 50 | 18 | 34 | 39 | 24 | 17 | 11 | 9.1 | 13 | 13 | 23 | 27 | 34 | 64 | 34 | 33 | 32 | 29 |
| co | 214 | 656 | 695 | 784 | 874 | 641 | 659 | 455 | 498 | 471 | 297 | 181 | 199 | 512 | 358 | 458 | 473 | 869 | 727 | 814 |
| no2 | 10 | 14 | 13 | 11 | 22 | 20 | 16 | 16 | 14 | 11 | 15 | 10 | 12 | 14 | 18 | 21 | 21 | 20 | 22 | 22 |
| o3 | 101 | 99 | 96 | 89 | 86 | 56 | 66 | 83 | 92 | 79 | 117 | 120 | 125 | 118 | 104 | 72 | 74 | 62 | 62 | 74 |
| pm10 | 30 | 59 | 68 | 53 | 76 | 72 | 48 | 42 | 32 | 22 | 29 | 29 | 61 | 81 | 71 | 99 | 74 | 69 | 69 | 72 |
| so2 | 6.8 | 8 | 6.9 | 8 | 12 | 11 | 7 | 6.8 | 5.9 | 6.1 | 20 | 5.2 | 6 | 11 | 13 | 14 | 12 | 11 | 12 | 9.9 |