Air Pollution in Chaoyang Shi: Real-time Air Quality Index and smog alert.
Pollution and air quality forecast for Chaoyang Shi. Today is Tuesday, June 16, 2026. The following air pollution values have been recorded for Chaoyang Shi:- particulate matter (PM10) suspended dust - 7 (Good)
- particulate matter (PM2.5) dust - 2 (Good)
- carbon monoxide (CO) - 100 (Good)
- nitrogen dioxide (NO2) - 8 (Good)
- ozone (O3) - 0 (Good)
- sulfur dioxide (SO2) - 9 (Good)

What is the air quality in Chaoyang Shi today? Is the air polluted in Chaoyang Shi?. Is there smog?
What is the level of PM10 today in Chaoyang Shi? (particulate matter (PM10) suspended dust)
The current level of particulate matter PM10 in Chaoyang Shi is:
7 (Good)
The highest PM10 values usually occur in month: 102 (January 2020).
The lowest value of particulate matter PM10 pollution in Chaoyang Shi is usually recorded in: August (30).
What is the current level of PM2.5 in Chaoyang Shi? (particulate matter (PM2.5) dust)
Today's PM2.5 level is:
2 (Good)
For comparison, the highest level of PM2.5 in Chaoyang Shi in the last 7 days was: 24 (Friday, May 27, 2022) and the lowest: 24 (Friday, May 27, 2022).
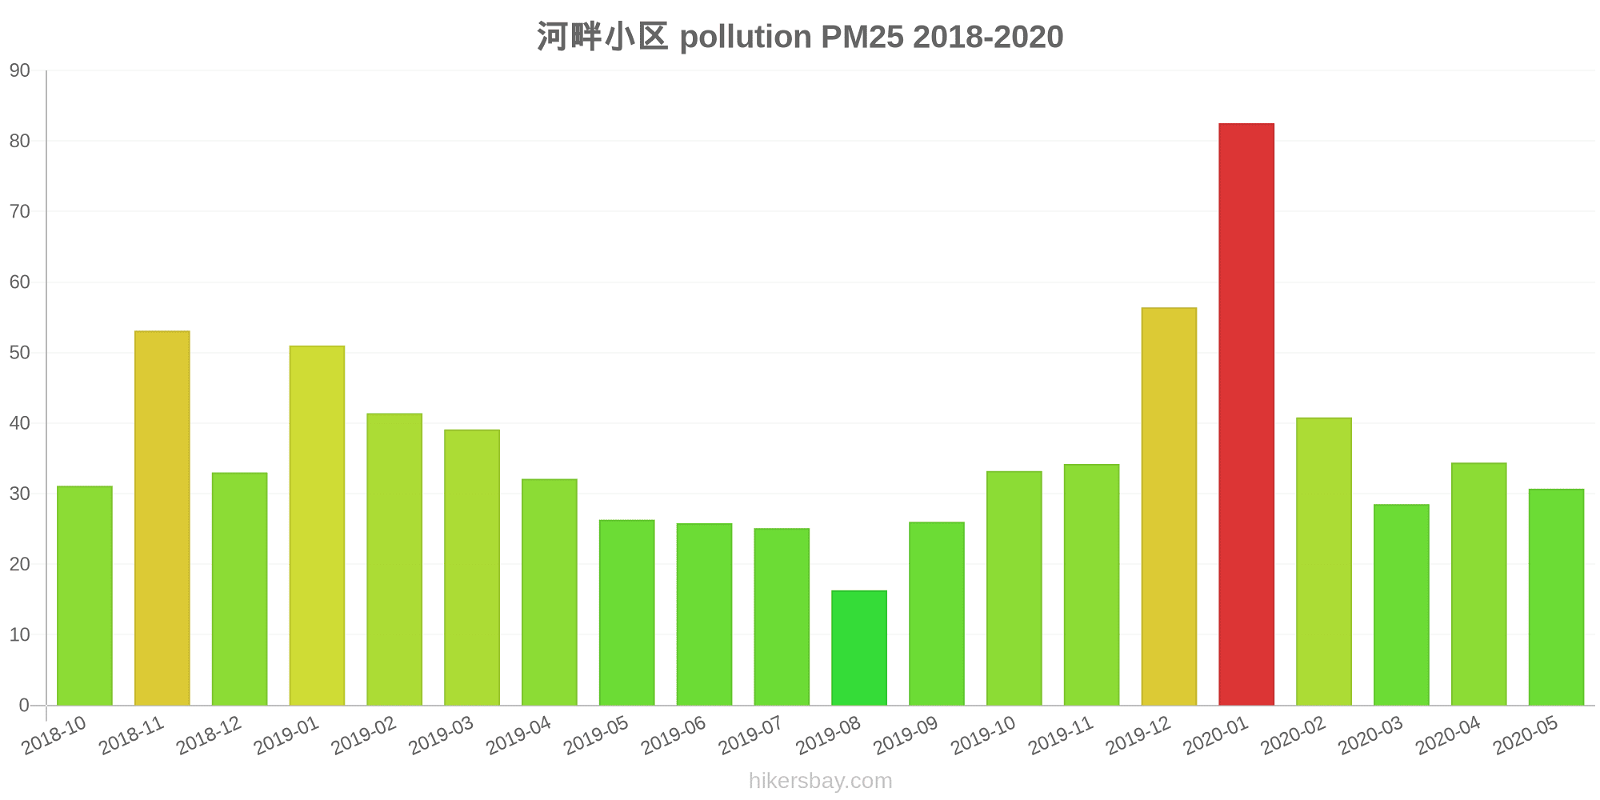
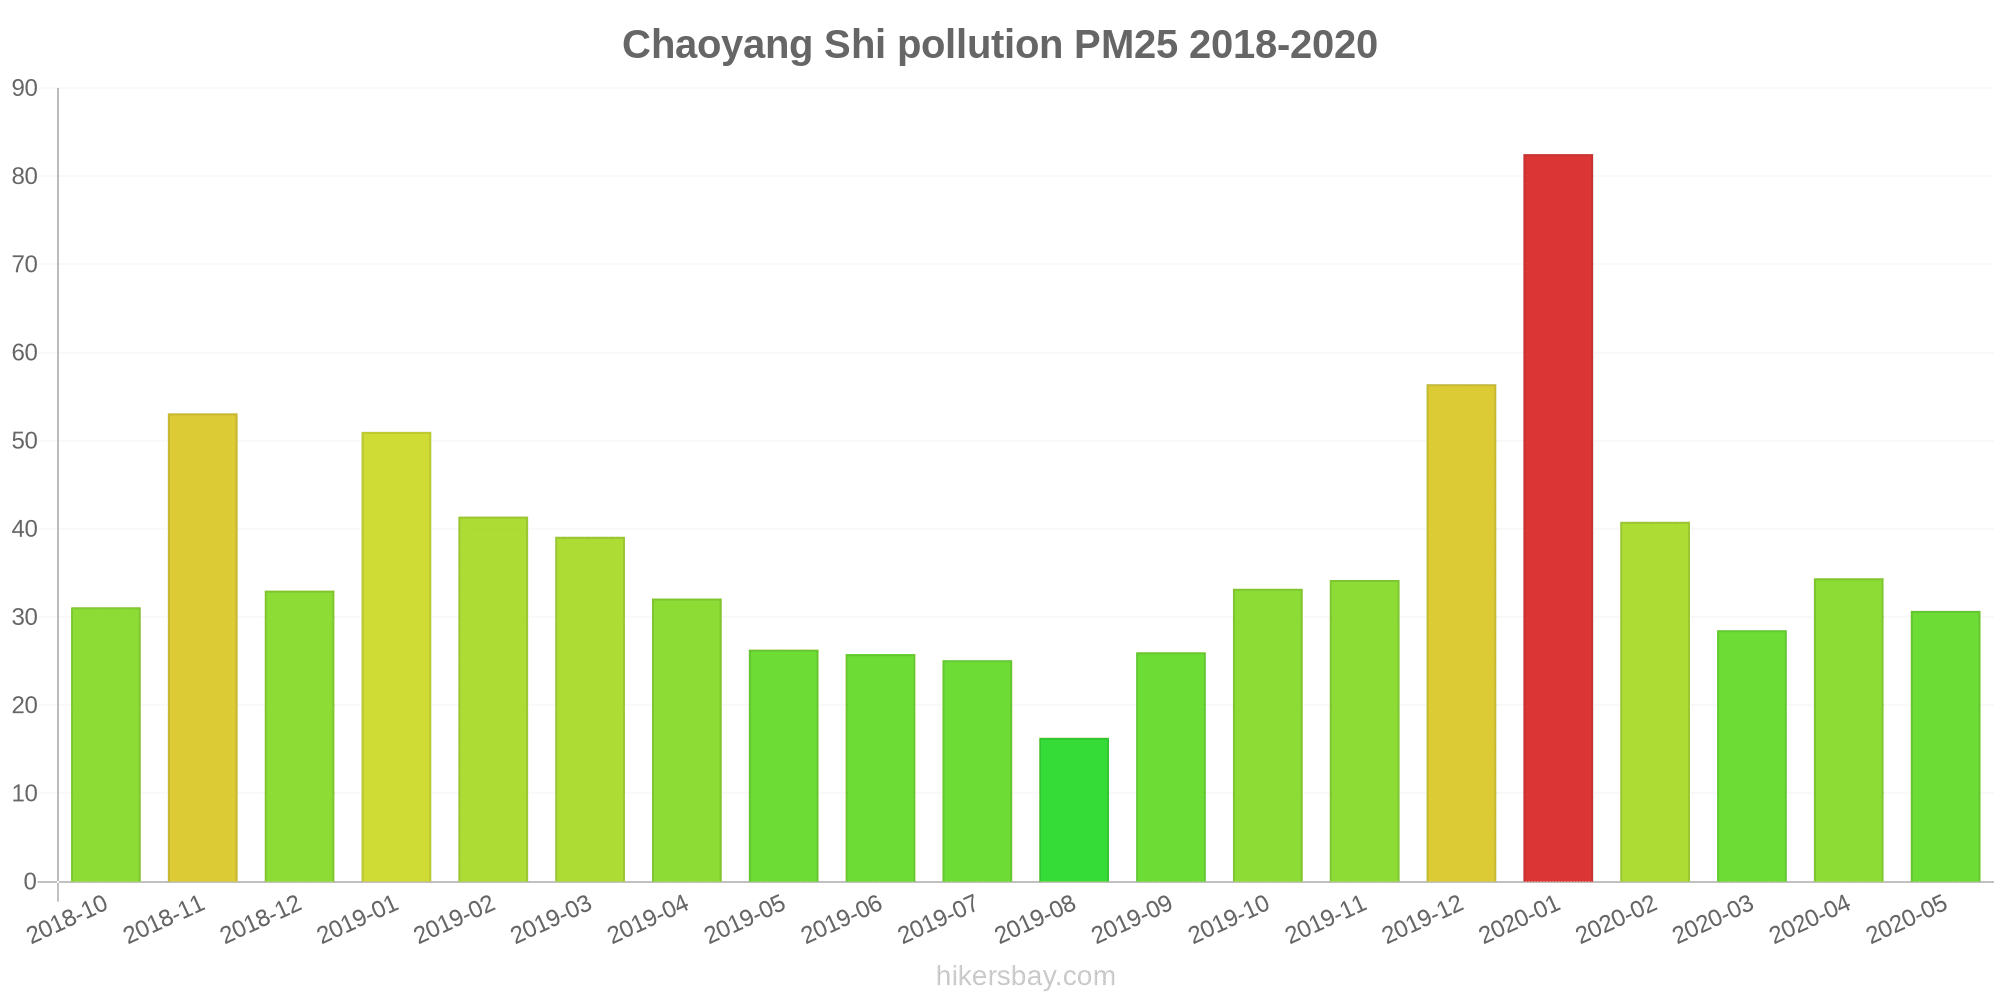
The highest PM2.5 values were recorded: 83 (January 2020).
The lowest level of particulate matter PM2.5 pollution occurs in month: August (16).
How high is the CO level? (carbon monoxide (CO))
100 (Good)
How high is the level of NO2? (nitrogen dioxide (NO2))
8 (Good)
How is the O3 level today in Chaoyang Shi? (ozone (O3))
0 (Good)
What is the level of SO2 pollution? (sulfur dioxide (SO2))
9 (Good)
Current data Friday, May 27, 2022, 12:00 PM
PM10 7 (Good)
PM2,5 2 (Good)
CO 100 (Good)
NO2 8 (Good)
O3 0 (Good)
SO2 9 (Good)
Data on air pollution from recent days in Chaoyang Shi
index
2022-05-27
pm10
32
Moderate
pm25
24
Moderate
co
468
Good
no2
21
Good
o3
32
Good
so2
5
Good
data source »
Air pollution in Chaoyang Shi from October 2018 to May 2020

index
2020-05
2020-04
2020-03
2020-02
2020-01
2019-12
2019-11
2019-10
2019-09
2019-08
2019-07
2019-06
2019-05
2019-04
2019-03
2019-02
2019-01
2018-12
2018-11
2018-10
pm25
31 (Moderate)
34 (Moderate)
29 (Moderate)
41 (Unhealthy for Sensitive Groups)
83 (Very Unhealthy)
56 (Unhealthy)
34 (Moderate)
33 (Moderate)
26 (Moderate)
16 (Moderate)
25 (Moderate)
26 (Moderate)
26 (Moderate)
32 (Moderate)
39 (Unhealthy for Sensitive Groups)
41 (Unhealthy for Sensitive Groups)
51 (Unhealthy for Sensitive Groups)
33 (Moderate)
53 (Unhealthy for Sensitive Groups)
31 (Moderate)
co
750 (Good)
796 (Good)
771 (Good)
989 (Good)
1 (Good)
1 (Good)
819 (Good)
901 (Good)
864 (Good)
787 (Good)
974 (Good)
796 (Good)
728 (Good)
679 (Good)
935 (Good)
1 (Good)
1 (Good)
927 (Good)
1 (Good)
1 (Good)
no2
12 (Good)
17 (Good)
15 (Good)
13 (Good)
34 (Good)
32 (Good)
26 (Good)
24 (Good)
18 (Good)
11 (Good)
13 (Good)
13 (Good)
15 (Good)
18 (Good)
21 (Good)
23 (Good)
33 (Good)
26 (Good)
33 (Good)
26 (Good)
o3
141 (Unhealthy for Sensitive Groups)
115 (Moderate)
89 (Moderate)
84 (Moderate)
73 (Moderate)
62 (Good)
72 (Moderate)
102 (Moderate)
133 (Unhealthy for Sensitive Groups)
110 (Moderate)
160 (Unhealthy)
161 (Unhealthy)
150 (Unhealthy)
121 (Unhealthy for Sensitive Groups)
111 (Moderate)
83 (Moderate)
65 (Good)
59 (Good)
69 (Good)
87 (Moderate)
pm10
65 (Unhealthy for Sensitive Groups)
71 (Unhealthy for Sensitive Groups)
52 (Unhealthy for Sensitive Groups)
57 (Unhealthy for Sensitive Groups)
102 (Unhealthy)
75 (Unhealthy for Sensitive Groups)
63 (Unhealthy for Sensitive Groups)
63 (Unhealthy for Sensitive Groups)
52 (Unhealthy for Sensitive Groups)
30 (Moderate)
42 (Moderate)
40 (Moderate)
67 (Unhealthy for Sensitive Groups)
85 (Unhealthy)
76 (Unhealthy for Sensitive Groups)
70 (Unhealthy for Sensitive Groups)
90 (Unhealthy)
68 (Unhealthy for Sensitive Groups)
94 (Unhealthy)
61 (Unhealthy for Sensitive Groups)
so2
14 (Good)
13 (Good)
13 (Good)
15 (Good)
33 (Good)
30 (Good)
20 (Good)
17 (Good)
15 (Good)
12 (Good)
12 (Good)
15 (Good)
15 (Good)
18 (Good)
20 (Good)
26 (Good)
30 (Good)
26 (Good)
25 (Good)
10 (Good)
data source »
河畔小区
Friday, May 27, 2022, 12:00 PM
PM10 6.7 (Good)
particulate matter (PM10) suspended dust
PM2,5 1.7 (Good)
particulate matter (PM2.5) dust
CO 100 (Good)
carbon monoxide (CO)
NO2 7.6 (Good)
nitrogen dioxide (NO2)
O3 0.02 (Good)
ozone (O3)
SO2 8.6 (Good)
sulfur dioxide (SO2)
河畔小区
index
2022-05-27
pm10
32
pm25
24
co
468
no2
21
o3
32
so2
4.6
河畔小区
2018-10 2020-05
index
2020-05
2020-04
2020-03
2020-02
2020-01
2019-12
2019-11
2019-10
2019-09
2019-08
2019-07
2019-06
2019-05
2019-04
2019-03
2019-02
2019-01
2018-12
2018-11
2018-10
pm25
31
34
29
41
83
56
34
33
26
16
25
26
26
32
39
41
51
33
53
31
co
750
796
771
989
1
1
819
901
864
787
974
796
728
679
935
1
1
927
1
1
no2
12
17
15
13
34
32
26
24
18
11
13
13
15
18
21
23
33
26
33
26
o3
141
115
89
84
73
62
72
102
133
110
160
161
150
121
111
83
65
59
69
87
pm10
65
71
52
57
102
75
63
63
52
30
42
40
67
85
76
70
90
68
94
61
so2
14
13
13
15
33
30
20
17
15
12
12
15
15
18
20
26
30
26
25
10
* Pollution data source:
https://openaq.org
(ChinaAQIData)
The data is licensed under CC-By 4.0
PM10 7 (Good)
PM2,5 2 (Good)
CO 100 (Good)
NO2 8 (Good)
O3 0 (Good)
SO2 9 (Good)
Data on air pollution from recent days in Chaoyang Shi
| index | 2022-05-27 |
|---|---|
| pm10 | 32 Moderate |
| pm25 | 24 Moderate |
| co | 468 Good |
| no2 | 21 Good |
| o3 | 32 Good |
| so2 | 5 Good |
| index | 2020-05 | 2020-04 | 2020-03 | 2020-02 | 2020-01 | 2019-12 | 2019-11 | 2019-10 | 2019-09 | 2019-08 | 2019-07 | 2019-06 | 2019-05 | 2019-04 | 2019-03 | 2019-02 | 2019-01 | 2018-12 | 2018-11 | 2018-10 |
|---|---|---|---|---|---|---|---|---|---|---|---|---|---|---|---|---|---|---|---|---|
| pm25 | 31 (Moderate) | 34 (Moderate) | 29 (Moderate) | 41 (Unhealthy for Sensitive Groups) | 83 (Very Unhealthy) | 56 (Unhealthy) | 34 (Moderate) | 33 (Moderate) | 26 (Moderate) | 16 (Moderate) | 25 (Moderate) | 26 (Moderate) | 26 (Moderate) | 32 (Moderate) | 39 (Unhealthy for Sensitive Groups) | 41 (Unhealthy for Sensitive Groups) | 51 (Unhealthy for Sensitive Groups) | 33 (Moderate) | 53 (Unhealthy for Sensitive Groups) | 31 (Moderate) |
| co | 750 (Good) | 796 (Good) | 771 (Good) | 989 (Good) | 1 (Good) | 1 (Good) | 819 (Good) | 901 (Good) | 864 (Good) | 787 (Good) | 974 (Good) | 796 (Good) | 728 (Good) | 679 (Good) | 935 (Good) | 1 (Good) | 1 (Good) | 927 (Good) | 1 (Good) | 1 (Good) |
| no2 | 12 (Good) | 17 (Good) | 15 (Good) | 13 (Good) | 34 (Good) | 32 (Good) | 26 (Good) | 24 (Good) | 18 (Good) | 11 (Good) | 13 (Good) | 13 (Good) | 15 (Good) | 18 (Good) | 21 (Good) | 23 (Good) | 33 (Good) | 26 (Good) | 33 (Good) | 26 (Good) |
| o3 | 141 (Unhealthy for Sensitive Groups) | 115 (Moderate) | 89 (Moderate) | 84 (Moderate) | 73 (Moderate) | 62 (Good) | 72 (Moderate) | 102 (Moderate) | 133 (Unhealthy for Sensitive Groups) | 110 (Moderate) | 160 (Unhealthy) | 161 (Unhealthy) | 150 (Unhealthy) | 121 (Unhealthy for Sensitive Groups) | 111 (Moderate) | 83 (Moderate) | 65 (Good) | 59 (Good) | 69 (Good) | 87 (Moderate) |
| pm10 | 65 (Unhealthy for Sensitive Groups) | 71 (Unhealthy for Sensitive Groups) | 52 (Unhealthy for Sensitive Groups) | 57 (Unhealthy for Sensitive Groups) | 102 (Unhealthy) | 75 (Unhealthy for Sensitive Groups) | 63 (Unhealthy for Sensitive Groups) | 63 (Unhealthy for Sensitive Groups) | 52 (Unhealthy for Sensitive Groups) | 30 (Moderate) | 42 (Moderate) | 40 (Moderate) | 67 (Unhealthy for Sensitive Groups) | 85 (Unhealthy) | 76 (Unhealthy for Sensitive Groups) | 70 (Unhealthy for Sensitive Groups) | 90 (Unhealthy) | 68 (Unhealthy for Sensitive Groups) | 94 (Unhealthy) | 61 (Unhealthy for Sensitive Groups) |
| so2 | 14 (Good) | 13 (Good) | 13 (Good) | 15 (Good) | 33 (Good) | 30 (Good) | 20 (Good) | 17 (Good) | 15 (Good) | 12 (Good) | 12 (Good) | 15 (Good) | 15 (Good) | 18 (Good) | 20 (Good) | 26 (Good) | 30 (Good) | 26 (Good) | 25 (Good) | 10 (Good) |
PM10 6.7 (Good)
particulate matter (PM10) suspended dustPM2,5 1.7 (Good)
particulate matter (PM2.5) dustCO 100 (Good)
carbon monoxide (CO)NO2 7.6 (Good)
nitrogen dioxide (NO2)O3 0.02 (Good)
ozone (O3)SO2 8.6 (Good)
sulfur dioxide (SO2)河畔小区
| index | 2022-05-27 |
|---|---|
| pm10 | 32 |
| pm25 | 24 |
| co | 468 |
| no2 | 21 |
| o3 | 32 |
| so2 | 4.6 |
河畔小区

| index | 2020-05 | 2020-04 | 2020-03 | 2020-02 | 2020-01 | 2019-12 | 2019-11 | 2019-10 | 2019-09 | 2019-08 | 2019-07 | 2019-06 | 2019-05 | 2019-04 | 2019-03 | 2019-02 | 2019-01 | 2018-12 | 2018-11 | 2018-10 |
|---|---|---|---|---|---|---|---|---|---|---|---|---|---|---|---|---|---|---|---|---|
| pm25 | 31 | 34 | 29 | 41 | 83 | 56 | 34 | 33 | 26 | 16 | 25 | 26 | 26 | 32 | 39 | 41 | 51 | 33 | 53 | 31 |
| co | 750 | 796 | 771 | 989 | 1 | 1 | 819 | 901 | 864 | 787 | 974 | 796 | 728 | 679 | 935 | 1 | 1 | 927 | 1 | 1 |
| no2 | 12 | 17 | 15 | 13 | 34 | 32 | 26 | 24 | 18 | 11 | 13 | 13 | 15 | 18 | 21 | 23 | 33 | 26 | 33 | 26 |
| o3 | 141 | 115 | 89 | 84 | 73 | 62 | 72 | 102 | 133 | 110 | 160 | 161 | 150 | 121 | 111 | 83 | 65 | 59 | 69 | 87 |
| pm10 | 65 | 71 | 52 | 57 | 102 | 75 | 63 | 63 | 52 | 30 | 42 | 40 | 67 | 85 | 76 | 70 | 90 | 68 | 94 | 61 |
| so2 | 14 | 13 | 13 | 15 | 33 | 30 | 20 | 17 | 15 | 12 | 12 | 15 | 15 | 18 | 20 | 26 | 30 | 26 | 25 | 10 |