Air Pollution in Dafanhecun: Real-time Air Quality Index and smog alert.
Pollution and air quality forecast for Dafanhecun. Today is Sunday, June 21, 2026. The following air pollution values have been recorded for Dafanhecun:- particulate matter (PM10) suspended dust - 7 (Good)
- particulate matter (PM2.5) dust - 2 (Good)
- carbon monoxide (CO) - 100 (Good)
- nitrogen dioxide (NO2) - 8 (Good)
- ozone (O3) - 0 (Good)
- sulfur dioxide (SO2) - 9 (Good)

What is the air quality in Dafanhecun today? Is the air polluted in Dafanhecun?. Is there smog?
What is the level of PM10 today in Dafanhecun? (particulate matter (PM10) suspended dust)
The current level of particulate matter PM10 in Dafanhecun is:
7 (Good)
The highest PM10 values usually occur in month: 131 (January 2020).
The lowest value of particulate matter PM10 pollution in Dafanhecun is usually recorded in: August (28).
What is the current level of PM2.5 in Dafanhecun? (particulate matter (PM2.5) dust)
Today's PM2.5 level is:
2 (Good)
For comparison, the highest level of PM2.5 in Dafanhecun in the last 7 days was: 24 (Friday, May 27, 2022) and the lowest: 24 (Friday, May 27, 2022).
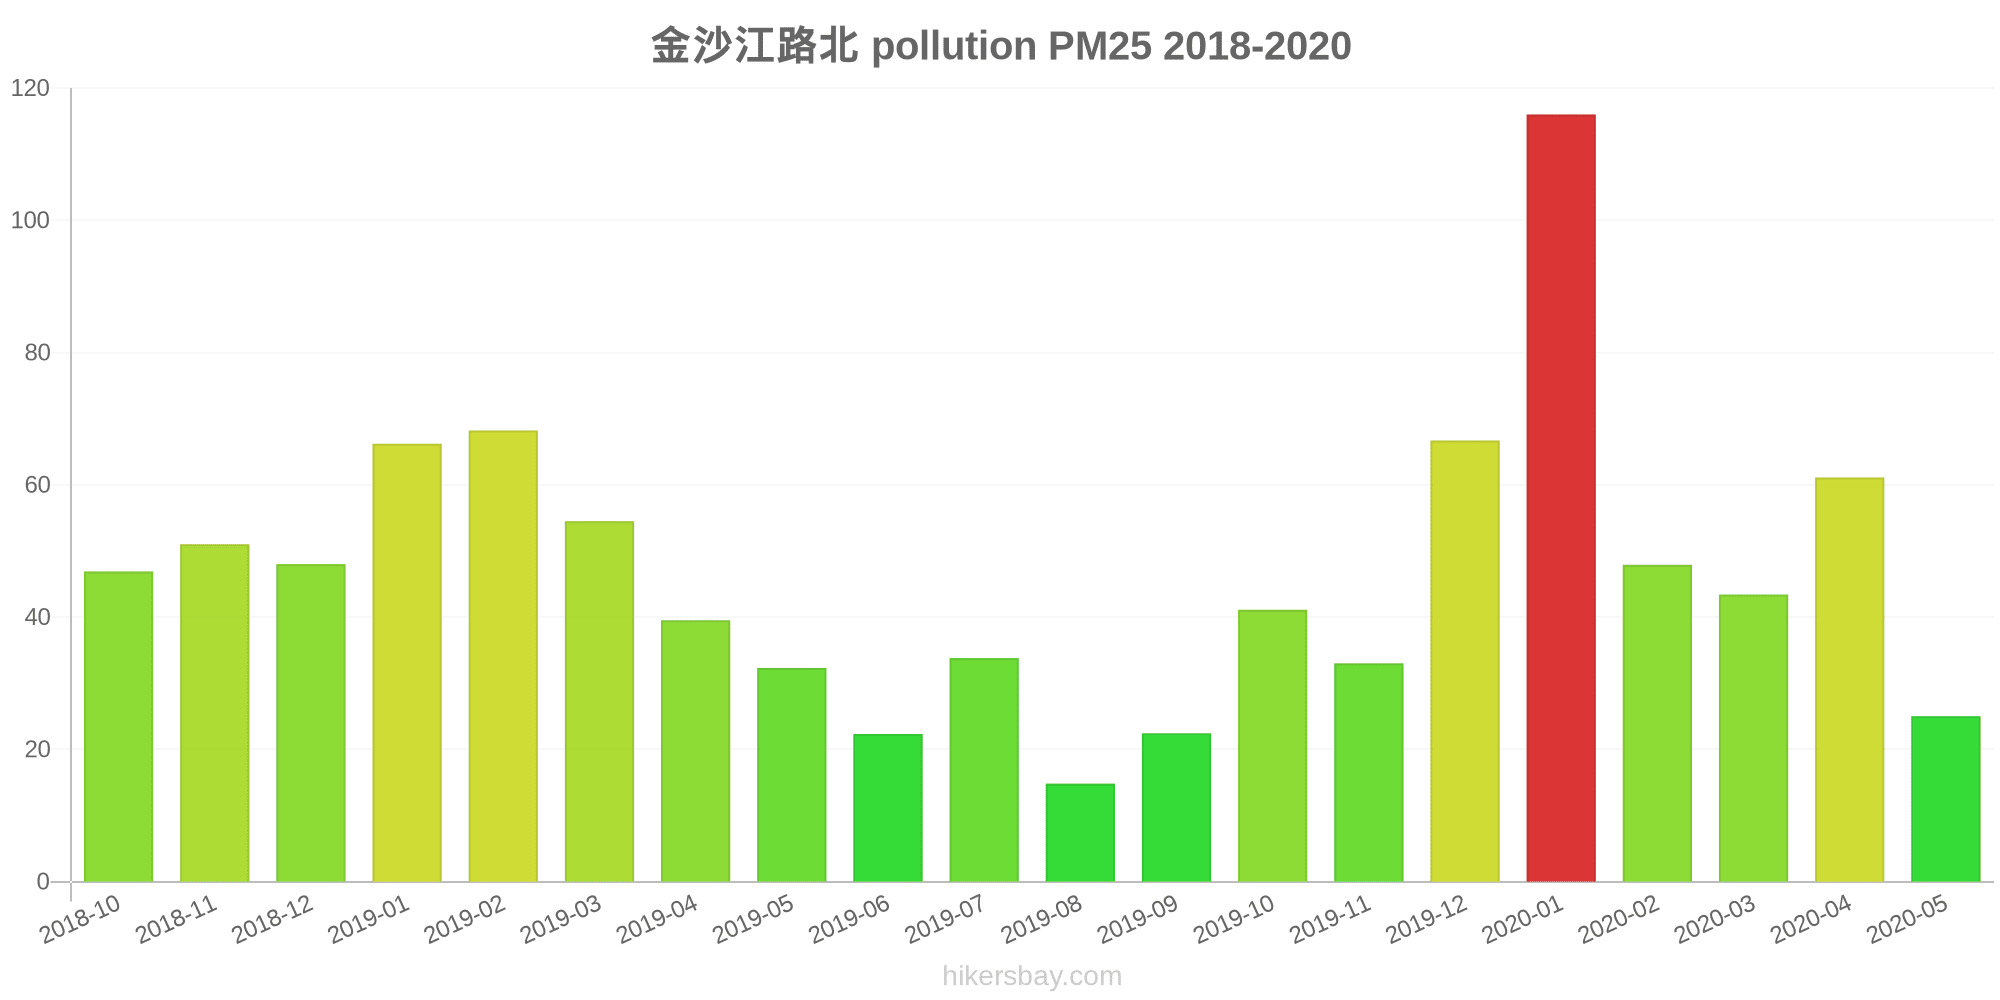
The highest PM2.5 values were recorded: 116 (January 2020).
The lowest level of particulate matter PM2.5 pollution occurs in month: August (15).
How high is the CO level? (carbon monoxide (CO))
100 (Good)
How high is the level of NO2? (nitrogen dioxide (NO2))
8 (Good)
How is the O3 level today in Dafanhecun? (ozone (O3))
0 (Good)
What is the level of SO2 pollution? (sulfur dioxide (SO2))
9 (Good)
Current data Friday, May 27, 2022, 12:00 PM
PM10 7 (Good)
PM2,5 2 (Good)
CO 100 (Good)
NO2 8 (Good)
O3 0 (Good)
SO2 9 (Good)
Data on air pollution from recent days in Dafanhecun
index
2022-05-27
pm10
32
Moderate
pm25
24
Moderate
co
468
Good
no2
21
Good
o3
32
Good
so2
5
Good
data source »
Air pollution in Dafanhecun from October 2018 to May 2020

index
2020-05
2020-04
2020-03
2020-02
2020-01
2019-12
2019-11
2019-10
2019-09
2019-08
2019-07
2019-06
2019-05
2019-04
2019-03
2019-02
2019-01
2018-12
2018-11
2018-10
pm25
25 (Moderate)
61 (Unhealthy)
43 (Unhealthy for Sensitive Groups)
48 (Unhealthy for Sensitive Groups)
116 (Very bad Hazardous)
67 (Unhealthy)
33 (Moderate)
41 (Unhealthy for Sensitive Groups)
22 (Moderate)
15 (Moderate)
34 (Moderate)
22 (Moderate)
32 (Moderate)
40 (Unhealthy for Sensitive Groups)
55 (Unhealthy for Sensitive Groups)
68 (Unhealthy)
66 (Unhealthy)
48 (Unhealthy for Sensitive Groups)
51 (Unhealthy for Sensitive Groups)
47 (Unhealthy for Sensitive Groups)
co
418 (Good)
553 (Good)
629 (Good)
761 (Good)
1 (Good)
888 (Good)
666 (Good)
600 (Good)
656 (Good)
514 (Good)
615 (Good)
559 (Good)
573 (Good)
835 (Good)
968 (Good)
908 (Good)
871 (Good)
783 (Good)
805 (Good)
955 (Good)
no2
19 (Good)
33 (Good)
27 (Good)
26 (Good)
47 (Moderate)
39 (Good)
30 (Good)
31 (Good)
26 (Good)
14 (Good)
20 (Good)
28 (Good)
28 (Good)
33 (Good)
35 (Good)
33 (Good)
44 (Moderate)
35 (Good)
40 (Moderate)
32 (Good)
o3
132 (Unhealthy for Sensitive Groups)
133 (Unhealthy for Sensitive Groups)
109 (Moderate)
93 (Moderate)
84 (Moderate)
64 (Good)
63 (Good)
99 (Moderate)
120 (Unhealthy for Sensitive Groups)
103 (Moderate)
145 (Unhealthy for Sensitive Groups)
139 (Unhealthy for Sensitive Groups)
148 (Unhealthy for Sensitive Groups)
119 (Moderate)
107 (Moderate)
98 (Moderate)
66 (Good)
59 (Good)
61 (Good)
80 (Moderate)
pm10
77 (Unhealthy for Sensitive Groups)
103 (Unhealthy)
69 (Unhealthy for Sensitive Groups)
61 (Unhealthy for Sensitive Groups)
131 (Very Unhealthy)
81 (Unhealthy)
57 (Unhealthy for Sensitive Groups)
76 (Unhealthy for Sensitive Groups)
49 (Moderate)
28 (Moderate)
54 (Unhealthy for Sensitive Groups)
42 (Moderate)
80 (Unhealthy for Sensitive Groups)
109 (Unhealthy)
99 (Unhealthy)
91 (Unhealthy)
108 (Unhealthy)
79 (Unhealthy for Sensitive Groups)
78 (Unhealthy for Sensitive Groups)
66 (Unhealthy for Sensitive Groups)
so2
9.4 (Good)
11 (Good)
12 (Good)
14 (Good)
17 (Good)
16 (Good)
12 (Good)
12 (Good)
13 (Good)
9.4 (Good)
11 (Good)
9.3 (Good)
14 (Good)
13 (Good)
16 (Good)
21 (Good)
22 (Good)
15 (Good)
13 (Good)
8.9 (Good)
data source »
金沙江路北
Friday, May 27, 2022, 12:00 PM
PM10 6.7 (Good)
particulate matter (PM10) suspended dust
PM2,5 1.7 (Good)
particulate matter (PM2.5) dust
CO 100 (Good)
carbon monoxide (CO)
NO2 7.6 (Good)
nitrogen dioxide (NO2)
O3 0.02 (Good)
ozone (O3)
SO2 8.6 (Good)
sulfur dioxide (SO2)
金沙江路北
index
2022-05-27
pm10
32
pm25
24
co
468
no2
21
o3
32
so2
4.6
金沙江路北
2018-10 2020-05

index
2020-05
2020-04
2020-03
2020-02
2020-01
2019-12
2019-11
2019-10
2019-09
2019-08
2019-07
2019-06
2019-05
2019-04
2019-03
2019-02
2019-01
2018-12
2018-11
2018-10
pm25
25
61
43
48
116
67
33
41
22
15
34
22
32
40
55
68
66
48
51
47
co
418
553
629
761
1
888
666
600
656
514
615
559
573
835
968
908
871
783
805
955
no2
19
33
27
26
47
39
30
31
26
14
20
28
28
33
35
33
44
35
40
32
o3
132
133
109
93
84
64
63
99
120
103
145
139
148
119
107
98
66
59
61
80
pm10
77
103
69
61
131
81
57
76
49
28
54
42
80
109
99
91
108
79
78
66
so2
9.4
11
12
14
17
16
12
12
13
9.4
11
9.3
14
13
16
21
22
15
13
8.9
* Pollution data source:
https://openaq.org
(ChinaAQIData)
The data is licensed under CC-By 4.0
PM10 7 (Good)
PM2,5 2 (Good)
CO 100 (Good)
NO2 8 (Good)
O3 0 (Good)
SO2 9 (Good)
Data on air pollution from recent days in Dafanhecun
| index | 2022-05-27 |
|---|---|
| pm10 | 32 Moderate |
| pm25 | 24 Moderate |
| co | 468 Good |
| no2 | 21 Good |
| o3 | 32 Good |
| so2 | 5 Good |

| index | 2020-05 | 2020-04 | 2020-03 | 2020-02 | 2020-01 | 2019-12 | 2019-11 | 2019-10 | 2019-09 | 2019-08 | 2019-07 | 2019-06 | 2019-05 | 2019-04 | 2019-03 | 2019-02 | 2019-01 | 2018-12 | 2018-11 | 2018-10 |
|---|---|---|---|---|---|---|---|---|---|---|---|---|---|---|---|---|---|---|---|---|
| pm25 | 25 (Moderate) | 61 (Unhealthy) | 43 (Unhealthy for Sensitive Groups) | 48 (Unhealthy for Sensitive Groups) | 116 (Very bad Hazardous) | 67 (Unhealthy) | 33 (Moderate) | 41 (Unhealthy for Sensitive Groups) | 22 (Moderate) | 15 (Moderate) | 34 (Moderate) | 22 (Moderate) | 32 (Moderate) | 40 (Unhealthy for Sensitive Groups) | 55 (Unhealthy for Sensitive Groups) | 68 (Unhealthy) | 66 (Unhealthy) | 48 (Unhealthy for Sensitive Groups) | 51 (Unhealthy for Sensitive Groups) | 47 (Unhealthy for Sensitive Groups) |
| co | 418 (Good) | 553 (Good) | 629 (Good) | 761 (Good) | 1 (Good) | 888 (Good) | 666 (Good) | 600 (Good) | 656 (Good) | 514 (Good) | 615 (Good) | 559 (Good) | 573 (Good) | 835 (Good) | 968 (Good) | 908 (Good) | 871 (Good) | 783 (Good) | 805 (Good) | 955 (Good) |
| no2 | 19 (Good) | 33 (Good) | 27 (Good) | 26 (Good) | 47 (Moderate) | 39 (Good) | 30 (Good) | 31 (Good) | 26 (Good) | 14 (Good) | 20 (Good) | 28 (Good) | 28 (Good) | 33 (Good) | 35 (Good) | 33 (Good) | 44 (Moderate) | 35 (Good) | 40 (Moderate) | 32 (Good) |
| o3 | 132 (Unhealthy for Sensitive Groups) | 133 (Unhealthy for Sensitive Groups) | 109 (Moderate) | 93 (Moderate) | 84 (Moderate) | 64 (Good) | 63 (Good) | 99 (Moderate) | 120 (Unhealthy for Sensitive Groups) | 103 (Moderate) | 145 (Unhealthy for Sensitive Groups) | 139 (Unhealthy for Sensitive Groups) | 148 (Unhealthy for Sensitive Groups) | 119 (Moderate) | 107 (Moderate) | 98 (Moderate) | 66 (Good) | 59 (Good) | 61 (Good) | 80 (Moderate) |
| pm10 | 77 (Unhealthy for Sensitive Groups) | 103 (Unhealthy) | 69 (Unhealthy for Sensitive Groups) | 61 (Unhealthy for Sensitive Groups) | 131 (Very Unhealthy) | 81 (Unhealthy) | 57 (Unhealthy for Sensitive Groups) | 76 (Unhealthy for Sensitive Groups) | 49 (Moderate) | 28 (Moderate) | 54 (Unhealthy for Sensitive Groups) | 42 (Moderate) | 80 (Unhealthy for Sensitive Groups) | 109 (Unhealthy) | 99 (Unhealthy) | 91 (Unhealthy) | 108 (Unhealthy) | 79 (Unhealthy for Sensitive Groups) | 78 (Unhealthy for Sensitive Groups) | 66 (Unhealthy for Sensitive Groups) |
| so2 | 9.4 (Good) | 11 (Good) | 12 (Good) | 14 (Good) | 17 (Good) | 16 (Good) | 12 (Good) | 12 (Good) | 13 (Good) | 9.4 (Good) | 11 (Good) | 9.3 (Good) | 14 (Good) | 13 (Good) | 16 (Good) | 21 (Good) | 22 (Good) | 15 (Good) | 13 (Good) | 8.9 (Good) |
PM10 6.7 (Good)
particulate matter (PM10) suspended dustPM2,5 1.7 (Good)
particulate matter (PM2.5) dustCO 100 (Good)
carbon monoxide (CO)NO2 7.6 (Good)
nitrogen dioxide (NO2)O3 0.02 (Good)
ozone (O3)SO2 8.6 (Good)
sulfur dioxide (SO2)金沙江路北
| index | 2022-05-27 |
|---|---|
| pm10 | 32 |
| pm25 | 24 |
| co | 468 |
| no2 | 21 |
| o3 | 32 |
| so2 | 4.6 |
金沙江路北
| index | 2020-05 | 2020-04 | 2020-03 | 2020-02 | 2020-01 | 2019-12 | 2019-11 | 2019-10 | 2019-09 | 2019-08 | 2019-07 | 2019-06 | 2019-05 | 2019-04 | 2019-03 | 2019-02 | 2019-01 | 2018-12 | 2018-11 | 2018-10 |
|---|---|---|---|---|---|---|---|---|---|---|---|---|---|---|---|---|---|---|---|---|
| pm25 | 25 | 61 | 43 | 48 | 116 | 67 | 33 | 41 | 22 | 15 | 34 | 22 | 32 | 40 | 55 | 68 | 66 | 48 | 51 | 47 |
| co | 418 | 553 | 629 | 761 | 1 | 888 | 666 | 600 | 656 | 514 | 615 | 559 | 573 | 835 | 968 | 908 | 871 | 783 | 805 | 955 |
| no2 | 19 | 33 | 27 | 26 | 47 | 39 | 30 | 31 | 26 | 14 | 20 | 28 | 28 | 33 | 35 | 33 | 44 | 35 | 40 | 32 |
| o3 | 132 | 133 | 109 | 93 | 84 | 64 | 63 | 99 | 120 | 103 | 145 | 139 | 148 | 119 | 107 | 98 | 66 | 59 | 61 | 80 |
| pm10 | 77 | 103 | 69 | 61 | 131 | 81 | 57 | 76 | 49 | 28 | 54 | 42 | 80 | 109 | 99 | 91 | 108 | 79 | 78 | 66 |
| so2 | 9.4 | 11 | 12 | 14 | 17 | 16 | 12 | 12 | 13 | 9.4 | 11 | 9.3 | 14 | 13 | 16 | 21 | 22 | 15 | 13 | 8.9 |