Air Pollution in Dongyaozi: Real-time Air Quality Index and smog alert.
Pollution and air quality forecast for Dongyaozi. Today is Tuesday, June 2, 2026. The following air pollution values have been recorded for Dongyaozi:- particulate matter (PM10) suspended dust - 179 (Very bad Hazardous)
- particulate matter (PM2.5) dust - 35 (Unhealthy for Sensitive Groups)
- ozone (O3) - 0 (Good)
- nitrogen dioxide (NO2) - 0 (Good)
- sulfur dioxide (SO2) - 0 (Good)

What is the air quality in Dongyaozi today? Is the air polluted in Dongyaozi?. Is there smog?
What is the level of PM10 today in Dongyaozi? (particulate matter (PM10) suspended dust)
The current level of particulate matter PM10 in Dongyaozi is:
179 (Very bad Hazardous)
The highest PM10 values usually occur in month: 169 (January 2019).
The lowest value of particulate matter PM10 pollution in Dongyaozi is usually recorded in: August (52).
What is the current level of PM2.5 in Dongyaozi? (particulate matter (PM2.5) dust)
Today's PM2.5 level is:
35 (Unhealthy for Sensitive Groups)
For comparison, the highest level of PM2.5 in Dongyaozi in the last 7 days was: 56 (Friday, May 27, 2022) and the lowest: 56 (Friday, May 27, 2022).
The highest PM2.5 values were recorded: 115 (January 2020).
The lowest level of particulate matter PM2.5 pollution occurs in month: August (27).
How is the O3 level today in Dongyaozi? (ozone (O3))
0 (Good)
How high is the level of NO2? (nitrogen dioxide (NO2))
0 (Good)
What is the level of SO2 pollution? (sulfur dioxide (SO2))
0 (Good)
Current data Friday, May 27, 2022, 12:00 PM
PM10 179 (Very bad Hazardous)
PM2,5 35 (Unhealthy for Sensitive Groups)
O3 0 (Good)
NO2 0 (Good)
SO2 0 (Good)
Data on air pollution from recent days in Dongyaozi
index
2022-05-27
pm10
56
Unhealthy for Sensitive Groups
pm25
56
Unhealthy
o3
0
Good
no2
0
Good
so2
0
Good
data source »
Air pollution in Dongyaozi from October 2018 to May 2020
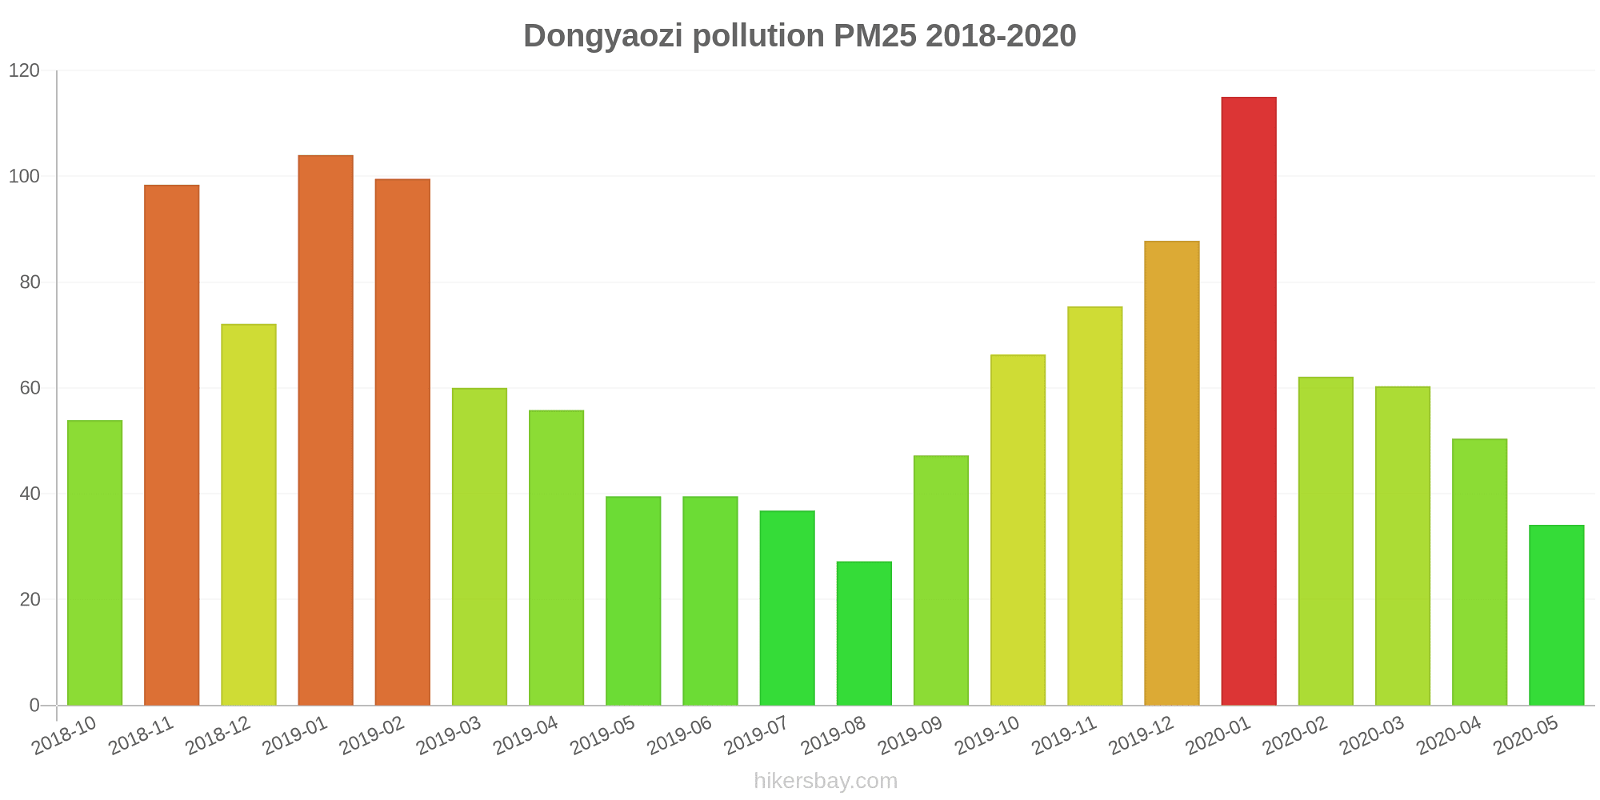
index
2020-05
2020-04
2020-03
2020-02
2020-01
2019-12
2019-11
2019-10
2019-09
2019-08
2019-07
2019-06
2019-05
2019-04
2019-03
2019-02
2019-01
2018-12
2018-11
2018-10
pm25
34 (Moderate)
50 (Unhealthy for Sensitive Groups)
60 (Unhealthy)
62 (Unhealthy)
115 (Very bad Hazardous)
88 (Very Unhealthy)
75 (Very Unhealthy)
66 (Unhealthy)
47 (Unhealthy for Sensitive Groups)
27 (Moderate)
37 (Unhealthy for Sensitive Groups)
40 (Unhealthy for Sensitive Groups)
40 (Unhealthy for Sensitive Groups)
56 (Unhealthy)
60 (Unhealthy)
100 (Very Unhealthy)
104 (Very Unhealthy)
72 (Unhealthy)
98 (Very Unhealthy)
54 (Unhealthy for Sensitive Groups)
co
533 (Good)
627 (Good)
717 (Good)
685 (Good)
1 (Good)
1 (Good)
1 (Good)
876 (Good)
805 (Good)
626 (Good)
638 (Good)
650 (Good)
639 (Good)
687 (Good)
889 (Good)
1 (Good)
1 (Good)
1 (Good)
1 (Good)
922 (Good)
no2
21 (Good)
42 (Moderate)
40 (Good)
25 (Good)
49 (Moderate)
56 (Moderate)
55 (Moderate)
50 (Moderate)
46 (Moderate)
30 (Good)
31 (Good)
31 (Good)
38 (Good)
43 (Moderate)
52 (Moderate)
51 (Moderate)
66 (Moderate)
55 (Moderate)
62 (Moderate)
59 (Moderate)
o3
157 (Unhealthy)
139 (Unhealthy for Sensitive Groups)
120 (Unhealthy for Sensitive Groups)
93 (Moderate)
75 (Moderate)
48 (Good)
76 (Moderate)
124 (Unhealthy for Sensitive Groups)
173 (Unhealthy)
148 (Unhealthy for Sensitive Groups)
211 (Very Unhealthy)
223 (Very Unhealthy)
184 (Very Unhealthy)
150 (Unhealthy)
130 (Unhealthy for Sensitive Groups)
102 (Moderate)
63 (Good)
53 (Good)
93 (Moderate)
108 (Moderate)
pm10
66 (Unhealthy for Sensitive Groups)
98 (Unhealthy)
106 (Unhealthy)
76 (Unhealthy for Sensitive Groups)
140 (Very Unhealthy)
130 (Very Unhealthy)
131 (Very Unhealthy)
114 (Very Unhealthy)
82 (Unhealthy)
52 (Unhealthy for Sensitive Groups)
62 (Unhealthy for Sensitive Groups)
74 (Unhealthy for Sensitive Groups)
91 (Unhealthy)
111 (Very Unhealthy)
119 (Very Unhealthy)
153 (Very bad Hazardous)
169 (Very bad Hazardous)
134 (Very Unhealthy)
160 (Very bad Hazardous)
105 (Unhealthy)
so2
13 (Good)
21 (Good)
20 (Good)
19 (Good)
31 (Good)
22 (Good)
18 (Good)
17 (Good)
16 (Good)
14 (Good)
14 (Good)
17 (Good)
19 (Good)
20 (Good)
28 (Good)
29 (Good)
34 (Good)
25 (Good)
21 (Good)
18 (Good)
data source »
人民公园
Friday, May 27, 2022, 12:00 PM
PM10 179 (Very bad Hazardous)
particulate matter (PM10) suspended dust
PM2,5 35 (Unhealthy for Sensitive Groups)
particulate matter (PM2.5) dust
O3 0.04 (Good)
ozone (O3)
NO2 0 (Good)
nitrogen dioxide (NO2)
SO2 0 (Good)
sulfur dioxide (SO2)
人民公园
index
2022-05-27
pm10
56
pm25
56
o3
0.03
no2
0
so2
0
人民公园
2018-10 2020-05

index
2020-05
2020-04
2020-03
2020-02
2020-01
2019-12
2019-11
2019-10
2019-09
2019-08
2019-07
2019-06
2019-05
2019-04
2019-03
2019-02
2019-01
2018-12
2018-11
2018-10
pm25
34
50
60
62
115
88
75
66
47
27
37
40
40
56
60
100
104
72
98
54
co
533
627
717
685
1
1
1
876
805
626
638
650
639
687
889
1
1
1
1
922
no2
21
42
40
25
49
56
55
50
46
30
31
31
38
43
52
51
66
55
62
59
o3
157
139
120
93
75
48
76
124
173
148
211
223
184
150
130
102
63
53
93
108
pm10
66
98
106
76
140
130
131
114
82
52
62
74
91
111
119
153
169
134
160
105
so2
13
21
20
19
31
22
18
17
16
14
14
17
19
20
28
29
34
25
21
18
* Pollution data source:
https://openaq.org
(ChinaAQIData)
The data is licensed under CC-By 4.0
PM10 179 (Very bad Hazardous)
PM2,5 35 (Unhealthy for Sensitive Groups)
O3 0 (Good)
NO2 0 (Good)
SO2 0 (Good)
Data on air pollution from recent days in Dongyaozi
| index | 2022-05-27 |
|---|---|
| pm10 | 56 Unhealthy for Sensitive Groups |
| pm25 | 56 Unhealthy |
| o3 | 0 Good |
| no2 | 0 Good |
| so2 | 0 Good |

| index | 2020-05 | 2020-04 | 2020-03 | 2020-02 | 2020-01 | 2019-12 | 2019-11 | 2019-10 | 2019-09 | 2019-08 | 2019-07 | 2019-06 | 2019-05 | 2019-04 | 2019-03 | 2019-02 | 2019-01 | 2018-12 | 2018-11 | 2018-10 |
|---|---|---|---|---|---|---|---|---|---|---|---|---|---|---|---|---|---|---|---|---|
| pm25 | 34 (Moderate) | 50 (Unhealthy for Sensitive Groups) | 60 (Unhealthy) | 62 (Unhealthy) | 115 (Very bad Hazardous) | 88 (Very Unhealthy) | 75 (Very Unhealthy) | 66 (Unhealthy) | 47 (Unhealthy for Sensitive Groups) | 27 (Moderate) | 37 (Unhealthy for Sensitive Groups) | 40 (Unhealthy for Sensitive Groups) | 40 (Unhealthy for Sensitive Groups) | 56 (Unhealthy) | 60 (Unhealthy) | 100 (Very Unhealthy) | 104 (Very Unhealthy) | 72 (Unhealthy) | 98 (Very Unhealthy) | 54 (Unhealthy for Sensitive Groups) |
| co | 533 (Good) | 627 (Good) | 717 (Good) | 685 (Good) | 1 (Good) | 1 (Good) | 1 (Good) | 876 (Good) | 805 (Good) | 626 (Good) | 638 (Good) | 650 (Good) | 639 (Good) | 687 (Good) | 889 (Good) | 1 (Good) | 1 (Good) | 1 (Good) | 1 (Good) | 922 (Good) |
| no2 | 21 (Good) | 42 (Moderate) | 40 (Good) | 25 (Good) | 49 (Moderate) | 56 (Moderate) | 55 (Moderate) | 50 (Moderate) | 46 (Moderate) | 30 (Good) | 31 (Good) | 31 (Good) | 38 (Good) | 43 (Moderate) | 52 (Moderate) | 51 (Moderate) | 66 (Moderate) | 55 (Moderate) | 62 (Moderate) | 59 (Moderate) |
| o3 | 157 (Unhealthy) | 139 (Unhealthy for Sensitive Groups) | 120 (Unhealthy for Sensitive Groups) | 93 (Moderate) | 75 (Moderate) | 48 (Good) | 76 (Moderate) | 124 (Unhealthy for Sensitive Groups) | 173 (Unhealthy) | 148 (Unhealthy for Sensitive Groups) | 211 (Very Unhealthy) | 223 (Very Unhealthy) | 184 (Very Unhealthy) | 150 (Unhealthy) | 130 (Unhealthy for Sensitive Groups) | 102 (Moderate) | 63 (Good) | 53 (Good) | 93 (Moderate) | 108 (Moderate) |
| pm10 | 66 (Unhealthy for Sensitive Groups) | 98 (Unhealthy) | 106 (Unhealthy) | 76 (Unhealthy for Sensitive Groups) | 140 (Very Unhealthy) | 130 (Very Unhealthy) | 131 (Very Unhealthy) | 114 (Very Unhealthy) | 82 (Unhealthy) | 52 (Unhealthy for Sensitive Groups) | 62 (Unhealthy for Sensitive Groups) | 74 (Unhealthy for Sensitive Groups) | 91 (Unhealthy) | 111 (Very Unhealthy) | 119 (Very Unhealthy) | 153 (Very bad Hazardous) | 169 (Very bad Hazardous) | 134 (Very Unhealthy) | 160 (Very bad Hazardous) | 105 (Unhealthy) |
| so2 | 13 (Good) | 21 (Good) | 20 (Good) | 19 (Good) | 31 (Good) | 22 (Good) | 18 (Good) | 17 (Good) | 16 (Good) | 14 (Good) | 14 (Good) | 17 (Good) | 19 (Good) | 20 (Good) | 28 (Good) | 29 (Good) | 34 (Good) | 25 (Good) | 21 (Good) | 18 (Good) |
PM10 179 (Very bad Hazardous)
particulate matter (PM10) suspended dustPM2,5 35 (Unhealthy for Sensitive Groups)
particulate matter (PM2.5) dustO3 0.04 (Good)
ozone (O3)NO2 0 (Good)
nitrogen dioxide (NO2)SO2 0 (Good)
sulfur dioxide (SO2)人民公园
| index | 2022-05-27 |
|---|---|
| pm10 | 56 |
| pm25 | 56 |
| o3 | 0.03 |
| no2 | 0 |
| so2 | 0 |
人民公园

| index | 2020-05 | 2020-04 | 2020-03 | 2020-02 | 2020-01 | 2019-12 | 2019-11 | 2019-10 | 2019-09 | 2019-08 | 2019-07 | 2019-06 | 2019-05 | 2019-04 | 2019-03 | 2019-02 | 2019-01 | 2018-12 | 2018-11 | 2018-10 |
|---|---|---|---|---|---|---|---|---|---|---|---|---|---|---|---|---|---|---|---|---|
| pm25 | 34 | 50 | 60 | 62 | 115 | 88 | 75 | 66 | 47 | 27 | 37 | 40 | 40 | 56 | 60 | 100 | 104 | 72 | 98 | 54 |
| co | 533 | 627 | 717 | 685 | 1 | 1 | 1 | 876 | 805 | 626 | 638 | 650 | 639 | 687 | 889 | 1 | 1 | 1 | 1 | 922 |
| no2 | 21 | 42 | 40 | 25 | 49 | 56 | 55 | 50 | 46 | 30 | 31 | 31 | 38 | 43 | 52 | 51 | 66 | 55 | 62 | 59 |
| o3 | 157 | 139 | 120 | 93 | 75 | 48 | 76 | 124 | 173 | 148 | 211 | 223 | 184 | 150 | 130 | 102 | 63 | 53 | 93 | 108 |
| pm10 | 66 | 98 | 106 | 76 | 140 | 130 | 131 | 114 | 82 | 52 | 62 | 74 | 91 | 111 | 119 | 153 | 169 | 134 | 160 | 105 |
| so2 | 13 | 21 | 20 | 19 | 31 | 22 | 18 | 17 | 16 | 14 | 14 | 17 | 19 | 20 | 28 | 29 | 34 | 25 | 21 | 18 |