Air Pollution in Huludao: Real-time Air Quality Index and smog alert.
Pollution and air quality forecast for Huludao. Today is Tuesday, June 16, 2026. The following air pollution values have been recorded for Huludao:- particulate matter (PM10) suspended dust - 7 (Good)
- particulate matter (PM2.5) dust - 2 (Good)
- carbon monoxide (CO) - 100 (Good)
- nitrogen dioxide (NO2) - 8 (Good)
- ozone (O3) - 0 (Good)
- sulfur dioxide (SO2) - 9 (Good)

What is the air quality in Huludao today? Is the air polluted in Huludao?. Is there smog?
What is the level of PM10 today in Huludao? (particulate matter (PM10) suspended dust)
The current level of particulate matter PM10 in Huludao is:
7 (Good)
The highest PM10 values usually occur in month: 135 (January 2020).
The lowest value of particulate matter PM10 pollution in Huludao is usually recorded in: August (33).
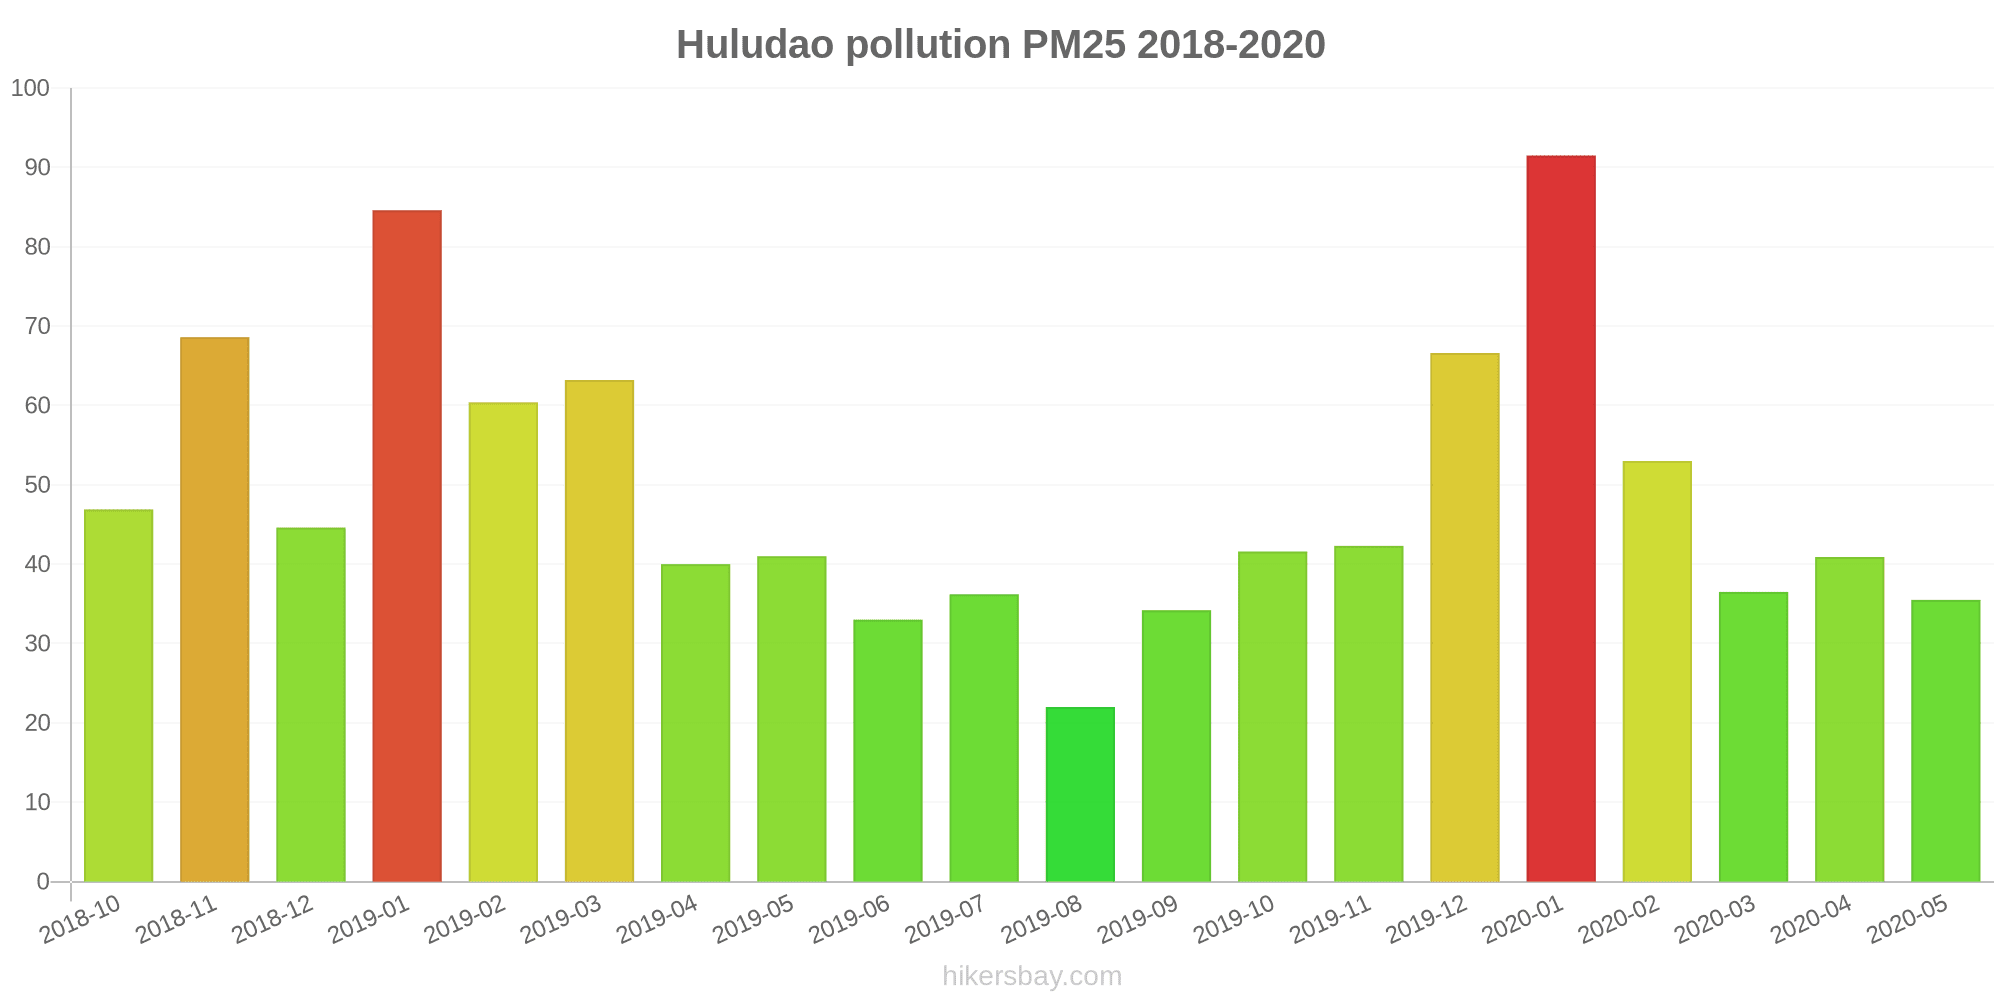
What is the current level of PM2.5 in Huludao? (particulate matter (PM2.5) dust)
Today's PM2.5 level is:
2 (Good)
For comparison, the highest level of PM2.5 in Huludao in the last 7 days was: 24 (Friday, May 27, 2022) and the lowest: 24 (Friday, May 27, 2022).
The highest PM2.5 values were recorded: 92 (January 2020).
The lowest level of particulate matter PM2.5 pollution occurs in month: August (22).
How high is the CO level? (carbon monoxide (CO))
100 (Good)
How high is the level of NO2? (nitrogen dioxide (NO2))
8 (Good)
How is the O3 level today in Huludao? (ozone (O3))
0 (Good)
What is the level of SO2 pollution? (sulfur dioxide (SO2))
9 (Good)
Current data Friday, May 27, 2022, 12:00 PM
PM10 7 (Good)
PM2,5 2 (Good)
CO 100 (Good)
NO2 8 (Good)
O3 0 (Good)
SO2 9 (Good)
Data on air pollution from recent days in Huludao
index
2022-05-27
pm10
32
Moderate
pm25
24
Moderate
co
468
Good
no2
21
Good
o3
32
Good
so2
5
Good
data source »
Air pollution in Huludao from October 2018 to May 2020

index
2020-05
2020-04
2020-03
2020-02
2020-01
2019-12
2019-11
2019-10
2019-09
2019-08
2019-07
2019-06
2019-05
2019-04
2019-03
2019-02
2019-01
2018-12
2018-11
2018-10
pm25
36 (Unhealthy for Sensitive Groups)
41 (Unhealthy for Sensitive Groups)
37 (Unhealthy for Sensitive Groups)
53 (Unhealthy for Sensitive Groups)
92 (Very Unhealthy)
67 (Unhealthy)
42 (Unhealthy for Sensitive Groups)
42 (Unhealthy for Sensitive Groups)
34 (Moderate)
22 (Moderate)
36 (Unhealthy for Sensitive Groups)
33 (Moderate)
41 (Unhealthy for Sensitive Groups)
40 (Unhealthy for Sensitive Groups)
63 (Unhealthy)
60 (Unhealthy)
85 (Very Unhealthy)
45 (Unhealthy for Sensitive Groups)
69 (Unhealthy)
47 (Unhealthy for Sensitive Groups)
co
459 (Good)
734 (Good)
783 (Good)
1 (Good)
1 (Good)
1 (Good)
1 (Good)
1 (Good)
1 (Good)
841 (Good)
999 (Good)
840 (Good)
800 (Good)
908 (Good)
1 (Good)
1 (Good)
1 (Good)
1 (Good)
1 (Good)
1 (Good)
no2
28 (Good)
33 (Good)
28 (Good)
23 (Good)
43 (Moderate)
45 (Moderate)
36 (Good)
40 (Moderate)
31 (Good)
22 (Good)
22 (Good)
23 (Good)
28 (Good)
33 (Good)
43 (Moderate)
37 (Good)
52 (Moderate)
38 (Good)
44 (Moderate)
41 (Moderate)
o3
143 (Unhealthy for Sensitive Groups)
131 (Unhealthy for Sensitive Groups)
96 (Moderate)
77 (Moderate)
65 (Good)
50 (Good)
56 (Good)
87 (Moderate)
139 (Unhealthy for Sensitive Groups)
109 (Moderate)
153 (Unhealthy)
142 (Unhealthy for Sensitive Groups)
152 (Unhealthy)
122 (Unhealthy for Sensitive Groups)
99 (Moderate)
77 (Moderate)
56 (Good)
55 (Good)
62 (Good)
87 (Moderate)
pm10
60 (Unhealthy for Sensitive Groups)
81 (Unhealthy)
68 (Unhealthy for Sensitive Groups)
75 (Unhealthy for Sensitive Groups)
135 (Very Unhealthy)
115 (Very Unhealthy)
93 (Unhealthy)
87 (Unhealthy)
60 (Unhealthy for Sensitive Groups)
33 (Moderate)
46 (Moderate)
50 (Moderate)
77 (Unhealthy for Sensitive Groups)
101 (Unhealthy)
107 (Unhealthy)
92 (Unhealthy)
122 (Very Unhealthy)
75 (Unhealthy for Sensitive Groups)
115 (Very Unhealthy)
82 (Unhealthy)
so2
16 (Good)
13 (Good)
13 (Good)
24 (Good)
44 (Good)
26 (Good)
22 (Good)
17 (Good)
18 (Good)
11 (Good)
8.3 (Good)
9.2 (Good)
10 (Good)
15 (Good)
26 (Good)
35 (Good)
52 (Moderate)
35 (Good)
36 (Good)
16 (Good)
data source »
化工街
Friday, May 27, 2022, 12:00 PM
PM10 6.7 (Good)
particulate matter (PM10) suspended dust
PM2,5 1.7 (Good)
particulate matter (PM2.5) dust
CO 100 (Good)
carbon monoxide (CO)
NO2 7.6 (Good)
nitrogen dioxide (NO2)
O3 0.02 (Good)
ozone (O3)
SO2 8.6 (Good)
sulfur dioxide (SO2)
化工街
index
2022-05-27
pm10
32
pm25
24
co
468
no2
21
o3
32
so2
4.6
化工街
2018-10 2020-05

index
2020-05
2020-04
2020-03
2020-02
2020-01
2019-12
2019-11
2019-10
2019-09
2019-08
2019-07
2019-06
2019-05
2019-04
2019-03
2019-02
2019-01
2018-12
2018-11
2018-10
pm25
36
41
37
53
92
67
42
42
34
22
36
33
41
40
63
60
85
45
69
47
co
459
734
783
1
1
1
1
1
1
841
999
840
800
908
1
1
1
1
1
1
no2
28
33
28
23
43
45
36
40
31
22
22
23
28
33
43
37
52
38
44
41
o3
143
131
96
77
65
50
56
87
139
109
153
142
152
122
99
77
56
55
62
87
pm10
60
81
68
75
135
115
93
87
60
33
46
50
77
101
107
92
122
75
115
82
so2
16
13
13
24
44
26
22
17
18
11
8.3
9.2
10
15
26
35
52
35
36
16
* Pollution data source:
https://openaq.org
(ChinaAQIData)
The data is licensed under CC-By 4.0
PM10 7 (Good)
PM2,5 2 (Good)
CO 100 (Good)
NO2 8 (Good)
O3 0 (Good)
SO2 9 (Good)
Data on air pollution from recent days in Huludao
| index | 2022-05-27 |
|---|---|
| pm10 | 32 Moderate |
| pm25 | 24 Moderate |
| co | 468 Good |
| no2 | 21 Good |
| o3 | 32 Good |
| so2 | 5 Good |
| index | 2020-05 | 2020-04 | 2020-03 | 2020-02 | 2020-01 | 2019-12 | 2019-11 | 2019-10 | 2019-09 | 2019-08 | 2019-07 | 2019-06 | 2019-05 | 2019-04 | 2019-03 | 2019-02 | 2019-01 | 2018-12 | 2018-11 | 2018-10 |
|---|---|---|---|---|---|---|---|---|---|---|---|---|---|---|---|---|---|---|---|---|
| pm25 | 36 (Unhealthy for Sensitive Groups) | 41 (Unhealthy for Sensitive Groups) | 37 (Unhealthy for Sensitive Groups) | 53 (Unhealthy for Sensitive Groups) | 92 (Very Unhealthy) | 67 (Unhealthy) | 42 (Unhealthy for Sensitive Groups) | 42 (Unhealthy for Sensitive Groups) | 34 (Moderate) | 22 (Moderate) | 36 (Unhealthy for Sensitive Groups) | 33 (Moderate) | 41 (Unhealthy for Sensitive Groups) | 40 (Unhealthy for Sensitive Groups) | 63 (Unhealthy) | 60 (Unhealthy) | 85 (Very Unhealthy) | 45 (Unhealthy for Sensitive Groups) | 69 (Unhealthy) | 47 (Unhealthy for Sensitive Groups) |
| co | 459 (Good) | 734 (Good) | 783 (Good) | 1 (Good) | 1 (Good) | 1 (Good) | 1 (Good) | 1 (Good) | 1 (Good) | 841 (Good) | 999 (Good) | 840 (Good) | 800 (Good) | 908 (Good) | 1 (Good) | 1 (Good) | 1 (Good) | 1 (Good) | 1 (Good) | 1 (Good) |
| no2 | 28 (Good) | 33 (Good) | 28 (Good) | 23 (Good) | 43 (Moderate) | 45 (Moderate) | 36 (Good) | 40 (Moderate) | 31 (Good) | 22 (Good) | 22 (Good) | 23 (Good) | 28 (Good) | 33 (Good) | 43 (Moderate) | 37 (Good) | 52 (Moderate) | 38 (Good) | 44 (Moderate) | 41 (Moderate) |
| o3 | 143 (Unhealthy for Sensitive Groups) | 131 (Unhealthy for Sensitive Groups) | 96 (Moderate) | 77 (Moderate) | 65 (Good) | 50 (Good) | 56 (Good) | 87 (Moderate) | 139 (Unhealthy for Sensitive Groups) | 109 (Moderate) | 153 (Unhealthy) | 142 (Unhealthy for Sensitive Groups) | 152 (Unhealthy) | 122 (Unhealthy for Sensitive Groups) | 99 (Moderate) | 77 (Moderate) | 56 (Good) | 55 (Good) | 62 (Good) | 87 (Moderate) |
| pm10 | 60 (Unhealthy for Sensitive Groups) | 81 (Unhealthy) | 68 (Unhealthy for Sensitive Groups) | 75 (Unhealthy for Sensitive Groups) | 135 (Very Unhealthy) | 115 (Very Unhealthy) | 93 (Unhealthy) | 87 (Unhealthy) | 60 (Unhealthy for Sensitive Groups) | 33 (Moderate) | 46 (Moderate) | 50 (Moderate) | 77 (Unhealthy for Sensitive Groups) | 101 (Unhealthy) | 107 (Unhealthy) | 92 (Unhealthy) | 122 (Very Unhealthy) | 75 (Unhealthy for Sensitive Groups) | 115 (Very Unhealthy) | 82 (Unhealthy) |
| so2 | 16 (Good) | 13 (Good) | 13 (Good) | 24 (Good) | 44 (Good) | 26 (Good) | 22 (Good) | 17 (Good) | 18 (Good) | 11 (Good) | 8.3 (Good) | 9.2 (Good) | 10 (Good) | 15 (Good) | 26 (Good) | 35 (Good) | 52 (Moderate) | 35 (Good) | 36 (Good) | 16 (Good) |
PM10 6.7 (Good)
particulate matter (PM10) suspended dustPM2,5 1.7 (Good)
particulate matter (PM2.5) dustCO 100 (Good)
carbon monoxide (CO)NO2 7.6 (Good)
nitrogen dioxide (NO2)O3 0.02 (Good)
ozone (O3)SO2 8.6 (Good)
sulfur dioxide (SO2)化工街
| index | 2022-05-27 |
|---|---|
| pm10 | 32 |
| pm25 | 24 |
| co | 468 |
| no2 | 21 |
| o3 | 32 |
| so2 | 4.6 |
化工街

| index | 2020-05 | 2020-04 | 2020-03 | 2020-02 | 2020-01 | 2019-12 | 2019-11 | 2019-10 | 2019-09 | 2019-08 | 2019-07 | 2019-06 | 2019-05 | 2019-04 | 2019-03 | 2019-02 | 2019-01 | 2018-12 | 2018-11 | 2018-10 |
|---|---|---|---|---|---|---|---|---|---|---|---|---|---|---|---|---|---|---|---|---|
| pm25 | 36 | 41 | 37 | 53 | 92 | 67 | 42 | 42 | 34 | 22 | 36 | 33 | 41 | 40 | 63 | 60 | 85 | 45 | 69 | 47 |
| co | 459 | 734 | 783 | 1 | 1 | 1 | 1 | 1 | 1 | 841 | 999 | 840 | 800 | 908 | 1 | 1 | 1 | 1 | 1 | 1 |
| no2 | 28 | 33 | 28 | 23 | 43 | 45 | 36 | 40 | 31 | 22 | 22 | 23 | 28 | 33 | 43 | 37 | 52 | 38 | 44 | 41 |
| o3 | 143 | 131 | 96 | 77 | 65 | 50 | 56 | 87 | 139 | 109 | 153 | 142 | 152 | 122 | 99 | 77 | 56 | 55 | 62 | 87 |
| pm10 | 60 | 81 | 68 | 75 | 135 | 115 | 93 | 87 | 60 | 33 | 46 | 50 | 77 | 101 | 107 | 92 | 122 | 75 | 115 | 82 |
| so2 | 16 | 13 | 13 | 24 | 44 | 26 | 22 | 17 | 18 | 11 | 8.3 | 9.2 | 10 | 15 | 26 | 35 | 52 | 35 | 36 | 16 |