Air Pollution in Liaobin: Real-time Air Quality Index and smog alert.
Pollution and air quality forecast for Liaobin. Today is Tuesday, June 16, 2026. The following air pollution values have been recorded for Liaobin:- particulate matter (PM10) suspended dust - 7 (Good)
- particulate matter (PM2.5) dust - 2 (Good)
- carbon monoxide (CO) - 100 (Good)
- nitrogen dioxide (NO2) - 8 (Good)
- ozone (O3) - 0 (Good)
- sulfur dioxide (SO2) - 9 (Good)

What is the air quality in Liaobin today? Is the air polluted in Liaobin?. Is there smog?
What is the level of PM10 today in Liaobin? (particulate matter (PM10) suspended dust)
The current level of particulate matter PM10 in Liaobin is:
7 (Good)
The highest PM10 values usually occur in month: 120 (January 2020).
The lowest value of particulate matter PM10 pollution in Liaobin is usually recorded in: August (24).
What is the current level of PM2.5 in Liaobin? (particulate matter (PM2.5) dust)
Today's PM2.5 level is:
2 (Good)
For comparison, the highest level of PM2.5 in Liaobin in the last 7 days was: 24 (Friday, May 27, 2022) and the lowest: 24 (Friday, May 27, 2022).
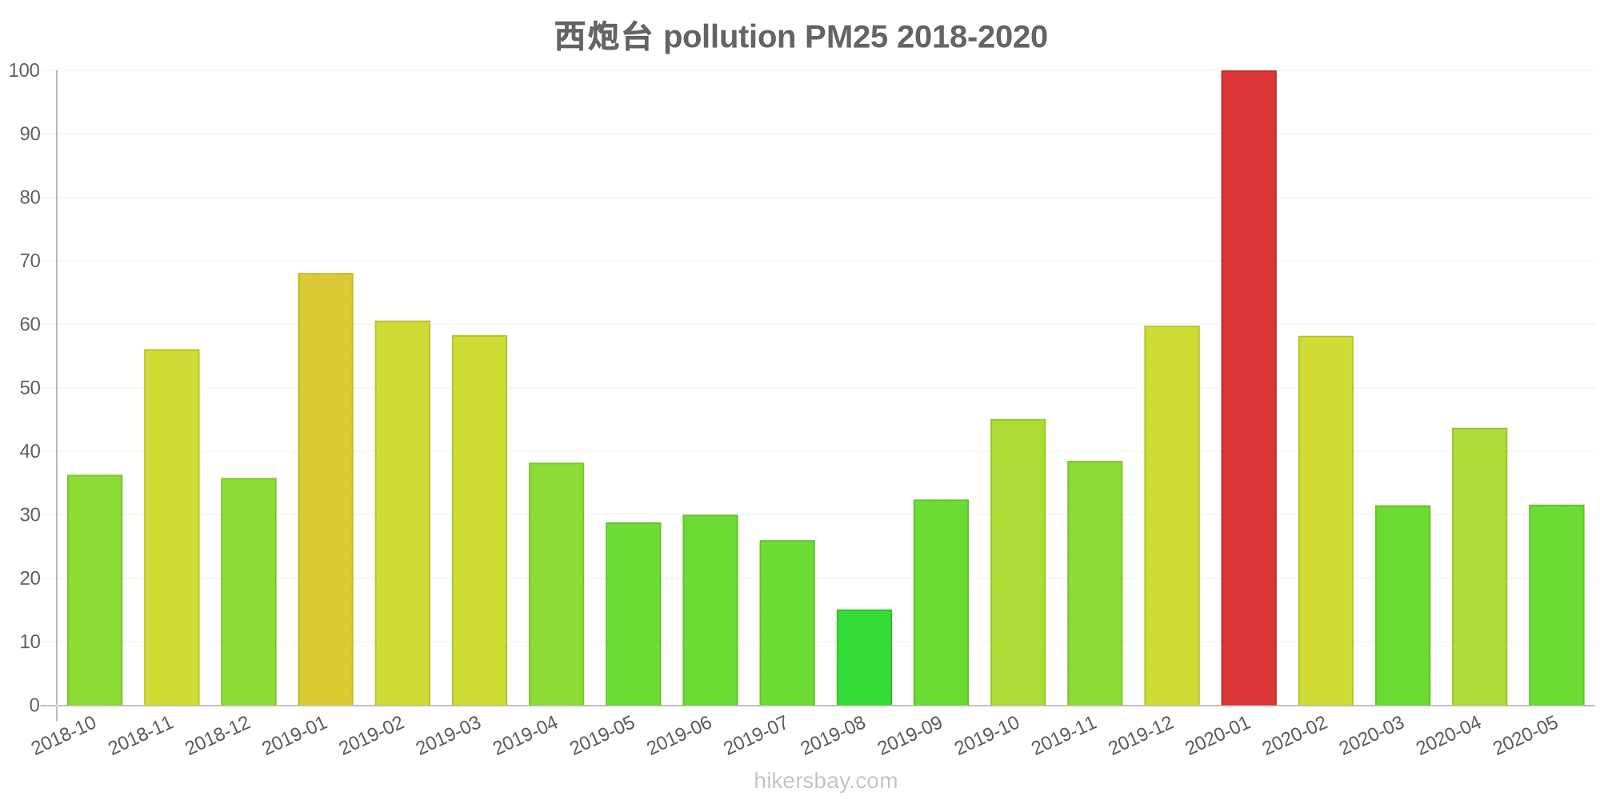
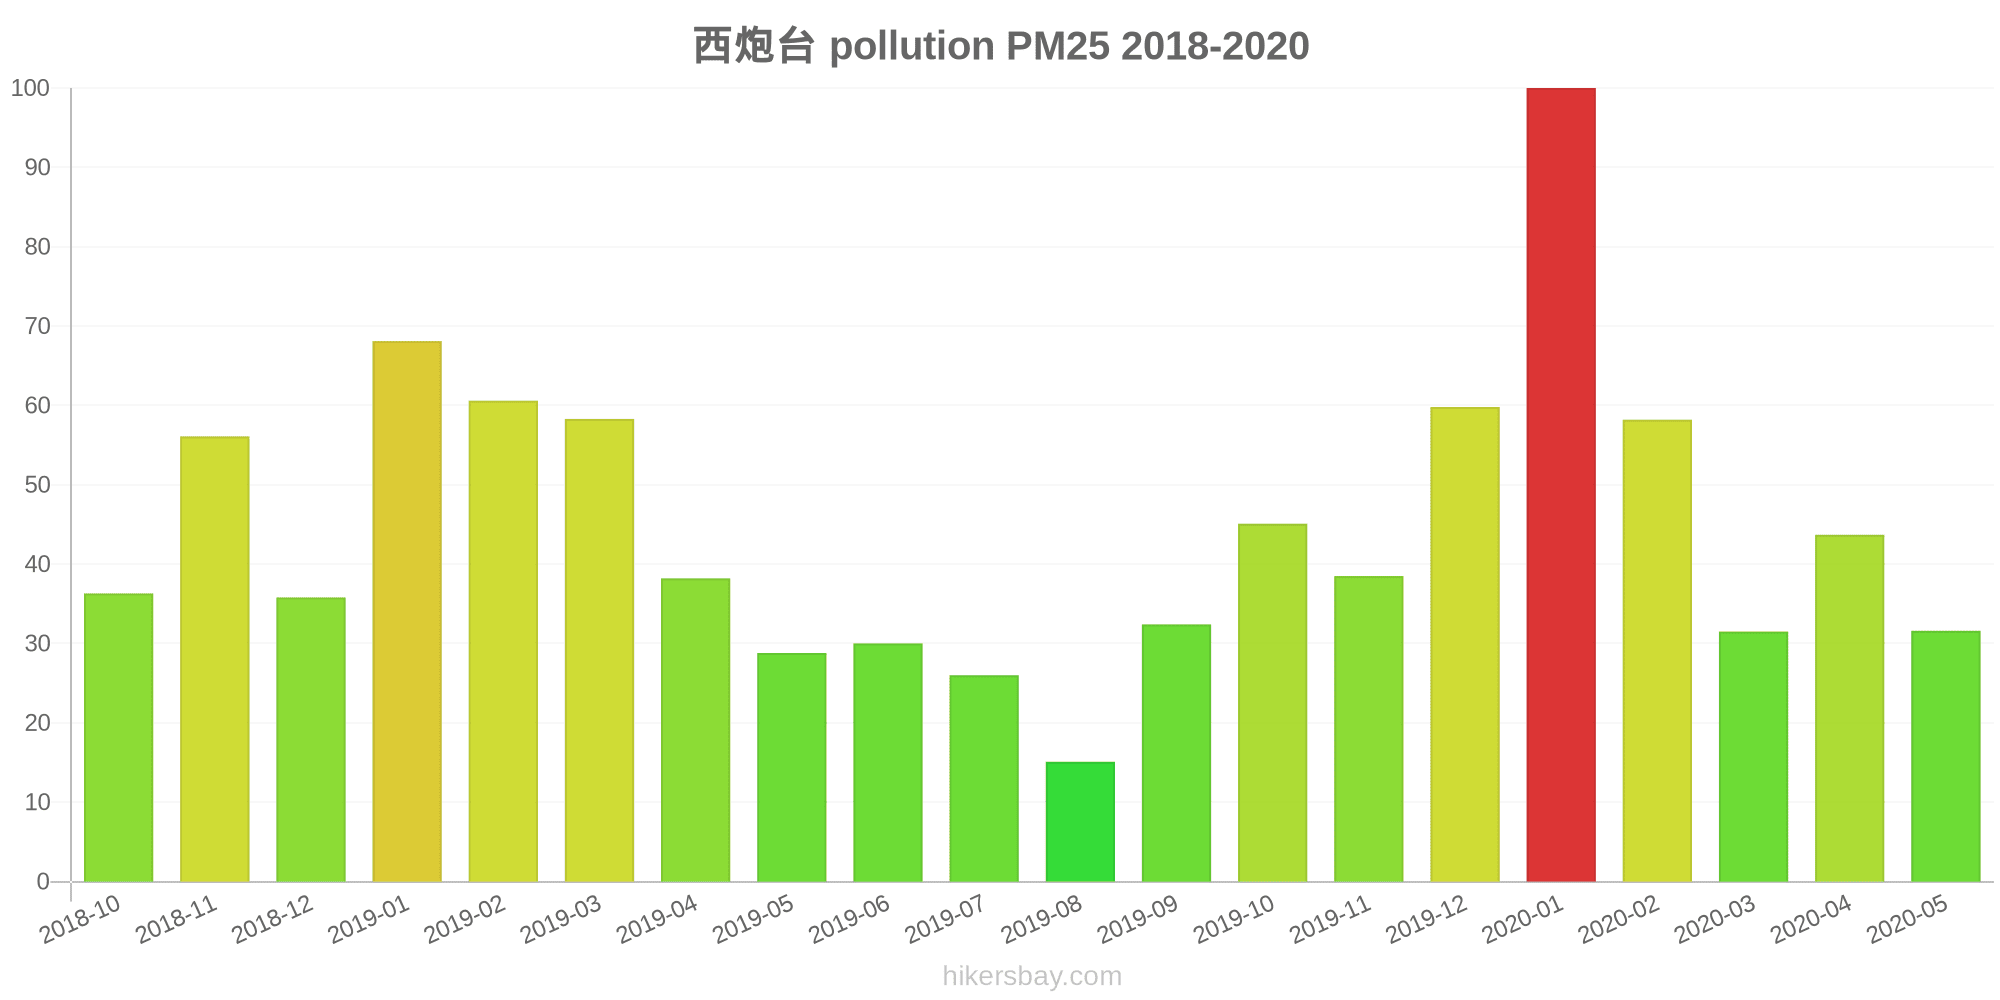
The highest PM2.5 values were recorded: 100 (January 2020).
The lowest level of particulate matter PM2.5 pollution occurs in month: August (15).
How high is the CO level? (carbon monoxide (CO))
100 (Good)
How high is the level of NO2? (nitrogen dioxide (NO2))
8 (Good)
How is the O3 level today in Liaobin? (ozone (O3))
0 (Good)
What is the level of SO2 pollution? (sulfur dioxide (SO2))
9 (Good)
Current data Friday, May 27, 2022, 12:00 PM
PM10 7 (Good)
PM2,5 2 (Good)
CO 100 (Good)
NO2 8 (Good)
O3 0 (Good)
SO2 9 (Good)
Data on air pollution from recent days in Liaobin
index
2022-05-27
pm10
32
Moderate
pm25
24
Moderate
co
468
Good
no2
21
Good
o3
32
Good
so2
5
Good
data source »
Air pollution in Liaobin from October 2018 to May 2020

index
2020-05
2020-04
2020-03
2020-02
2020-01
2019-12
2019-11
2019-10
2019-09
2019-08
2019-07
2019-06
2019-05
2019-04
2019-03
2019-02
2019-01
2018-12
2018-11
2018-10
pm25
32 (Moderate)
44 (Unhealthy for Sensitive Groups)
32 (Moderate)
58 (Unhealthy)
100 (Very Unhealthy)
60 (Unhealthy)
39 (Unhealthy for Sensitive Groups)
45 (Unhealthy for Sensitive Groups)
32 (Moderate)
15 (Moderate)
26 (Moderate)
30 (Moderate)
29 (Moderate)
38 (Unhealthy for Sensitive Groups)
58 (Unhealthy)
61 (Unhealthy)
68 (Unhealthy)
36 (Unhealthy for Sensitive Groups)
56 (Unhealthy)
36 (Unhealthy for Sensitive Groups)
co
630 (Good)
617 (Good)
613 (Good)
870 (Good)
1 (Good)
1 (Good)
847 (Good)
769 (Good)
887 (Good)
622 (Good)
633 (Good)
450 (Good)
469 (Good)
591 (Good)
649 (Good)
807 (Good)
861 (Good)
549 (Good)
826 (Good)
588 (Good)
no2
24 (Good)
27 (Good)
26 (Good)
26 (Good)
44 (Moderate)
37 (Good)
33 (Good)
32 (Good)
26 (Good)
17 (Good)
14 (Good)
19 (Good)
20 (Good)
23 (Good)
29 (Good)
31 (Good)
35 (Good)
31 (Good)
39 (Good)
30 (Good)
o3
141 (Unhealthy for Sensitive Groups)
136 (Unhealthy for Sensitive Groups)
104 (Moderate)
84 (Moderate)
70 (Good)
62 (Good)
65 (Good)
104 (Moderate)
142 (Unhealthy for Sensitive Groups)
123 (Unhealthy for Sensitive Groups)
171 (Unhealthy)
157 (Unhealthy)
173 (Unhealthy)
140 (Unhealthy for Sensitive Groups)
112 (Moderate)
86 (Moderate)
76 (Moderate)
68 (Good)
85 (Moderate)
106 (Moderate)
pm10
56 (Unhealthy for Sensitive Groups)
82 (Unhealthy)
58 (Unhealthy for Sensitive Groups)
85 (Unhealthy)
120 (Very Unhealthy)
79 (Unhealthy for Sensitive Groups)
65 (Unhealthy for Sensitive Groups)
81 (Unhealthy)
61 (Unhealthy for Sensitive Groups)
24 (Moderate)
37 (Moderate)
43 (Moderate)
64 (Unhealthy for Sensitive Groups)
68 (Unhealthy for Sensitive Groups)
88 (Unhealthy)
84 (Unhealthy)
98 (Unhealthy)
58 (Unhealthy for Sensitive Groups)
80 (Unhealthy)
58 (Unhealthy for Sensitive Groups)
so2
5.9 (Good)
9.7 (Good)
8.2 (Good)
8.8 (Good)
16 (Good)
12 (Good)
12 (Good)
6.7 (Good)
6.8 (Good)
6.1 (Good)
3.5 (Good)
4.9 (Good)
6.2 (Good)
7.3 (Good)
9.6 (Good)
15 (Good)
14 (Good)
12 (Good)
11 (Good)
6.6 (Good)
data source »
西炮台
Friday, May 27, 2022, 12:00 PM
PM10 6.7 (Good)
particulate matter (PM10) suspended dust
PM2,5 1.7 (Good)
particulate matter (PM2.5) dust
CO 100 (Good)
carbon monoxide (CO)
NO2 7.6 (Good)
nitrogen dioxide (NO2)
O3 0.02 (Good)
ozone (O3)
SO2 8.6 (Good)
sulfur dioxide (SO2)
西炮台
index
2022-05-27
pm10
32
pm25
24
co
468
no2
21
o3
32
so2
4.6
西炮台
2018-10 2020-05
index
2020-05
2020-04
2020-03
2020-02
2020-01
2019-12
2019-11
2019-10
2019-09
2019-08
2019-07
2019-06
2019-05
2019-04
2019-03
2019-02
2019-01
2018-12
2018-11
2018-10
pm25
32
44
32
58
100
60
39
45
32
15
26
30
29
38
58
61
68
36
56
36
co
630
617
613
870
1
1
847
769
887
622
633
450
469
591
649
807
861
549
826
588
no2
24
27
26
26
44
37
33
32
26
17
14
19
20
23
29
31
35
31
39
30
o3
141
136
104
84
70
62
65
104
142
123
171
157
173
140
112
86
76
68
85
106
pm10
56
82
58
85
120
79
65
81
61
24
37
43
64
68
88
84
98
58
80
58
so2
5.9
9.7
8.2
8.8
16
12
12
6.7
6.8
6.1
3.5
4.9
6.2
7.3
9.6
15
14
12
11
6.6
* Pollution data source:
https://openaq.org
(ChinaAQIData)
The data is licensed under CC-By 4.0
PM10 7 (Good)
PM2,5 2 (Good)
CO 100 (Good)
NO2 8 (Good)
O3 0 (Good)
SO2 9 (Good)
Data on air pollution from recent days in Liaobin
| index | 2022-05-27 |
|---|---|
| pm10 | 32 Moderate |
| pm25 | 24 Moderate |
| co | 468 Good |
| no2 | 21 Good |
| o3 | 32 Good |
| so2 | 5 Good |

| index | 2020-05 | 2020-04 | 2020-03 | 2020-02 | 2020-01 | 2019-12 | 2019-11 | 2019-10 | 2019-09 | 2019-08 | 2019-07 | 2019-06 | 2019-05 | 2019-04 | 2019-03 | 2019-02 | 2019-01 | 2018-12 | 2018-11 | 2018-10 |
|---|---|---|---|---|---|---|---|---|---|---|---|---|---|---|---|---|---|---|---|---|
| pm25 | 32 (Moderate) | 44 (Unhealthy for Sensitive Groups) | 32 (Moderate) | 58 (Unhealthy) | 100 (Very Unhealthy) | 60 (Unhealthy) | 39 (Unhealthy for Sensitive Groups) | 45 (Unhealthy for Sensitive Groups) | 32 (Moderate) | 15 (Moderate) | 26 (Moderate) | 30 (Moderate) | 29 (Moderate) | 38 (Unhealthy for Sensitive Groups) | 58 (Unhealthy) | 61 (Unhealthy) | 68 (Unhealthy) | 36 (Unhealthy for Sensitive Groups) | 56 (Unhealthy) | 36 (Unhealthy for Sensitive Groups) |
| co | 630 (Good) | 617 (Good) | 613 (Good) | 870 (Good) | 1 (Good) | 1 (Good) | 847 (Good) | 769 (Good) | 887 (Good) | 622 (Good) | 633 (Good) | 450 (Good) | 469 (Good) | 591 (Good) | 649 (Good) | 807 (Good) | 861 (Good) | 549 (Good) | 826 (Good) | 588 (Good) |
| no2 | 24 (Good) | 27 (Good) | 26 (Good) | 26 (Good) | 44 (Moderate) | 37 (Good) | 33 (Good) | 32 (Good) | 26 (Good) | 17 (Good) | 14 (Good) | 19 (Good) | 20 (Good) | 23 (Good) | 29 (Good) | 31 (Good) | 35 (Good) | 31 (Good) | 39 (Good) | 30 (Good) |
| o3 | 141 (Unhealthy for Sensitive Groups) | 136 (Unhealthy for Sensitive Groups) | 104 (Moderate) | 84 (Moderate) | 70 (Good) | 62 (Good) | 65 (Good) | 104 (Moderate) | 142 (Unhealthy for Sensitive Groups) | 123 (Unhealthy for Sensitive Groups) | 171 (Unhealthy) | 157 (Unhealthy) | 173 (Unhealthy) | 140 (Unhealthy for Sensitive Groups) | 112 (Moderate) | 86 (Moderate) | 76 (Moderate) | 68 (Good) | 85 (Moderate) | 106 (Moderate) |
| pm10 | 56 (Unhealthy for Sensitive Groups) | 82 (Unhealthy) | 58 (Unhealthy for Sensitive Groups) | 85 (Unhealthy) | 120 (Very Unhealthy) | 79 (Unhealthy for Sensitive Groups) | 65 (Unhealthy for Sensitive Groups) | 81 (Unhealthy) | 61 (Unhealthy for Sensitive Groups) | 24 (Moderate) | 37 (Moderate) | 43 (Moderate) | 64 (Unhealthy for Sensitive Groups) | 68 (Unhealthy for Sensitive Groups) | 88 (Unhealthy) | 84 (Unhealthy) | 98 (Unhealthy) | 58 (Unhealthy for Sensitive Groups) | 80 (Unhealthy) | 58 (Unhealthy for Sensitive Groups) |
| so2 | 5.9 (Good) | 9.7 (Good) | 8.2 (Good) | 8.8 (Good) | 16 (Good) | 12 (Good) | 12 (Good) | 6.7 (Good) | 6.8 (Good) | 6.1 (Good) | 3.5 (Good) | 4.9 (Good) | 6.2 (Good) | 7.3 (Good) | 9.6 (Good) | 15 (Good) | 14 (Good) | 12 (Good) | 11 (Good) | 6.6 (Good) |
PM10 6.7 (Good)
particulate matter (PM10) suspended dustPM2,5 1.7 (Good)
particulate matter (PM2.5) dustCO 100 (Good)
carbon monoxide (CO)NO2 7.6 (Good)
nitrogen dioxide (NO2)O3 0.02 (Good)
ozone (O3)SO2 8.6 (Good)
sulfur dioxide (SO2)西炮台
| index | 2022-05-27 |
|---|---|
| pm10 | 32 |
| pm25 | 24 |
| co | 468 |
| no2 | 21 |
| o3 | 32 |
| so2 | 4.6 |
西炮台
| index | 2020-05 | 2020-04 | 2020-03 | 2020-02 | 2020-01 | 2019-12 | 2019-11 | 2019-10 | 2019-09 | 2019-08 | 2019-07 | 2019-06 | 2019-05 | 2019-04 | 2019-03 | 2019-02 | 2019-01 | 2018-12 | 2018-11 | 2018-10 |
|---|---|---|---|---|---|---|---|---|---|---|---|---|---|---|---|---|---|---|---|---|
| pm25 | 32 | 44 | 32 | 58 | 100 | 60 | 39 | 45 | 32 | 15 | 26 | 30 | 29 | 38 | 58 | 61 | 68 | 36 | 56 | 36 |
| co | 630 | 617 | 613 | 870 | 1 | 1 | 847 | 769 | 887 | 622 | 633 | 450 | 469 | 591 | 649 | 807 | 861 | 549 | 826 | 588 |
| no2 | 24 | 27 | 26 | 26 | 44 | 37 | 33 | 32 | 26 | 17 | 14 | 19 | 20 | 23 | 29 | 31 | 35 | 31 | 39 | 30 |
| o3 | 141 | 136 | 104 | 84 | 70 | 62 | 65 | 104 | 142 | 123 | 171 | 157 | 173 | 140 | 112 | 86 | 76 | 68 | 85 | 106 |
| pm10 | 56 | 82 | 58 | 85 | 120 | 79 | 65 | 81 | 61 | 24 | 37 | 43 | 64 | 68 | 88 | 84 | 98 | 58 | 80 | 58 |
| so2 | 5.9 | 9.7 | 8.2 | 8.8 | 16 | 12 | 12 | 6.7 | 6.8 | 6.1 | 3.5 | 4.9 | 6.2 | 7.3 | 9.6 | 15 | 14 | 12 | 11 | 6.6 |