Air Pollution in Liaoyang: Real-time Air Quality Index and smog alert.
Pollution and air quality forecast for Liaoyang. Today is Tuesday, June 16, 2026. The following air pollution values have been recorded for Liaoyang:- particulate matter (PM10) suspended dust - 7 (Good)
- particulate matter (PM2.5) dust - 2 (Good)
- carbon monoxide (CO) - 100 (Good)
- nitrogen dioxide (NO2) - 8 (Good)
- ozone (O3) - 0 (Good)
- sulfur dioxide (SO2) - 9 (Good)

What is the air quality in Liaoyang today? Is the air polluted in Liaoyang?. Is there smog?
What is the level of PM10 today in Liaoyang? (particulate matter (PM10) suspended dust)
The current level of particulate matter PM10 in Liaoyang is:
7 (Good)
The highest PM10 values usually occur in month: 122 (January 2020).
The lowest value of particulate matter PM10 pollution in Liaoyang is usually recorded in: August (35).
What is the current level of PM2.5 in Liaoyang? (particulate matter (PM2.5) dust)
Today's PM2.5 level is:
2 (Good)
For comparison, the highest level of PM2.5 in Liaoyang in the last 7 days was: 24 (Friday, May 27, 2022) and the lowest: 24 (Friday, May 27, 2022).
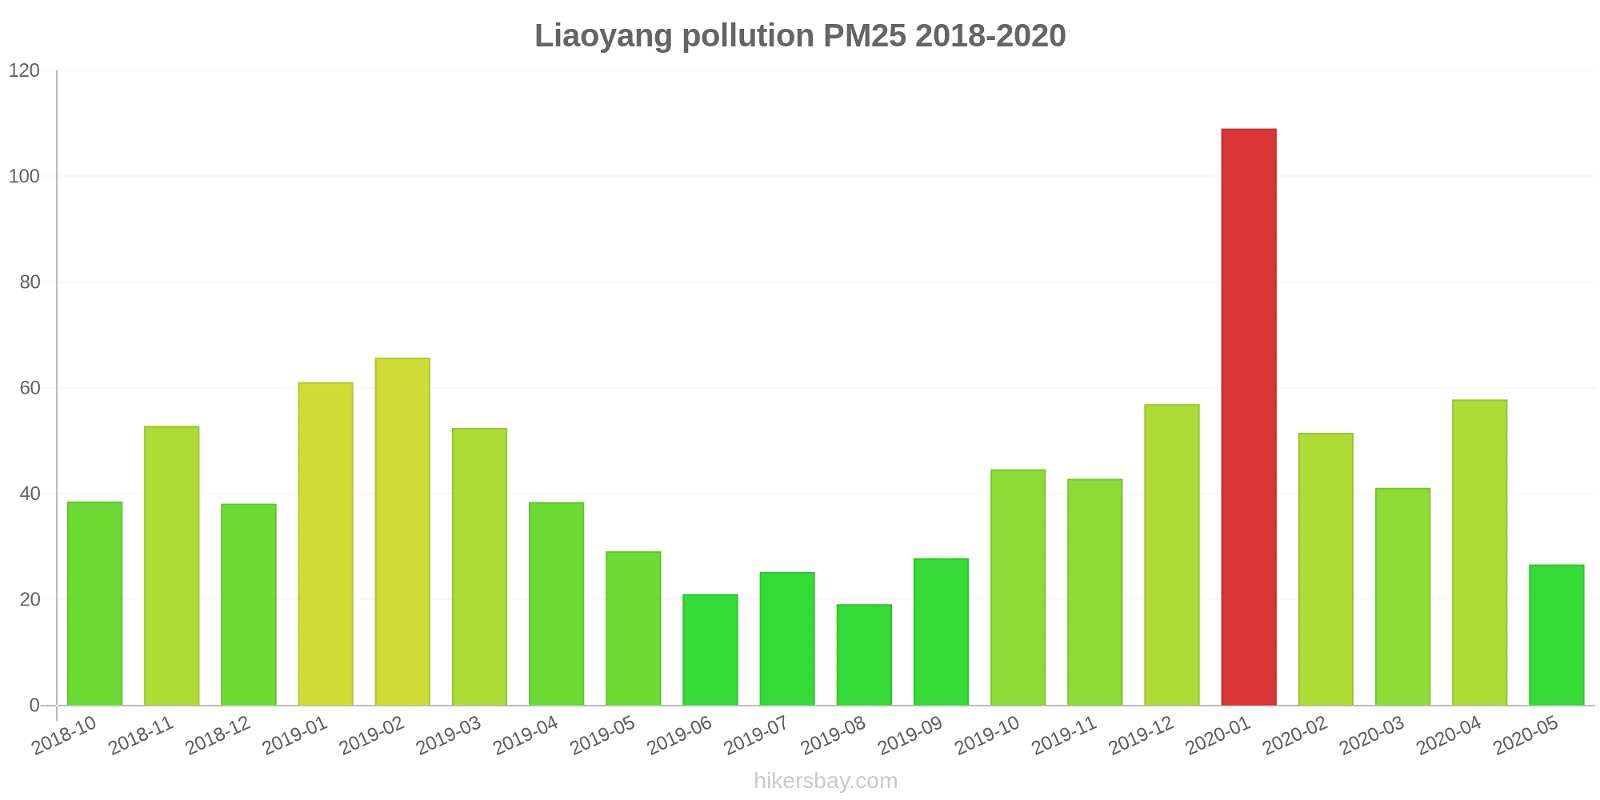
The highest PM2.5 values were recorded: 109 (January 2020).
The lowest level of particulate matter PM2.5 pollution occurs in month: August (19).
How high is the CO level? (carbon monoxide (CO))
100 (Good)
How high is the level of NO2? (nitrogen dioxide (NO2))
8 (Good)
How is the O3 level today in Liaoyang? (ozone (O3))
0 (Good)
What is the level of SO2 pollution? (sulfur dioxide (SO2))
9 (Good)
Current data Friday, May 27, 2022, 12:00 PM
PM10 7 (Good)
PM2,5 2 (Good)
CO 100 (Good)
NO2 8 (Good)
O3 0 (Good)
SO2 9 (Good)
Data on air pollution from recent days in Liaoyang
index
2022-05-27
pm10
32
Moderate
pm25
24
Moderate
co
468
Good
no2
21
Good
o3
32
Good
so2
5
Good
data source »
Air pollution in Liaoyang from October 2018 to May 2020
index
2020-05
2020-04
2020-03
2020-02
2020-01
2019-12
2019-11
2019-10
2019-09
2019-08
2019-07
2019-06
2019-05
2019-04
2019-03
2019-02
2019-01
2018-12
2018-11
2018-10
pm25
27 (Moderate)
58 (Unhealthy)
41 (Unhealthy for Sensitive Groups)
52 (Unhealthy for Sensitive Groups)
109 (Very Unhealthy)
57 (Unhealthy)
43 (Unhealthy for Sensitive Groups)
45 (Unhealthy for Sensitive Groups)
28 (Moderate)
19 (Moderate)
25 (Moderate)
21 (Moderate)
29 (Moderate)
38 (Unhealthy for Sensitive Groups)
52 (Unhealthy for Sensitive Groups)
66 (Unhealthy)
61 (Unhealthy)
38 (Unhealthy for Sensitive Groups)
53 (Unhealthy for Sensitive Groups)
39 (Unhealthy for Sensitive Groups)
co
751 (Good)
845 (Good)
751 (Good)
1 (Good)
1 (Good)
1 (Good)
1 (Good)
1 (Good)
1 (Good)
865 (Good)
692 (Good)
596 (Good)
864 (Good)
789 (Good)
930 (Good)
1 (Good)
1 (Good)
960 (Good)
1 (Good)
860 (Good)
no2
20 (Good)
27 (Good)
21 (Good)
24 (Good)
48 (Moderate)
33 (Good)
36 (Good)
35 (Good)
25 (Good)
17 (Good)
16 (Good)
22 (Good)
21 (Good)
27 (Good)
30 (Good)
33 (Good)
42 (Moderate)
31 (Good)
39 (Good)
29 (Good)
o3
123 (Unhealthy for Sensitive Groups)
132 (Unhealthy for Sensitive Groups)
100 (Moderate)
83 (Moderate)
65 (Good)
57 (Good)
56 (Good)
94 (Moderate)
122 (Unhealthy for Sensitive Groups)
110 (Moderate)
161 (Unhealthy)
147 (Unhealthy for Sensitive Groups)
145 (Unhealthy for Sensitive Groups)
114 (Moderate)
101 (Moderate)
78 (Moderate)
58 (Good)
51 (Good)
62 (Good)
85 (Moderate)
pm10
68 (Unhealthy for Sensitive Groups)
100 (Unhealthy)
63 (Unhealthy for Sensitive Groups)
65 (Unhealthy for Sensitive Groups)
122 (Very Unhealthy)
73 (Unhealthy for Sensitive Groups)
71 (Unhealthy for Sensitive Groups)
82 (Unhealthy)
57 (Unhealthy for Sensitive Groups)
35 (Moderate)
43 (Moderate)
42 (Moderate)
67 (Unhealthy for Sensitive Groups)
91 (Unhealthy)
86 (Unhealthy)
91 (Unhealthy)
100 (Unhealthy)
60 (Unhealthy for Sensitive Groups)
83 (Unhealthy)
67 (Unhealthy for Sensitive Groups)
so2
21 (Good)
20 (Good)
13 (Good)
13 (Good)
23 (Good)
18 (Good)
24 (Good)
18 (Good)
20 (Good)
11 (Good)
9.1 (Good)
13 (Good)
13 (Good)
19 (Good)
20 (Good)
24 (Good)
25 (Good)
21 (Good)
23 (Good)
19 (Good)
data source »
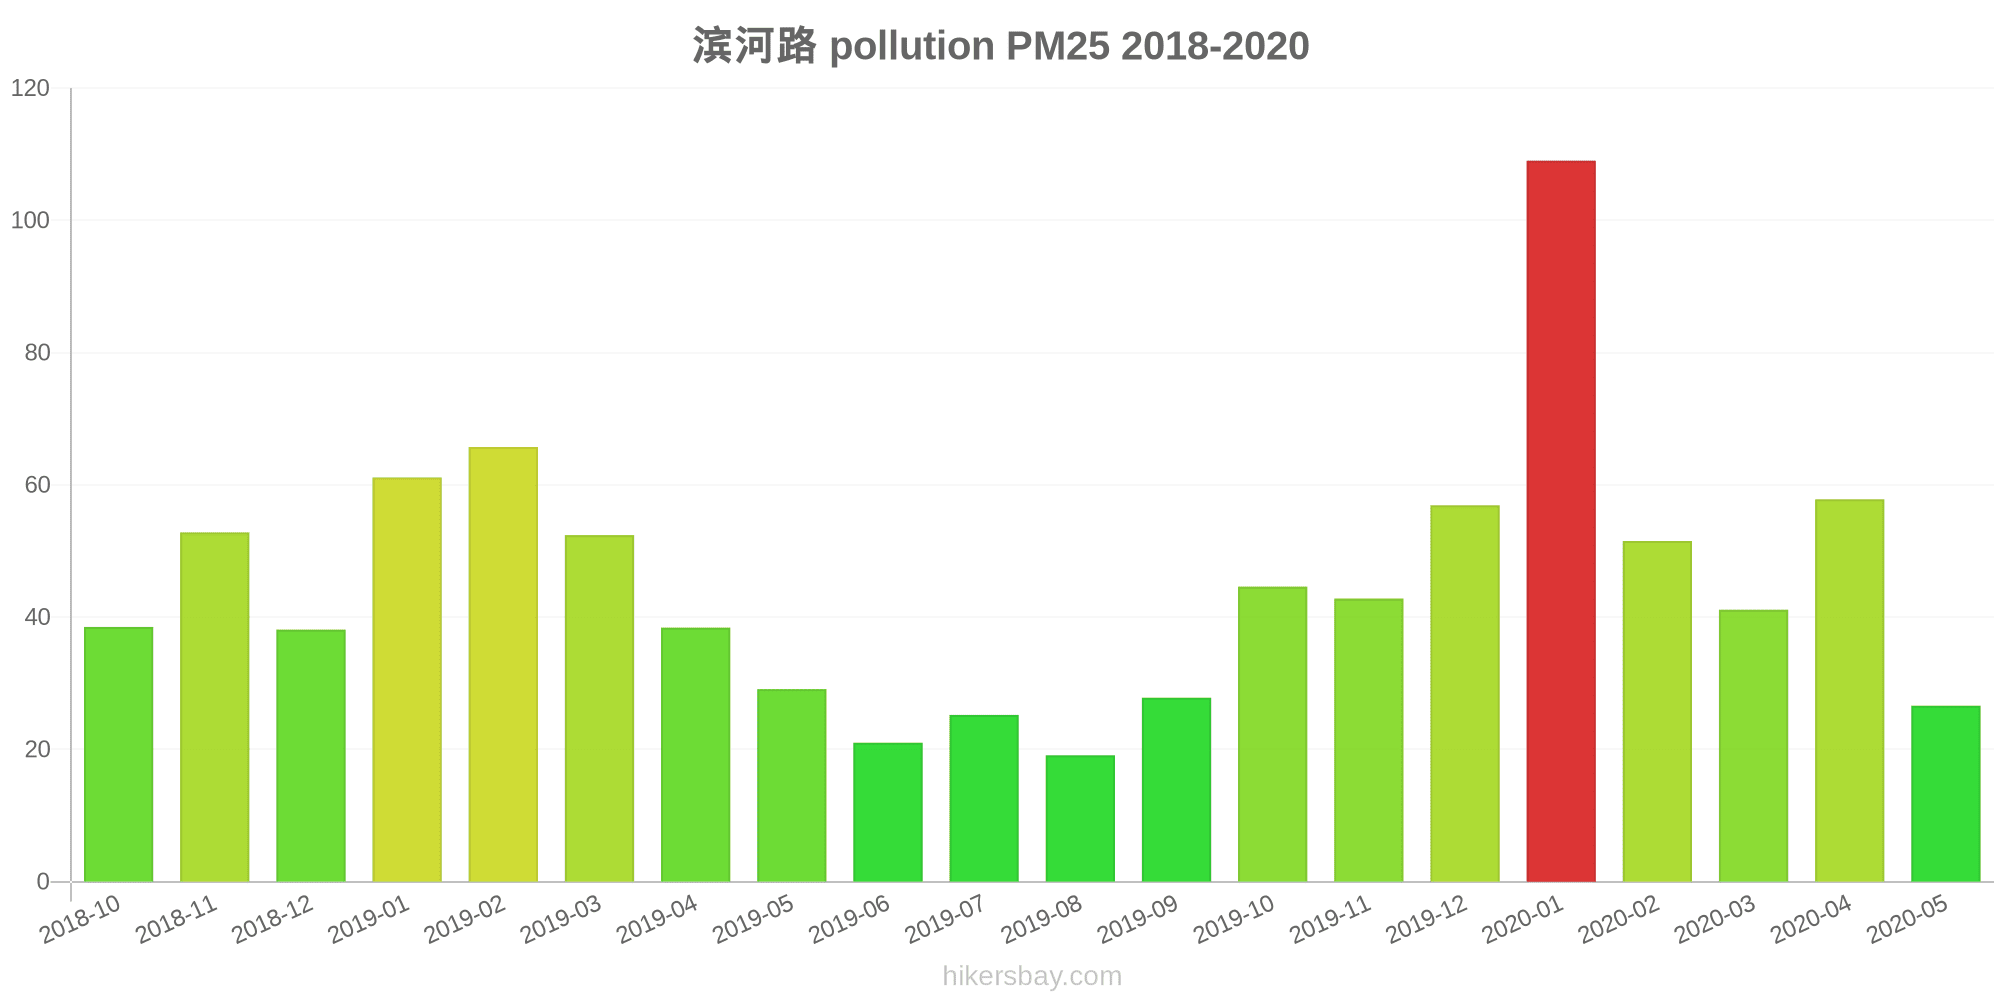
滨河路
Friday, May 27, 2022, 12:00 PM
PM10 6.7 (Good)
particulate matter (PM10) suspended dust
PM2,5 1.7 (Good)
particulate matter (PM2.5) dust
CO 100 (Good)
carbon monoxide (CO)
NO2 7.6 (Good)
nitrogen dioxide (NO2)
O3 0.02 (Good)
ozone (O3)
SO2 8.6 (Good)
sulfur dioxide (SO2)
滨河路
index
2022-05-27
pm10
32
pm25
24
co
468
no2
21
o3
32
so2
4.6
滨河路
2018-10 2020-05

index
2020-05
2020-04
2020-03
2020-02
2020-01
2019-12
2019-11
2019-10
2019-09
2019-08
2019-07
2019-06
2019-05
2019-04
2019-03
2019-02
2019-01
2018-12
2018-11
2018-10
pm25
27
58
41
52
109
57
43
45
28
19
25
21
29
38
52
66
61
38
53
39
co
751
845
751
1
1
1
1
1
1
865
692
596
864
789
930
1
1
960
1
860
no2
20
27
21
24
48
33
36
35
25
17
16
22
21
27
30
33
42
31
39
29
o3
123
132
100
83
65
57
56
94
122
110
161
147
145
114
101
78
58
51
62
85
pm10
68
100
63
65
122
73
71
82
57
35
43
42
67
91
86
91
100
60
83
67
so2
21
20
13
13
23
18
24
18
20
11
9.1
13
13
19
20
24
25
21
23
19
* Pollution data source:
https://openaq.org
(ChinaAQIData)
The data is licensed under CC-By 4.0
PM10 7 (Good)
PM2,5 2 (Good)
CO 100 (Good)
NO2 8 (Good)
O3 0 (Good)
SO2 9 (Good)
Data on air pollution from recent days in Liaoyang
| index | 2022-05-27 |
|---|---|
| pm10 | 32 Moderate |
| pm25 | 24 Moderate |
| co | 468 Good |
| no2 | 21 Good |
| o3 | 32 Good |
| so2 | 5 Good |

| index | 2020-05 | 2020-04 | 2020-03 | 2020-02 | 2020-01 | 2019-12 | 2019-11 | 2019-10 | 2019-09 | 2019-08 | 2019-07 | 2019-06 | 2019-05 | 2019-04 | 2019-03 | 2019-02 | 2019-01 | 2018-12 | 2018-11 | 2018-10 |
|---|---|---|---|---|---|---|---|---|---|---|---|---|---|---|---|---|---|---|---|---|
| pm25 | 27 (Moderate) | 58 (Unhealthy) | 41 (Unhealthy for Sensitive Groups) | 52 (Unhealthy for Sensitive Groups) | 109 (Very Unhealthy) | 57 (Unhealthy) | 43 (Unhealthy for Sensitive Groups) | 45 (Unhealthy for Sensitive Groups) | 28 (Moderate) | 19 (Moderate) | 25 (Moderate) | 21 (Moderate) | 29 (Moderate) | 38 (Unhealthy for Sensitive Groups) | 52 (Unhealthy for Sensitive Groups) | 66 (Unhealthy) | 61 (Unhealthy) | 38 (Unhealthy for Sensitive Groups) | 53 (Unhealthy for Sensitive Groups) | 39 (Unhealthy for Sensitive Groups) |
| co | 751 (Good) | 845 (Good) | 751 (Good) | 1 (Good) | 1 (Good) | 1 (Good) | 1 (Good) | 1 (Good) | 1 (Good) | 865 (Good) | 692 (Good) | 596 (Good) | 864 (Good) | 789 (Good) | 930 (Good) | 1 (Good) | 1 (Good) | 960 (Good) | 1 (Good) | 860 (Good) |
| no2 | 20 (Good) | 27 (Good) | 21 (Good) | 24 (Good) | 48 (Moderate) | 33 (Good) | 36 (Good) | 35 (Good) | 25 (Good) | 17 (Good) | 16 (Good) | 22 (Good) | 21 (Good) | 27 (Good) | 30 (Good) | 33 (Good) | 42 (Moderate) | 31 (Good) | 39 (Good) | 29 (Good) |
| o3 | 123 (Unhealthy for Sensitive Groups) | 132 (Unhealthy for Sensitive Groups) | 100 (Moderate) | 83 (Moderate) | 65 (Good) | 57 (Good) | 56 (Good) | 94 (Moderate) | 122 (Unhealthy for Sensitive Groups) | 110 (Moderate) | 161 (Unhealthy) | 147 (Unhealthy for Sensitive Groups) | 145 (Unhealthy for Sensitive Groups) | 114 (Moderate) | 101 (Moderate) | 78 (Moderate) | 58 (Good) | 51 (Good) | 62 (Good) | 85 (Moderate) |
| pm10 | 68 (Unhealthy for Sensitive Groups) | 100 (Unhealthy) | 63 (Unhealthy for Sensitive Groups) | 65 (Unhealthy for Sensitive Groups) | 122 (Very Unhealthy) | 73 (Unhealthy for Sensitive Groups) | 71 (Unhealthy for Sensitive Groups) | 82 (Unhealthy) | 57 (Unhealthy for Sensitive Groups) | 35 (Moderate) | 43 (Moderate) | 42 (Moderate) | 67 (Unhealthy for Sensitive Groups) | 91 (Unhealthy) | 86 (Unhealthy) | 91 (Unhealthy) | 100 (Unhealthy) | 60 (Unhealthy for Sensitive Groups) | 83 (Unhealthy) | 67 (Unhealthy for Sensitive Groups) |
| so2 | 21 (Good) | 20 (Good) | 13 (Good) | 13 (Good) | 23 (Good) | 18 (Good) | 24 (Good) | 18 (Good) | 20 (Good) | 11 (Good) | 9.1 (Good) | 13 (Good) | 13 (Good) | 19 (Good) | 20 (Good) | 24 (Good) | 25 (Good) | 21 (Good) | 23 (Good) | 19 (Good) |
PM10 6.7 (Good)
particulate matter (PM10) suspended dustPM2,5 1.7 (Good)
particulate matter (PM2.5) dustCO 100 (Good)
carbon monoxide (CO)NO2 7.6 (Good)
nitrogen dioxide (NO2)O3 0.02 (Good)
ozone (O3)SO2 8.6 (Good)
sulfur dioxide (SO2)滨河路
| index | 2022-05-27 |
|---|---|
| pm10 | 32 |
| pm25 | 24 |
| co | 468 |
| no2 | 21 |
| o3 | 32 |
| so2 | 4.6 |
滨河路
| index | 2020-05 | 2020-04 | 2020-03 | 2020-02 | 2020-01 | 2019-12 | 2019-11 | 2019-10 | 2019-09 | 2019-08 | 2019-07 | 2019-06 | 2019-05 | 2019-04 | 2019-03 | 2019-02 | 2019-01 | 2018-12 | 2018-11 | 2018-10 |
|---|---|---|---|---|---|---|---|---|---|---|---|---|---|---|---|---|---|---|---|---|
| pm25 | 27 | 58 | 41 | 52 | 109 | 57 | 43 | 45 | 28 | 19 | 25 | 21 | 29 | 38 | 52 | 66 | 61 | 38 | 53 | 39 |
| co | 751 | 845 | 751 | 1 | 1 | 1 | 1 | 1 | 1 | 865 | 692 | 596 | 864 | 789 | 930 | 1 | 1 | 960 | 1 | 860 |
| no2 | 20 | 27 | 21 | 24 | 48 | 33 | 36 | 35 | 25 | 17 | 16 | 22 | 21 | 27 | 30 | 33 | 42 | 31 | 39 | 29 |
| o3 | 123 | 132 | 100 | 83 | 65 | 57 | 56 | 94 | 122 | 110 | 161 | 147 | 145 | 114 | 101 | 78 | 58 | 51 | 62 | 85 |
| pm10 | 68 | 100 | 63 | 65 | 122 | 73 | 71 | 82 | 57 | 35 | 43 | 42 | 67 | 91 | 86 | 91 | 100 | 60 | 83 | 67 |
| so2 | 21 | 20 | 13 | 13 | 23 | 18 | 24 | 18 | 20 | 11 | 9.1 | 13 | 13 | 19 | 20 | 24 | 25 | 21 | 23 | 19 |