Air Pollution in Piao’ertun: Real-time Air Quality Index and smog alert.
Pollution and air quality forecast for Piao’ertun. Today is Tuesday, June 16, 2026. The following air pollution values have been recorded for Piao’ertun:- particulate matter (PM10) suspended dust - 7 (Good)
- particulate matter (PM2.5) dust - 2 (Good)
- carbon monoxide (CO) - 100 (Good)
- nitrogen dioxide (NO2) - 8 (Good)
- ozone (O3) - 0 (Good)
- sulfur dioxide (SO2) - 9 (Good)

What is the air quality in Piao’ertun today? Is the air polluted in Piao’ertun?. Is there smog?
What is the level of PM10 today in Piao’ertun? (particulate matter (PM10) suspended dust)
The current level of particulate matter PM10 in Piao’ertun is:
7 (Good)
The highest PM10 values usually occur in month: 150 (January 2020).
The lowest value of particulate matter PM10 pollution in Piao’ertun is usually recorded in: August (39).
What is the current level of PM2.5 in Piao’ertun? (particulate matter (PM2.5) dust)
Today's PM2.5 level is:
2 (Good)
For comparison, the highest level of PM2.5 in Piao’ertun in the last 7 days was: 24 (Friday, May 27, 2022) and the lowest: 24 (Friday, May 27, 2022).
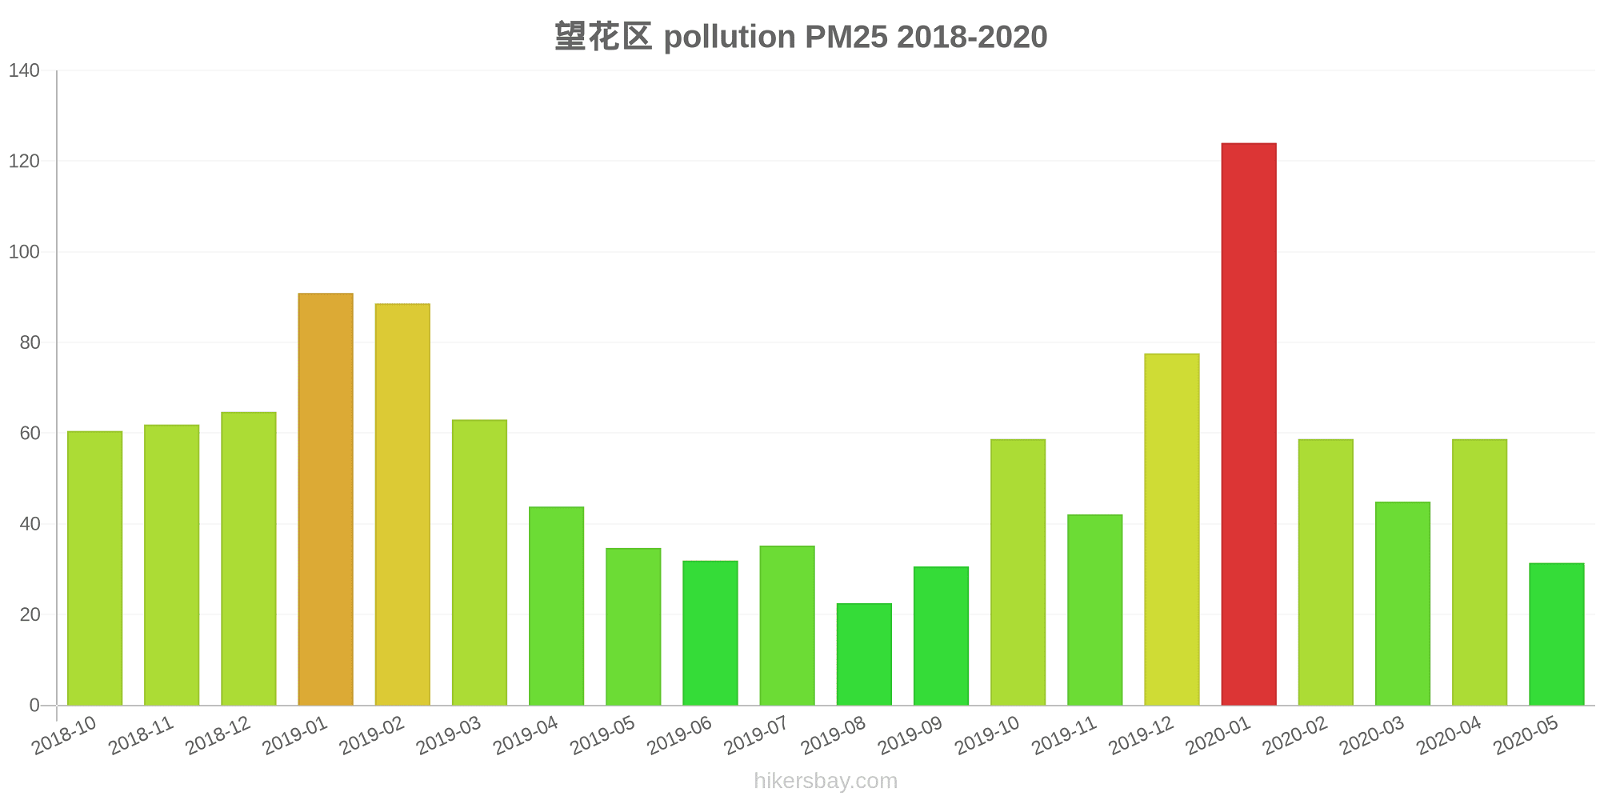
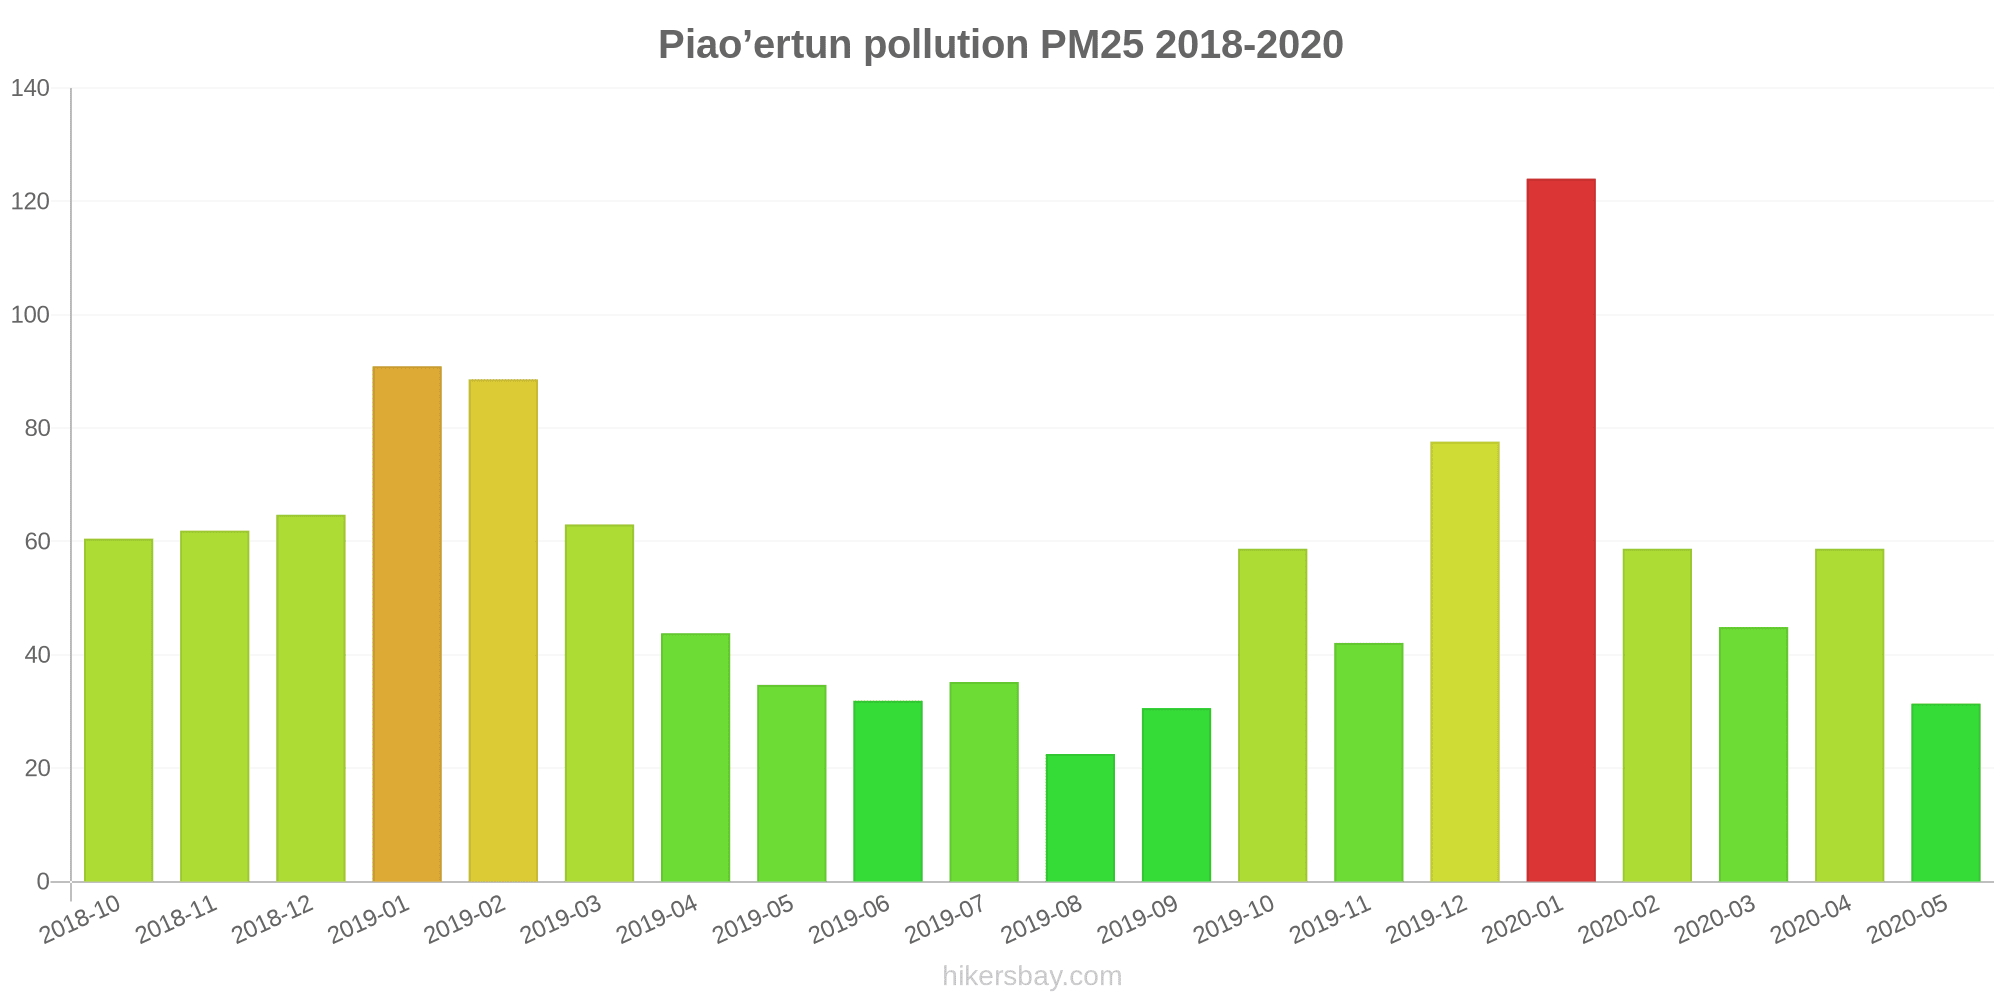
The highest PM2.5 values were recorded: 124 (January 2020).
The lowest level of particulate matter PM2.5 pollution occurs in month: August (23).
How high is the CO level? (carbon monoxide (CO))
100 (Good)
How high is the level of NO2? (nitrogen dioxide (NO2))
8 (Good)
How is the O3 level today in Piao’ertun? (ozone (O3))
0 (Good)
What is the level of SO2 pollution? (sulfur dioxide (SO2))
9 (Good)
Current data Friday, May 27, 2022, 12:00 PM
PM10 7 (Good)
PM2,5 2 (Good)
CO 100 (Good)
NO2 8 (Good)
O3 0 (Good)
SO2 9 (Good)
Data on air pollution from recent days in Piao’ertun
index
2022-05-27
pm10
32
Moderate
pm25
24
Moderate
co
468
Good
no2
21
Good
o3
32
Good
so2
5
Good
data source »
Air pollution in Piao’ertun from October 2018 to May 2020

index
2020-05
2020-04
2020-03
2020-02
2020-01
2019-12
2019-11
2019-10
2019-09
2019-08
2019-07
2019-06
2019-05
2019-04
2019-03
2019-02
2019-01
2018-12
2018-11
2018-10
pm25
31 (Moderate)
59 (Unhealthy)
45 (Unhealthy for Sensitive Groups)
59 (Unhealthy)
124 (Very bad Hazardous)
78 (Very Unhealthy)
42 (Unhealthy for Sensitive Groups)
59 (Unhealthy)
31 (Moderate)
23 (Moderate)
35 (Unhealthy for Sensitive Groups)
32 (Moderate)
35 (Moderate)
44 (Unhealthy for Sensitive Groups)
63 (Unhealthy)
89 (Very Unhealthy)
91 (Very Unhealthy)
65 (Unhealthy)
62 (Unhealthy)
61 (Unhealthy)
co
746 (Good)
820 (Good)
701 (Good)
899 (Good)
1 (Good)
1 (Good)
808 (Good)
966 (Good)
847 (Good)
766 (Good)
925 (Good)
746 (Good)
824 (Good)
828 (Good)
931 (Good)
1 (Good)
1 (Good)
1 (Good)
954 (Good)
1 (Good)
no2
21 (Good)
32 (Good)
25 (Good)
26 (Good)
45 (Moderate)
41 (Moderate)
34 (Good)
38 (Good)
31 (Good)
21 (Good)
21 (Good)
28 (Good)
28 (Good)
33 (Good)
39 (Good)
41 (Moderate)
49 (Moderate)
40 (Good)
42 (Moderate)
39 (Good)
o3
128 (Unhealthy for Sensitive Groups)
126 (Unhealthy for Sensitive Groups)
99 (Moderate)
85 (Moderate)
69 (Good)
55 (Good)
61 (Good)
96 (Moderate)
124 (Unhealthy for Sensitive Groups)
117 (Moderate)
180 (Very Unhealthy)
155 (Unhealthy)
143 (Unhealthy for Sensitive Groups)
113 (Moderate)
101 (Moderate)
85 (Moderate)
66 (Good)
60 (Good)
68 (Good)
84 (Moderate)
pm10
81 (Unhealthy)
115 (Very Unhealthy)
78 (Unhealthy for Sensitive Groups)
78 (Unhealthy for Sensitive Groups)
150 (Very bad Hazardous)
106 (Unhealthy)
75 (Unhealthy for Sensitive Groups)
106 (Unhealthy)
69 (Unhealthy for Sensitive Groups)
39 (Moderate)
53 (Unhealthy for Sensitive Groups)
48 (Moderate)
86 (Unhealthy)
116 (Very Unhealthy)
102 (Unhealthy)
119 (Very Unhealthy)
137 (Very Unhealthy)
92 (Unhealthy)
94 (Unhealthy)
85 (Unhealthy)
so2
22 (Good)
23 (Good)
21 (Good)
19 (Good)
28 (Good)
25 (Good)
19 (Good)
22 (Good)
21 (Good)
18 (Good)
20 (Good)
21 (Good)
27 (Good)
24 (Good)
24 (Good)
33 (Good)
33 (Good)
25 (Good)
25 (Good)
25 (Good)
data source »
望花区
Friday, May 27, 2022, 12:00 PM
PM10 6.7 (Good)
particulate matter (PM10) suspended dust
PM2,5 1.7 (Good)
particulate matter (PM2.5) dust
CO 100 (Good)
carbon monoxide (CO)
NO2 7.6 (Good)
nitrogen dioxide (NO2)
O3 0.02 (Good)
ozone (O3)
SO2 8.6 (Good)
sulfur dioxide (SO2)
望花区
index
2022-05-27
pm10
32
pm25
24
co
468
no2
21
o3
32
so2
4.6
望花区
2018-10 2020-05
index
2020-05
2020-04
2020-03
2020-02
2020-01
2019-12
2019-11
2019-10
2019-09
2019-08
2019-07
2019-06
2019-05
2019-04
2019-03
2019-02
2019-01
2018-12
2018-11
2018-10
pm25
31
59
45
59
124
78
42
59
31
23
35
32
35
44
63
89
91
65
62
61
co
746
820
701
899
1
1
808
966
847
766
925
746
824
828
931
1
1
1
954
1
no2
21
32
25
26
45
41
34
38
31
21
21
28
28
33
39
41
49
40
42
39
o3
128
126
99
85
69
55
61
96
124
117
180
155
143
113
101
85
66
60
68
84
pm10
81
115
78
78
150
106
75
106
69
39
53
48
86
116
102
119
137
92
94
85
so2
22
23
21
19
28
25
19
22
21
18
20
21
27
24
24
33
33
25
25
25
* Pollution data source:
https://openaq.org
(ChinaAQIData)
The data is licensed under CC-By 4.0
PM10 7 (Good)
PM2,5 2 (Good)
CO 100 (Good)
NO2 8 (Good)
O3 0 (Good)
SO2 9 (Good)
Data on air pollution from recent days in Piao’ertun
| index | 2022-05-27 |
|---|---|
| pm10 | 32 Moderate |
| pm25 | 24 Moderate |
| co | 468 Good |
| no2 | 21 Good |
| o3 | 32 Good |
| so2 | 5 Good |
| index | 2020-05 | 2020-04 | 2020-03 | 2020-02 | 2020-01 | 2019-12 | 2019-11 | 2019-10 | 2019-09 | 2019-08 | 2019-07 | 2019-06 | 2019-05 | 2019-04 | 2019-03 | 2019-02 | 2019-01 | 2018-12 | 2018-11 | 2018-10 |
|---|---|---|---|---|---|---|---|---|---|---|---|---|---|---|---|---|---|---|---|---|
| pm25 | 31 (Moderate) | 59 (Unhealthy) | 45 (Unhealthy for Sensitive Groups) | 59 (Unhealthy) | 124 (Very bad Hazardous) | 78 (Very Unhealthy) | 42 (Unhealthy for Sensitive Groups) | 59 (Unhealthy) | 31 (Moderate) | 23 (Moderate) | 35 (Unhealthy for Sensitive Groups) | 32 (Moderate) | 35 (Moderate) | 44 (Unhealthy for Sensitive Groups) | 63 (Unhealthy) | 89 (Very Unhealthy) | 91 (Very Unhealthy) | 65 (Unhealthy) | 62 (Unhealthy) | 61 (Unhealthy) |
| co | 746 (Good) | 820 (Good) | 701 (Good) | 899 (Good) | 1 (Good) | 1 (Good) | 808 (Good) | 966 (Good) | 847 (Good) | 766 (Good) | 925 (Good) | 746 (Good) | 824 (Good) | 828 (Good) | 931 (Good) | 1 (Good) | 1 (Good) | 1 (Good) | 954 (Good) | 1 (Good) |
| no2 | 21 (Good) | 32 (Good) | 25 (Good) | 26 (Good) | 45 (Moderate) | 41 (Moderate) | 34 (Good) | 38 (Good) | 31 (Good) | 21 (Good) | 21 (Good) | 28 (Good) | 28 (Good) | 33 (Good) | 39 (Good) | 41 (Moderate) | 49 (Moderate) | 40 (Good) | 42 (Moderate) | 39 (Good) |
| o3 | 128 (Unhealthy for Sensitive Groups) | 126 (Unhealthy for Sensitive Groups) | 99 (Moderate) | 85 (Moderate) | 69 (Good) | 55 (Good) | 61 (Good) | 96 (Moderate) | 124 (Unhealthy for Sensitive Groups) | 117 (Moderate) | 180 (Very Unhealthy) | 155 (Unhealthy) | 143 (Unhealthy for Sensitive Groups) | 113 (Moderate) | 101 (Moderate) | 85 (Moderate) | 66 (Good) | 60 (Good) | 68 (Good) | 84 (Moderate) |
| pm10 | 81 (Unhealthy) | 115 (Very Unhealthy) | 78 (Unhealthy for Sensitive Groups) | 78 (Unhealthy for Sensitive Groups) | 150 (Very bad Hazardous) | 106 (Unhealthy) | 75 (Unhealthy for Sensitive Groups) | 106 (Unhealthy) | 69 (Unhealthy for Sensitive Groups) | 39 (Moderate) | 53 (Unhealthy for Sensitive Groups) | 48 (Moderate) | 86 (Unhealthy) | 116 (Very Unhealthy) | 102 (Unhealthy) | 119 (Very Unhealthy) | 137 (Very Unhealthy) | 92 (Unhealthy) | 94 (Unhealthy) | 85 (Unhealthy) |
| so2 | 22 (Good) | 23 (Good) | 21 (Good) | 19 (Good) | 28 (Good) | 25 (Good) | 19 (Good) | 22 (Good) | 21 (Good) | 18 (Good) | 20 (Good) | 21 (Good) | 27 (Good) | 24 (Good) | 24 (Good) | 33 (Good) | 33 (Good) | 25 (Good) | 25 (Good) | 25 (Good) |
PM10 6.7 (Good)
particulate matter (PM10) suspended dustPM2,5 1.7 (Good)
particulate matter (PM2.5) dustCO 100 (Good)
carbon monoxide (CO)NO2 7.6 (Good)
nitrogen dioxide (NO2)O3 0.02 (Good)
ozone (O3)SO2 8.6 (Good)
sulfur dioxide (SO2)望花区
| index | 2022-05-27 |
|---|---|
| pm10 | 32 |
| pm25 | 24 |
| co | 468 |
| no2 | 21 |
| o3 | 32 |
| so2 | 4.6 |
望花区

| index | 2020-05 | 2020-04 | 2020-03 | 2020-02 | 2020-01 | 2019-12 | 2019-11 | 2019-10 | 2019-09 | 2019-08 | 2019-07 | 2019-06 | 2019-05 | 2019-04 | 2019-03 | 2019-02 | 2019-01 | 2018-12 | 2018-11 | 2018-10 |
|---|---|---|---|---|---|---|---|---|---|---|---|---|---|---|---|---|---|---|---|---|
| pm25 | 31 | 59 | 45 | 59 | 124 | 78 | 42 | 59 | 31 | 23 | 35 | 32 | 35 | 44 | 63 | 89 | 91 | 65 | 62 | 61 |
| co | 746 | 820 | 701 | 899 | 1 | 1 | 808 | 966 | 847 | 766 | 925 | 746 | 824 | 828 | 931 | 1 | 1 | 1 | 954 | 1 |
| no2 | 21 | 32 | 25 | 26 | 45 | 41 | 34 | 38 | 31 | 21 | 21 | 28 | 28 | 33 | 39 | 41 | 49 | 40 | 42 | 39 |
| o3 | 128 | 126 | 99 | 85 | 69 | 55 | 61 | 96 | 124 | 117 | 180 | 155 | 143 | 113 | 101 | 85 | 66 | 60 | 68 | 84 |
| pm10 | 81 | 115 | 78 | 78 | 150 | 106 | 75 | 106 | 69 | 39 | 53 | 48 | 86 | 116 | 102 | 119 | 137 | 92 | 94 | 85 |
| so2 | 22 | 23 | 21 | 19 | 28 | 25 | 19 | 22 | 21 | 18 | 20 | 21 | 27 | 24 | 24 | 33 | 33 | 25 | 25 | 25 |