Air Pollution in Pingzhuang: Real-time Air Quality Index and smog alert.
Pollution and air quality forecast for Pingzhuang. Today is Tuesday, June 16, 2026. The following air pollution values have been recorded for Pingzhuang:- particulate matter (PM10) suspended dust - 7 (Good)
- particulate matter (PM2.5) dust - 2 (Good)
- carbon monoxide (CO) - 100 (Good)
- nitrogen dioxide (NO2) - 8 (Good)
- ozone (O3) - 0 (Good)
- sulfur dioxide (SO2) - 9 (Good)

What is the air quality in Pingzhuang today? Is the air polluted in Pingzhuang?. Is there smog?
What is the level of PM10 today in Pingzhuang? (particulate matter (PM10) suspended dust)
The current level of particulate matter PM10 in Pingzhuang is:
7 (Good)
The highest PM10 values usually occur in month: 122 (November 2018).
The lowest value of particulate matter PM10 pollution in Pingzhuang is usually recorded in: August (35).
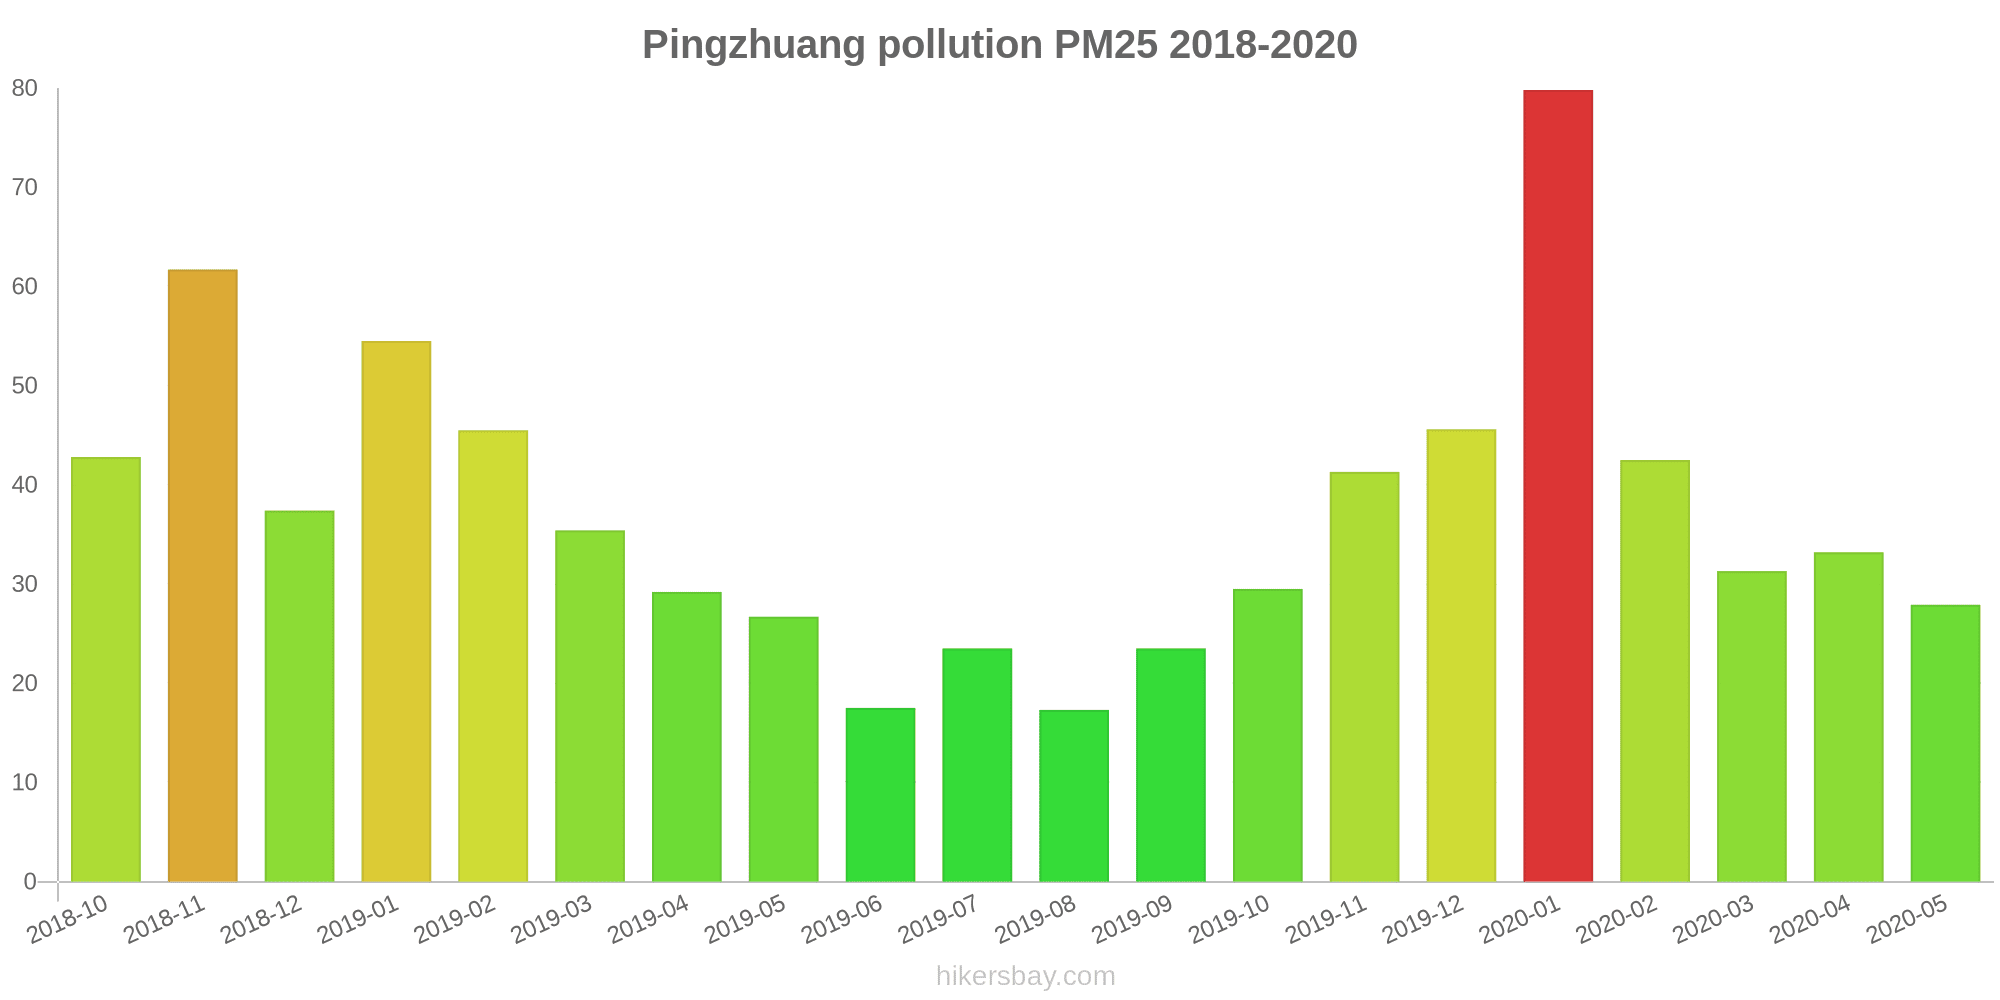
What is the current level of PM2.5 in Pingzhuang? (particulate matter (PM2.5) dust)
Today's PM2.5 level is:
2 (Good)
For comparison, the highest level of PM2.5 in Pingzhuang in the last 7 days was: 24 (Friday, May 27, 2022) and the lowest: 24 (Friday, May 27, 2022).
The highest PM2.5 values were recorded: 80 (January 2020).
The lowest level of particulate matter PM2.5 pollution occurs in month: August (17).
How high is the CO level? (carbon monoxide (CO))
100 (Good)
How high is the level of NO2? (nitrogen dioxide (NO2))
8 (Good)
How is the O3 level today in Pingzhuang? (ozone (O3))
0 (Good)
What is the level of SO2 pollution? (sulfur dioxide (SO2))
9 (Good)
Current data Friday, May 27, 2022, 12:00 PM
PM10 7 (Good)
PM2,5 2 (Good)
CO 100 (Good)
NO2 8 (Good)
O3 0 (Good)
SO2 9 (Good)
Data on air pollution from recent days in Pingzhuang
index
2022-05-27
pm10
32
Moderate
pm25
24
Moderate
co
468
Good
no2
21
Good
o3
32
Good
so2
5
Good
data source »
Air pollution in Pingzhuang from October 2018 to May 2020

index
2020-05
2020-04
2020-03
2020-02
2020-01
2019-12
2019-11
2019-10
2019-09
2019-08
2019-07
2019-06
2019-05
2019-04
2019-03
2019-02
2019-01
2018-12
2018-11
2018-10
pm25
28 (Moderate)
33 (Moderate)
31 (Moderate)
43 (Unhealthy for Sensitive Groups)
80 (Very Unhealthy)
46 (Unhealthy for Sensitive Groups)
41 (Unhealthy for Sensitive Groups)
30 (Moderate)
24 (Moderate)
17 (Moderate)
24 (Moderate)
18 (Moderate)
27 (Moderate)
29 (Moderate)
35 (Unhealthy for Sensitive Groups)
46 (Unhealthy for Sensitive Groups)
55 (Unhealthy for Sensitive Groups)
37 (Unhealthy for Sensitive Groups)
62 (Unhealthy)
43 (Unhealthy for Sensitive Groups)
co
623 (Good)
718 (Good)
702 (Good)
1 (Good)
1 (Good)
1 (Good)
784 (Good)
564 (Good)
470 (Good)
520 (Good)
433 (Good)
328 (Good)
318 (Good)
418 (Good)
456 (Good)
757 (Good)
1 (Good)
924 (Good)
1 (Good)
719 (Good)
no2
15 (Good)
17 (Good)
15 (Good)
16 (Good)
29 (Good)
29 (Good)
26 (Good)
26 (Good)
20 (Good)
16 (Good)
17 (Good)
16 (Good)
17 (Good)
18 (Good)
20 (Good)
19 (Good)
28 (Good)
20 (Good)
34 (Good)
27 (Good)
o3
145 (Unhealthy for Sensitive Groups)
116 (Moderate)
101 (Moderate)
82 (Moderate)
66 (Good)
57 (Good)
61 (Good)
80 (Moderate)
98 (Moderate)
91 (Moderate)
136 (Unhealthy for Sensitive Groups)
137 (Unhealthy for Sensitive Groups)
145 (Unhealthy for Sensitive Groups)
112 (Moderate)
86 (Moderate)
79 (Moderate)
56 (Good)
57 (Good)
61 (Good)
72 (Moderate)
pm10
79 (Unhealthy for Sensitive Groups)
87 (Unhealthy)
55 (Unhealthy for Sensitive Groups)
60 (Unhealthy for Sensitive Groups)
115 (Very Unhealthy)
75 (Unhealthy for Sensitive Groups)
83 (Unhealthy)
70 (Unhealthy for Sensitive Groups)
60 (Unhealthy for Sensitive Groups)
35 (Moderate)
47 (Moderate)
50 (Moderate)
77 (Unhealthy for Sensitive Groups)
89 (Unhealthy)
69 (Unhealthy for Sensitive Groups)
77 (Unhealthy for Sensitive Groups)
93 (Unhealthy)
78 (Unhealthy for Sensitive Groups)
122 (Very Unhealthy)
95 (Unhealthy)
so2
15 (Good)
16 (Good)
14 (Good)
20 (Good)
46 (Good)
35 (Good)
24 (Good)
19 (Good)
18 (Good)
14 (Good)
16 (Good)
13 (Good)
14 (Good)
15 (Good)
20 (Good)
34 (Good)
49 (Good)
30 (Good)
38 (Good)
25 (Good)
data source »
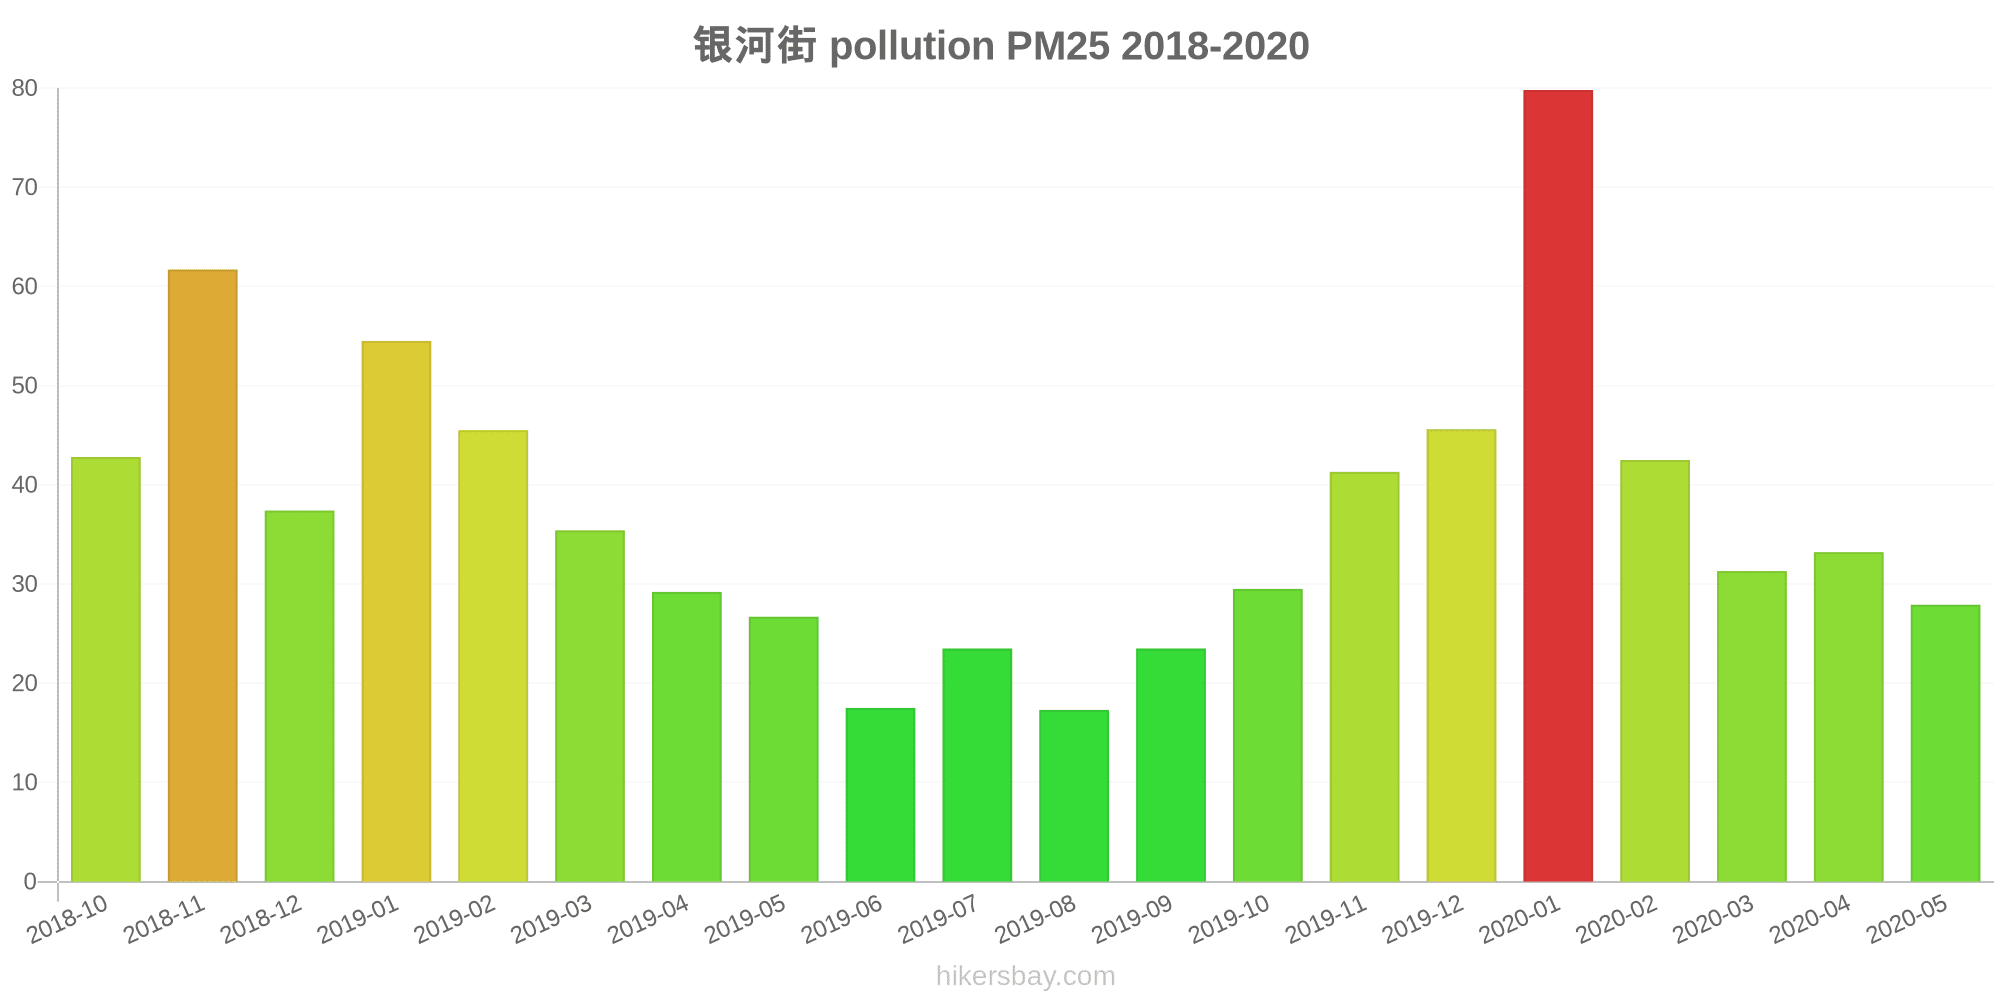
银河街
Friday, May 27, 2022, 12:00 PM
PM10 6.7 (Good)
particulate matter (PM10) suspended dust
PM2,5 1.7 (Good)
particulate matter (PM2.5) dust
CO 100 (Good)
carbon monoxide (CO)
NO2 7.6 (Good)
nitrogen dioxide (NO2)
O3 0.02 (Good)
ozone (O3)
SO2 8.6 (Good)
sulfur dioxide (SO2)
银河街
index
2022-05-27
pm10
32
pm25
24
co
468
no2
21
o3
32
so2
4.6
银河街
2018-10 2020-05

index
2020-05
2020-04
2020-03
2020-02
2020-01
2019-12
2019-11
2019-10
2019-09
2019-08
2019-07
2019-06
2019-05
2019-04
2019-03
2019-02
2019-01
2018-12
2018-11
2018-10
pm25
28
33
31
43
80
46
41
30
24
17
24
18
27
29
35
46
55
37
62
43
co
623
718
702
1
1
1
784
564
470
520
433
328
318
418
456
757
1
924
1
719
no2
15
17
15
16
29
29
26
26
20
16
17
16
17
18
20
19
28
20
34
27
o3
145
116
101
82
66
57
61
80
98
91
136
137
145
112
86
79
56
57
61
72
pm10
79
87
55
60
115
75
83
70
60
35
47
50
77
89
69
77
93
78
122
95
so2
15
16
14
20
46
35
24
19
18
14
16
13
14
15
20
34
49
30
38
25
* Pollution data source:
https://openaq.org
(ChinaAQIData)
The data is licensed under CC-By 4.0
PM10 7 (Good)
PM2,5 2 (Good)
CO 100 (Good)
NO2 8 (Good)
O3 0 (Good)
SO2 9 (Good)
Data on air pollution from recent days in Pingzhuang
| index | 2022-05-27 |
|---|---|
| pm10 | 32 Moderate |
| pm25 | 24 Moderate |
| co | 468 Good |
| no2 | 21 Good |
| o3 | 32 Good |
| so2 | 5 Good |
| index | 2020-05 | 2020-04 | 2020-03 | 2020-02 | 2020-01 | 2019-12 | 2019-11 | 2019-10 | 2019-09 | 2019-08 | 2019-07 | 2019-06 | 2019-05 | 2019-04 | 2019-03 | 2019-02 | 2019-01 | 2018-12 | 2018-11 | 2018-10 |
|---|---|---|---|---|---|---|---|---|---|---|---|---|---|---|---|---|---|---|---|---|
| pm25 | 28 (Moderate) | 33 (Moderate) | 31 (Moderate) | 43 (Unhealthy for Sensitive Groups) | 80 (Very Unhealthy) | 46 (Unhealthy for Sensitive Groups) | 41 (Unhealthy for Sensitive Groups) | 30 (Moderate) | 24 (Moderate) | 17 (Moderate) | 24 (Moderate) | 18 (Moderate) | 27 (Moderate) | 29 (Moderate) | 35 (Unhealthy for Sensitive Groups) | 46 (Unhealthy for Sensitive Groups) | 55 (Unhealthy for Sensitive Groups) | 37 (Unhealthy for Sensitive Groups) | 62 (Unhealthy) | 43 (Unhealthy for Sensitive Groups) |
| co | 623 (Good) | 718 (Good) | 702 (Good) | 1 (Good) | 1 (Good) | 1 (Good) | 784 (Good) | 564 (Good) | 470 (Good) | 520 (Good) | 433 (Good) | 328 (Good) | 318 (Good) | 418 (Good) | 456 (Good) | 757 (Good) | 1 (Good) | 924 (Good) | 1 (Good) | 719 (Good) |
| no2 | 15 (Good) | 17 (Good) | 15 (Good) | 16 (Good) | 29 (Good) | 29 (Good) | 26 (Good) | 26 (Good) | 20 (Good) | 16 (Good) | 17 (Good) | 16 (Good) | 17 (Good) | 18 (Good) | 20 (Good) | 19 (Good) | 28 (Good) | 20 (Good) | 34 (Good) | 27 (Good) |
| o3 | 145 (Unhealthy for Sensitive Groups) | 116 (Moderate) | 101 (Moderate) | 82 (Moderate) | 66 (Good) | 57 (Good) | 61 (Good) | 80 (Moderate) | 98 (Moderate) | 91 (Moderate) | 136 (Unhealthy for Sensitive Groups) | 137 (Unhealthy for Sensitive Groups) | 145 (Unhealthy for Sensitive Groups) | 112 (Moderate) | 86 (Moderate) | 79 (Moderate) | 56 (Good) | 57 (Good) | 61 (Good) | 72 (Moderate) |
| pm10 | 79 (Unhealthy for Sensitive Groups) | 87 (Unhealthy) | 55 (Unhealthy for Sensitive Groups) | 60 (Unhealthy for Sensitive Groups) | 115 (Very Unhealthy) | 75 (Unhealthy for Sensitive Groups) | 83 (Unhealthy) | 70 (Unhealthy for Sensitive Groups) | 60 (Unhealthy for Sensitive Groups) | 35 (Moderate) | 47 (Moderate) | 50 (Moderate) | 77 (Unhealthy for Sensitive Groups) | 89 (Unhealthy) | 69 (Unhealthy for Sensitive Groups) | 77 (Unhealthy for Sensitive Groups) | 93 (Unhealthy) | 78 (Unhealthy for Sensitive Groups) | 122 (Very Unhealthy) | 95 (Unhealthy) |
| so2 | 15 (Good) | 16 (Good) | 14 (Good) | 20 (Good) | 46 (Good) | 35 (Good) | 24 (Good) | 19 (Good) | 18 (Good) | 14 (Good) | 16 (Good) | 13 (Good) | 14 (Good) | 15 (Good) | 20 (Good) | 34 (Good) | 49 (Good) | 30 (Good) | 38 (Good) | 25 (Good) |
PM10 6.7 (Good)
particulate matter (PM10) suspended dustPM2,5 1.7 (Good)
particulate matter (PM2.5) dustCO 100 (Good)
carbon monoxide (CO)NO2 7.6 (Good)
nitrogen dioxide (NO2)O3 0.02 (Good)
ozone (O3)SO2 8.6 (Good)
sulfur dioxide (SO2)银河街
| index | 2022-05-27 |
|---|---|
| pm10 | 32 |
| pm25 | 24 |
| co | 468 |
| no2 | 21 |
| o3 | 32 |
| so2 | 4.6 |
银河街
| index | 2020-05 | 2020-04 | 2020-03 | 2020-02 | 2020-01 | 2019-12 | 2019-11 | 2019-10 | 2019-09 | 2019-08 | 2019-07 | 2019-06 | 2019-05 | 2019-04 | 2019-03 | 2019-02 | 2019-01 | 2018-12 | 2018-11 | 2018-10 |
|---|---|---|---|---|---|---|---|---|---|---|---|---|---|---|---|---|---|---|---|---|
| pm25 | 28 | 33 | 31 | 43 | 80 | 46 | 41 | 30 | 24 | 17 | 24 | 18 | 27 | 29 | 35 | 46 | 55 | 37 | 62 | 43 |
| co | 623 | 718 | 702 | 1 | 1 | 1 | 784 | 564 | 470 | 520 | 433 | 328 | 318 | 418 | 456 | 757 | 1 | 924 | 1 | 719 |
| no2 | 15 | 17 | 15 | 16 | 29 | 29 | 26 | 26 | 20 | 16 | 17 | 16 | 17 | 18 | 20 | 19 | 28 | 20 | 34 | 27 |
| o3 | 145 | 116 | 101 | 82 | 66 | 57 | 61 | 80 | 98 | 91 | 136 | 137 | 145 | 112 | 86 | 79 | 56 | 57 | 61 | 72 |
| pm10 | 79 | 87 | 55 | 60 | 115 | 75 | 83 | 70 | 60 | 35 | 47 | 50 | 77 | 89 | 69 | 77 | 93 | 78 | 122 | 95 |
| so2 | 15 | 16 | 14 | 20 | 46 | 35 | 24 | 19 | 18 | 14 | 16 | 13 | 14 | 15 | 20 | 34 | 49 | 30 | 38 | 25 |