Air Pollution in Siping: Real-time Air Quality Index and smog alert.
Pollution and air quality forecast for Siping. Today is Tuesday, June 16, 2026. The following air pollution values have been recorded for Siping:- particulate matter (PM10) suspended dust - 7 (Good)
- particulate matter (PM2.5) dust - 2 (Good)
- carbon monoxide (CO) - 100 (Good)
- nitrogen dioxide (NO2) - 8 (Good)
- ozone (O3) - 0 (Good)
- sulfur dioxide (SO2) - 9 (Good)

What is the air quality in Siping today? Is the air polluted in Siping?. Is there smog?
What is the level of PM10 today in Siping? (particulate matter (PM10) suspended dust)
The current level of particulate matter PM10 in Siping is:
7 (Good)
The highest PM10 values usually occur in month: 137 (January 2020).
The lowest value of particulate matter PM10 pollution in Siping is usually recorded in: August (25).
What is the current level of PM2.5 in Siping? (particulate matter (PM2.5) dust)
Today's PM2.5 level is:
2 (Good)
For comparison, the highest level of PM2.5 in Siping in the last 7 days was: 24 (Friday, May 27, 2022) and the lowest: 24 (Friday, May 27, 2022).
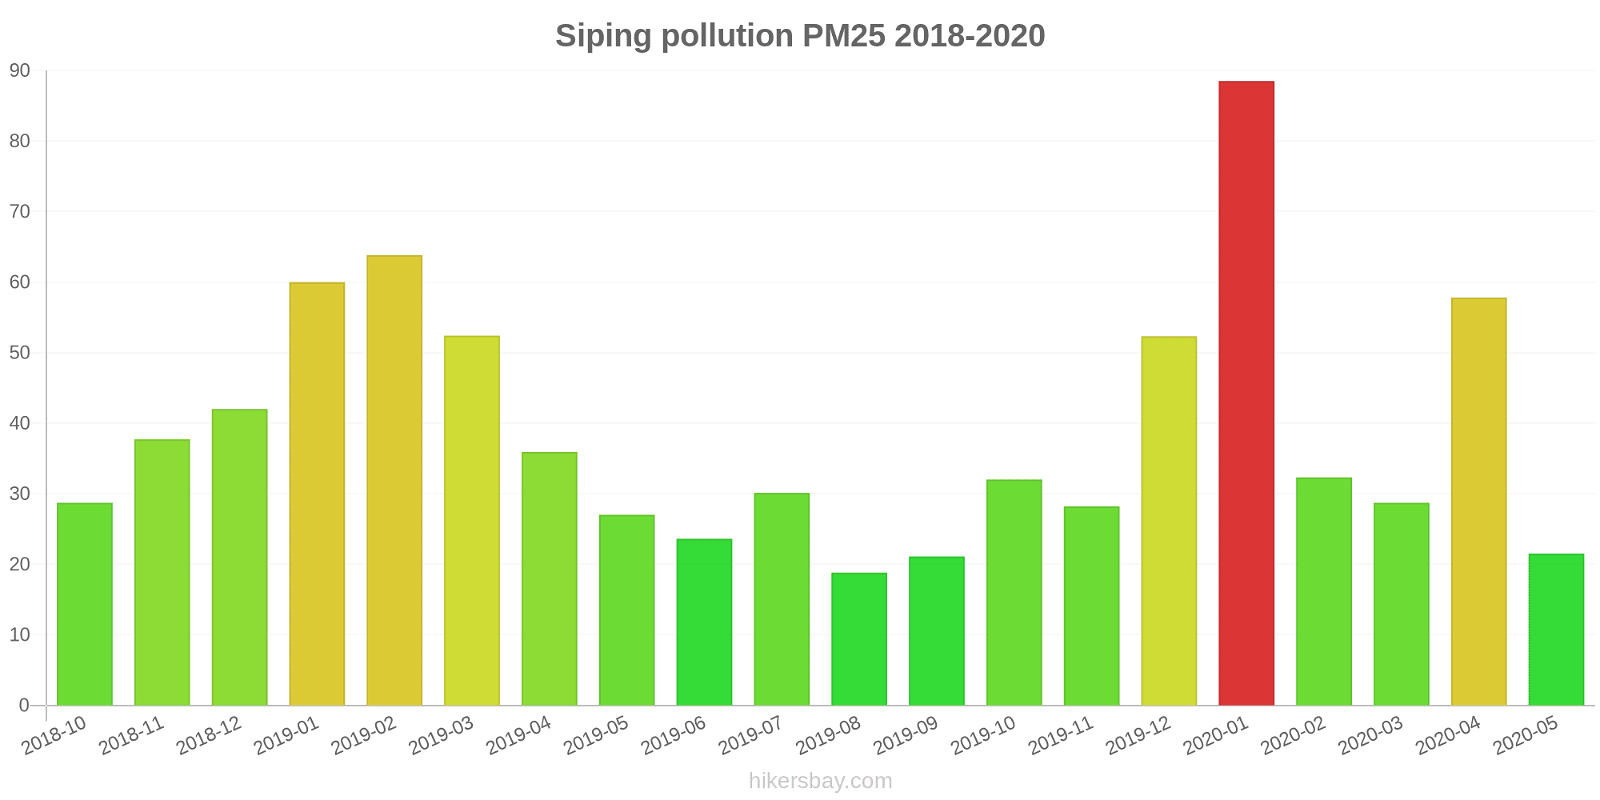
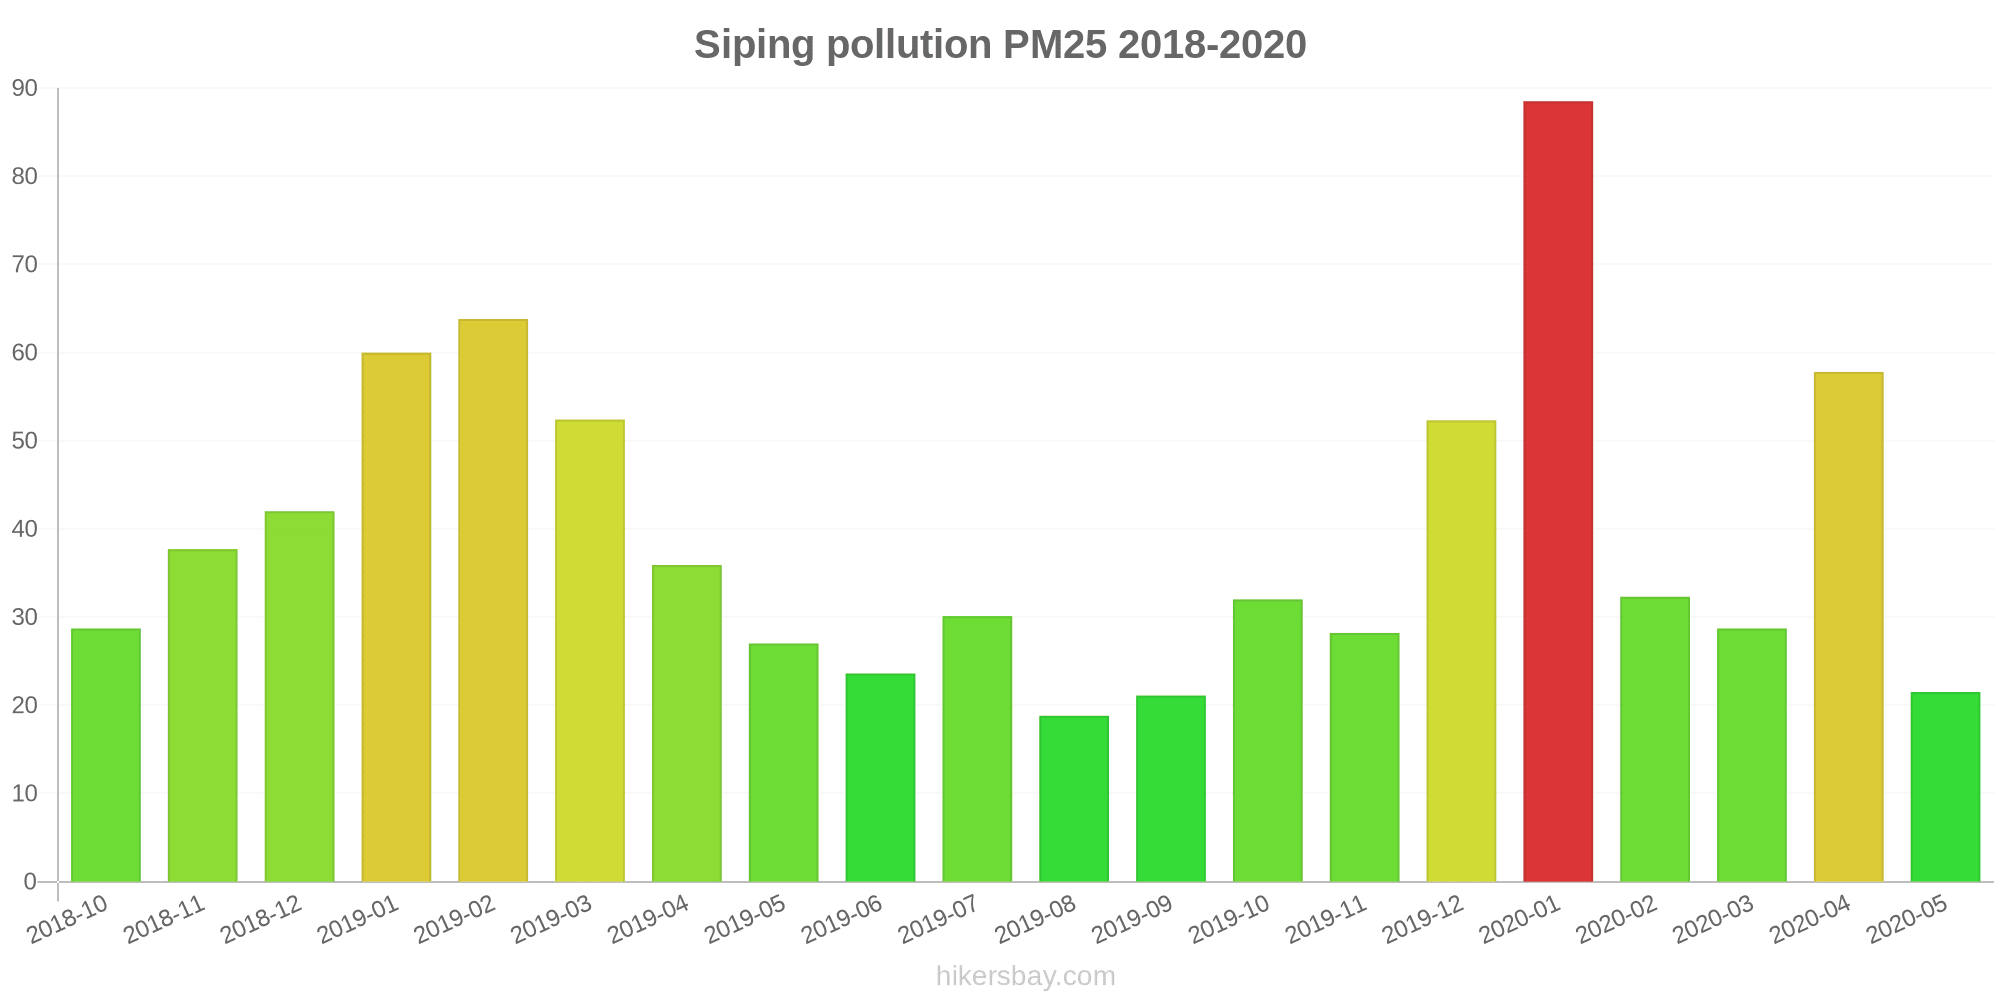
The highest PM2.5 values were recorded: 89 (January 2020).
The lowest level of particulate matter PM2.5 pollution occurs in month: August (19).
How high is the CO level? (carbon monoxide (CO))
100 (Good)
How high is the level of NO2? (nitrogen dioxide (NO2))
8 (Good)
How is the O3 level today in Siping? (ozone (O3))
0 (Good)
What is the level of SO2 pollution? (sulfur dioxide (SO2))
9 (Good)
Current data Friday, May 27, 2022, 12:00 PM
PM10 7 (Good)
PM2,5 2 (Good)
CO 100 (Good)
NO2 8 (Good)
O3 0 (Good)
SO2 9 (Good)
Data on air pollution from recent days in Siping
index
2022-05-27
pm10
32
Moderate
pm25
24
Moderate
co
468
Good
no2
21
Good
o3
32
Good
so2
5
Good
data source »
Air pollution in Siping from October 2018 to May 2020
index
2020-05
2020-04
2020-03
2020-02
2020-01
2019-12
2019-11
2019-10
2019-09
2019-08
2019-07
2019-06
2019-05
2019-04
2019-03
2019-02
2019-01
2018-12
2018-11
2018-10
pm25
22 (Moderate)
58 (Unhealthy)
29 (Moderate)
32 (Moderate)
89 (Very Unhealthy)
52 (Unhealthy for Sensitive Groups)
28 (Moderate)
32 (Moderate)
21 (Moderate)
19 (Moderate)
30 (Moderate)
24 (Moderate)
27 (Moderate)
36 (Unhealthy for Sensitive Groups)
52 (Unhealthy for Sensitive Groups)
64 (Unhealthy)
60 (Unhealthy)
42 (Unhealthy for Sensitive Groups)
38 (Unhealthy for Sensitive Groups)
29 (Moderate)
co
451 (Good)
660 (Good)
519 (Good)
587 (Good)
1 (Good)
894 (Good)
595 (Good)
661 (Good)
614 (Good)
713 (Good)
811 (Good)
625 (Good)
561 (Good)
647 (Good)
755 (Good)
739 (Good)
1 (Good)
813 (Good)
786 (Good)
714 (Good)
no2
20 (Good)
34 (Good)
20 (Good)
18 (Good)
46 (Moderate)
32 (Good)
25 (Good)
28 (Good)
21 (Good)
16 (Good)
21 (Good)
28 (Good)
21 (Good)
26 (Good)
31 (Good)
29 (Good)
36 (Good)
28 (Good)
32 (Good)
31 (Good)
o3
139 (Unhealthy for Sensitive Groups)
125 (Unhealthy for Sensitive Groups)
98 (Moderate)
91 (Moderate)
88 (Moderate)
61 (Good)
57 (Good)
88 (Moderate)
112 (Moderate)
96 (Moderate)
170 (Unhealthy)
144 (Unhealthy for Sensitive Groups)
133 (Unhealthy for Sensitive Groups)
105 (Moderate)
99 (Moderate)
83 (Moderate)
61 (Good)
57 (Good)
65 (Good)
76 (Moderate)
pm10
84 (Unhealthy)
119 (Very Unhealthy)
73 (Unhealthy for Sensitive Groups)
59 (Unhealthy for Sensitive Groups)
137 (Very Unhealthy)
93 (Unhealthy)
69 (Unhealthy for Sensitive Groups)
68 (Unhealthy for Sensitive Groups)
47 (Moderate)
25 (Moderate)
43 (Moderate)
43 (Moderate)
72 (Unhealthy for Sensitive Groups)
119 (Very Unhealthy)
106 (Unhealthy)
95 (Unhealthy)
107 (Unhealthy)
71 (Unhealthy for Sensitive Groups)
70 (Unhealthy for Sensitive Groups)
60 (Unhealthy for Sensitive Groups)
so2
9.9 (Good)
12 (Good)
11 (Good)
14 (Good)
26 (Good)
14 (Good)
11 (Good)
7.5 (Good)
6.5 (Good)
6.6 (Good)
6.7 (Good)
7.3 (Good)
7.6 (Good)
8.6 (Good)
12 (Good)
20 (Good)
19 (Good)
13 (Good)
12 (Good)
8 (Good)
data source »
一商场
Friday, May 27, 2022, 12:00 PM
PM10 6.7 (Good)
particulate matter (PM10) suspended dust
PM2,5 1.7 (Good)
particulate matter (PM2.5) dust
CO 100 (Good)
carbon monoxide (CO)
NO2 7.6 (Good)
nitrogen dioxide (NO2)
O3 0.02 (Good)
ozone (O3)
SO2 8.6 (Good)
sulfur dioxide (SO2)
一商场
index
2022-05-27
pm10
32
pm25
24
co
468
no2
21
o3
32
so2
4.6
一商场
2018-10 2020-05

index
2020-05
2020-04
2020-03
2020-02
2020-01
2019-12
2019-11
2019-10
2019-09
2019-08
2019-07
2019-06
2019-05
2019-04
2019-03
2019-02
2019-01
2018-12
2018-11
2018-10
pm25
22
58
29
32
89
52
28
32
21
19
30
24
27
36
52
64
60
42
38
29
co
451
660
519
587
1
894
595
661
614
713
811
625
561
647
755
739
1
813
786
714
no2
20
34
20
18
46
32
25
28
21
16
21
28
21
26
31
29
36
28
32
31
o3
139
125
98
91
88
61
57
88
112
96
170
144
133
105
99
83
61
57
65
76
pm10
84
119
73
59
137
93
69
68
47
25
43
43
72
119
106
95
107
71
70
60
so2
9.9
12
11
14
26
14
11
7.5
6.5
6.6
6.7
7.3
7.6
8.6
12
20
19
13
12
8
* Pollution data source:
https://openaq.org
(ChinaAQIData)
The data is licensed under CC-By 4.0
PM10 7 (Good)
PM2,5 2 (Good)
CO 100 (Good)
NO2 8 (Good)
O3 0 (Good)
SO2 9 (Good)
Data on air pollution from recent days in Siping
| index | 2022-05-27 |
|---|---|
| pm10 | 32 Moderate |
| pm25 | 24 Moderate |
| co | 468 Good |
| no2 | 21 Good |
| o3 | 32 Good |
| so2 | 5 Good |
| index | 2020-05 | 2020-04 | 2020-03 | 2020-02 | 2020-01 | 2019-12 | 2019-11 | 2019-10 | 2019-09 | 2019-08 | 2019-07 | 2019-06 | 2019-05 | 2019-04 | 2019-03 | 2019-02 | 2019-01 | 2018-12 | 2018-11 | 2018-10 |
|---|---|---|---|---|---|---|---|---|---|---|---|---|---|---|---|---|---|---|---|---|
| pm25 | 22 (Moderate) | 58 (Unhealthy) | 29 (Moderate) | 32 (Moderate) | 89 (Very Unhealthy) | 52 (Unhealthy for Sensitive Groups) | 28 (Moderate) | 32 (Moderate) | 21 (Moderate) | 19 (Moderate) | 30 (Moderate) | 24 (Moderate) | 27 (Moderate) | 36 (Unhealthy for Sensitive Groups) | 52 (Unhealthy for Sensitive Groups) | 64 (Unhealthy) | 60 (Unhealthy) | 42 (Unhealthy for Sensitive Groups) | 38 (Unhealthy for Sensitive Groups) | 29 (Moderate) |
| co | 451 (Good) | 660 (Good) | 519 (Good) | 587 (Good) | 1 (Good) | 894 (Good) | 595 (Good) | 661 (Good) | 614 (Good) | 713 (Good) | 811 (Good) | 625 (Good) | 561 (Good) | 647 (Good) | 755 (Good) | 739 (Good) | 1 (Good) | 813 (Good) | 786 (Good) | 714 (Good) |
| no2 | 20 (Good) | 34 (Good) | 20 (Good) | 18 (Good) | 46 (Moderate) | 32 (Good) | 25 (Good) | 28 (Good) | 21 (Good) | 16 (Good) | 21 (Good) | 28 (Good) | 21 (Good) | 26 (Good) | 31 (Good) | 29 (Good) | 36 (Good) | 28 (Good) | 32 (Good) | 31 (Good) |
| o3 | 139 (Unhealthy for Sensitive Groups) | 125 (Unhealthy for Sensitive Groups) | 98 (Moderate) | 91 (Moderate) | 88 (Moderate) | 61 (Good) | 57 (Good) | 88 (Moderate) | 112 (Moderate) | 96 (Moderate) | 170 (Unhealthy) | 144 (Unhealthy for Sensitive Groups) | 133 (Unhealthy for Sensitive Groups) | 105 (Moderate) | 99 (Moderate) | 83 (Moderate) | 61 (Good) | 57 (Good) | 65 (Good) | 76 (Moderate) |
| pm10 | 84 (Unhealthy) | 119 (Very Unhealthy) | 73 (Unhealthy for Sensitive Groups) | 59 (Unhealthy for Sensitive Groups) | 137 (Very Unhealthy) | 93 (Unhealthy) | 69 (Unhealthy for Sensitive Groups) | 68 (Unhealthy for Sensitive Groups) | 47 (Moderate) | 25 (Moderate) | 43 (Moderate) | 43 (Moderate) | 72 (Unhealthy for Sensitive Groups) | 119 (Very Unhealthy) | 106 (Unhealthy) | 95 (Unhealthy) | 107 (Unhealthy) | 71 (Unhealthy for Sensitive Groups) | 70 (Unhealthy for Sensitive Groups) | 60 (Unhealthy for Sensitive Groups) |
| so2 | 9.9 (Good) | 12 (Good) | 11 (Good) | 14 (Good) | 26 (Good) | 14 (Good) | 11 (Good) | 7.5 (Good) | 6.5 (Good) | 6.6 (Good) | 6.7 (Good) | 7.3 (Good) | 7.6 (Good) | 8.6 (Good) | 12 (Good) | 20 (Good) | 19 (Good) | 13 (Good) | 12 (Good) | 8 (Good) |
PM10 6.7 (Good)
particulate matter (PM10) suspended dustPM2,5 1.7 (Good)
particulate matter (PM2.5) dustCO 100 (Good)
carbon monoxide (CO)NO2 7.6 (Good)
nitrogen dioxide (NO2)O3 0.02 (Good)
ozone (O3)SO2 8.6 (Good)
sulfur dioxide (SO2)一商场
| index | 2022-05-27 |
|---|---|
| pm10 | 32 |
| pm25 | 24 |
| co | 468 |
| no2 | 21 |
| o3 | 32 |
| so2 | 4.6 |
一商场

| index | 2020-05 | 2020-04 | 2020-03 | 2020-02 | 2020-01 | 2019-12 | 2019-11 | 2019-10 | 2019-09 | 2019-08 | 2019-07 | 2019-06 | 2019-05 | 2019-04 | 2019-03 | 2019-02 | 2019-01 | 2018-12 | 2018-11 | 2018-10 |
|---|---|---|---|---|---|---|---|---|---|---|---|---|---|---|---|---|---|---|---|---|
| pm25 | 22 | 58 | 29 | 32 | 89 | 52 | 28 | 32 | 21 | 19 | 30 | 24 | 27 | 36 | 52 | 64 | 60 | 42 | 38 | 29 |
| co | 451 | 660 | 519 | 587 | 1 | 894 | 595 | 661 | 614 | 713 | 811 | 625 | 561 | 647 | 755 | 739 | 1 | 813 | 786 | 714 |
| no2 | 20 | 34 | 20 | 18 | 46 | 32 | 25 | 28 | 21 | 16 | 21 | 28 | 21 | 26 | 31 | 29 | 36 | 28 | 32 | 31 |
| o3 | 139 | 125 | 98 | 91 | 88 | 61 | 57 | 88 | 112 | 96 | 170 | 144 | 133 | 105 | 99 | 83 | 61 | 57 | 65 | 76 |
| pm10 | 84 | 119 | 73 | 59 | 137 | 93 | 69 | 68 | 47 | 25 | 43 | 43 | 72 | 119 | 106 | 95 | 107 | 71 | 70 | 60 |
| so2 | 9.9 | 12 | 11 | 14 | 26 | 14 | 11 | 7.5 | 6.5 | 6.6 | 6.7 | 7.3 | 7.6 | 8.6 | 12 | 20 | 19 | 13 | 12 | 8 |