Air Pollution in Lingzhao: Real-time Air Quality Index and smog alert.
Pollution and air quality forecast for Lingzhao. Today is Tuesday, June 2, 2026. The following air pollution values have been recorded for Lingzhao:- particulate matter (PM10) suspended dust - 179 (Very bad Hazardous)
- particulate matter (PM2.5) dust - 35 (Unhealthy for Sensitive Groups)
- ozone (O3) - 0 (Good)
- nitrogen dioxide (NO2) - 0 (Good)
- sulfur dioxide (SO2) - 0 (Good)

What is the air quality in Lingzhao today? Is the air polluted in Lingzhao?. Is there smog?
What is the level of PM10 today in Lingzhao? (particulate matter (PM10) suspended dust)
The current level of particulate matter PM10 in Lingzhao is:
179 (Very bad Hazardous)
The highest PM10 values usually occur in month: 189 (January 2019).
The lowest value of particulate matter PM10 pollution in Lingzhao is usually recorded in: August (53).
What is the current level of PM2.5 in Lingzhao? (particulate matter (PM2.5) dust)
Today's PM2.5 level is:
35 (Unhealthy for Sensitive Groups)
For comparison, the highest level of PM2.5 in Lingzhao in the last 7 days was: 56 (Friday, May 27, 2022) and the lowest: 56 (Friday, May 27, 2022).
The highest PM2.5 values were recorded: 149 (January 2019).
The lowest level of particulate matter PM2.5 pollution occurs in month: July (24).
How is the O3 level today in Lingzhao? (ozone (O3))
0 (Good)
How high is the level of NO2? (nitrogen dioxide (NO2))
0 (Good)
What is the level of SO2 pollution? (sulfur dioxide (SO2))
0 (Good)
Current data Friday, May 27, 2022, 12:00 PM
PM10 179 (Very bad Hazardous)
PM2,5 35 (Unhealthy for Sensitive Groups)
O3 0 (Good)
NO2 0 (Good)
SO2 0 (Good)
Data on air pollution from recent days in Lingzhao
index
2022-05-27
pm10
56
Unhealthy for Sensitive Groups
pm25
56
Unhealthy
o3
0
Good
no2
0
Good
so2
0
Good
data source »
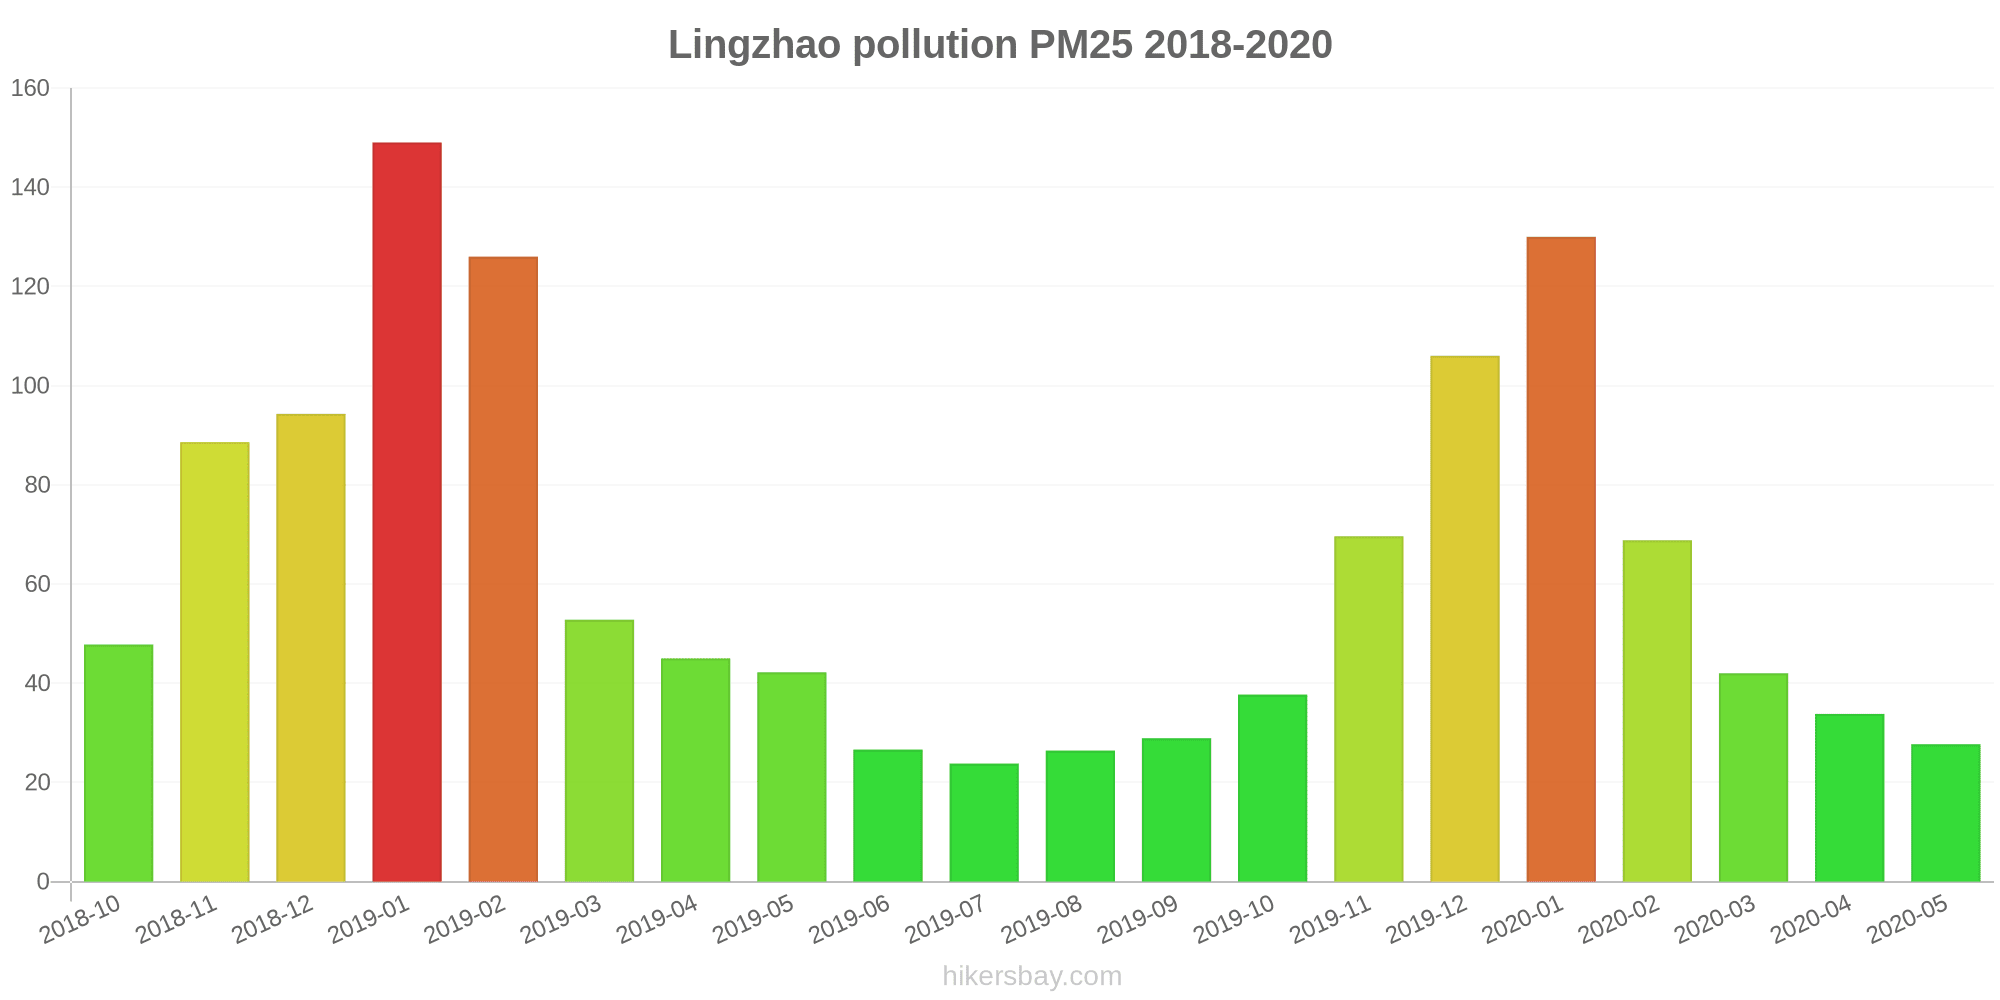
Air pollution in Lingzhao from October 2018 to May 2020

index
2020-05
2020-04
2020-03
2020-02
2020-01
2019-12
2019-11
2019-10
2019-09
2019-08
2019-07
2019-06
2019-05
2019-04
2019-03
2019-02
2019-01
2018-12
2018-11
2018-10
pm25
28 (Moderate)
34 (Moderate)
42 (Unhealthy for Sensitive Groups)
69 (Unhealthy)
130 (Very bad Hazardous)
106 (Very Unhealthy)
70 (Unhealthy)
38 (Unhealthy for Sensitive Groups)
29 (Moderate)
26 (Moderate)
24 (Moderate)
27 (Moderate)
42 (Unhealthy for Sensitive Groups)
45 (Unhealthy for Sensitive Groups)
53 (Unhealthy for Sensitive Groups)
126 (Very bad Hazardous)
149 (Very bad Hazardous)
94 (Very Unhealthy)
89 (Very Unhealthy)
48 (Unhealthy for Sensitive Groups)
co
495 (Good)
529 (Good)
579 (Good)
959 (Good)
1 (Good)
1 (Good)
867 (Good)
783 (Good)
741 (Good)
730 (Good)
698 (Good)
585 (Good)
494 (Good)
747 (Good)
588 (Good)
1 (Good)
1 (Good)
1 (Good)
1 (Good)
907 (Good)
no2
32 (Good)
48 (Moderate)
43 (Moderate)
26 (Good)
46 (Moderate)
58 (Moderate)
54 (Moderate)
46 (Moderate)
44 (Moderate)
34 (Good)
33 (Good)
37 (Good)
39 (Good)
42 (Moderate)
55 (Moderate)
40 (Good)
68 (Moderate)
65 (Moderate)
62 (Moderate)
58 (Moderate)
o3
149 (Unhealthy for Sensitive Groups)
131 (Unhealthy for Sensitive Groups)
105 (Moderate)
106 (Moderate)
66 (Good)
55 (Good)
54 (Good)
76 (Moderate)
135 (Unhealthy for Sensitive Groups)
164 (Unhealthy)
172 (Unhealthy)
165 (Unhealthy)
140 (Unhealthy for Sensitive Groups)
129 (Unhealthy for Sensitive Groups)
113 (Moderate)
93 (Moderate)
65 (Good)
41 (Good)
60 (Good)
98 (Moderate)
pm10
76 (Unhealthy for Sensitive Groups)
86 (Unhealthy)
112 (Very Unhealthy)
101 (Unhealthy)
146 (Very Unhealthy)
138 (Very Unhealthy)
116 (Very Unhealthy)
79 (Unhealthy for Sensitive Groups)
56 (Unhealthy for Sensitive Groups)
53 (Unhealthy for Sensitive Groups)
54 (Unhealthy for Sensitive Groups)
58 (Unhealthy for Sensitive Groups)
110 (Very Unhealthy)
109 (Unhealthy)
115 (Very Unhealthy)
168 (Very bad Hazardous)
189 (Very bad Hazardous)
180 (Very bad Hazardous)
162 (Very bad Hazardous)
94 (Unhealthy)
so2
8.4 (Good)
10 (Good)
8.8 (Good)
10 (Good)
12 (Good)
12 (Good)
9.3 (Good)
6 (Good)
5.7 (Good)
5.5 (Good)
4.9 (Good)
6.7 (Good)
8.3 (Good)
8.1 (Good)
8.9 (Good)
11 (Good)
16 (Good)
22 (Good)
14 (Good)
10 (Good)
data source »
气象站(对照点)
Friday, May 27, 2022, 12:00 PM
PM10 179 (Very bad Hazardous)
particulate matter (PM10) suspended dust
PM2,5 35 (Unhealthy for Sensitive Groups)
particulate matter (PM2.5) dust
O3 0.04 (Good)
ozone (O3)
NO2 0 (Good)
nitrogen dioxide (NO2)
SO2 0 (Good)
sulfur dioxide (SO2)
气象站(对照点)
index
2022-05-27
pm10
56
pm25
56
o3
0.03
no2
0
so2
0
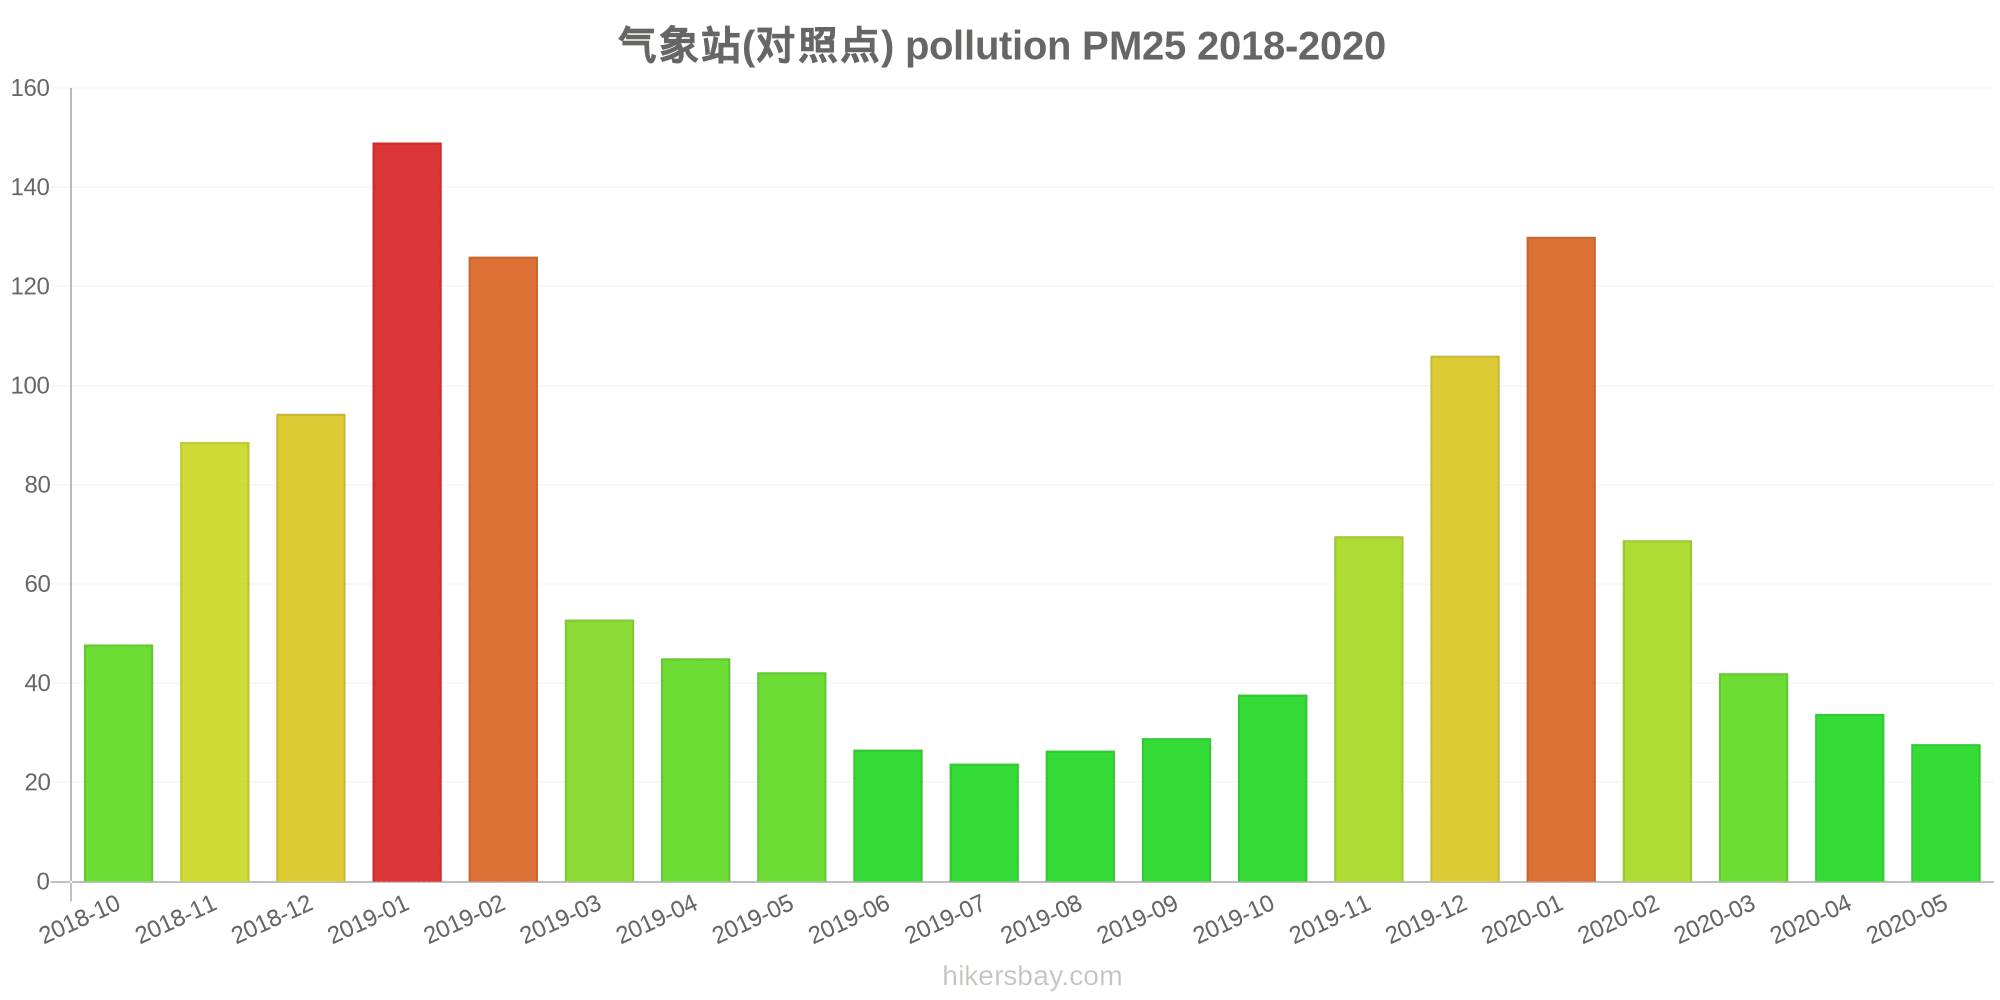
气象站(对照点)
2018-10 2020-05

index
2020-05
2020-04
2020-03
2020-02
2020-01
2019-12
2019-11
2019-10
2019-09
2019-08
2019-07
2019-06
2019-05
2019-04
2019-03
2019-02
2019-01
2018-12
2018-11
2018-10
pm25
28
34
42
69
130
106
70
38
29
26
24
27
42
45
53
126
149
94
89
48
co
495
529
579
959
1
1
867
783
741
730
698
585
494
747
588
1
1
1
1
907
no2
32
48
43
26
46
58
54
46
44
34
33
37
39
42
55
40
68
65
62
58
o3
149
131
105
106
66
55
54
76
135
164
172
165
140
129
113
93
65
41
60
98
pm10
76
86
112
101
146
138
116
79
56
53
54
58
110
109
115
168
189
180
162
94
so2
8.4
10
8.8
10
12
12
9.3
6
5.7
5.5
4.9
6.7
8.3
8.1
8.9
11
16
22
14
10
* Pollution data source:
https://openaq.org
(ChinaAQIData)
The data is licensed under CC-By 4.0
PM10 179 (Very bad Hazardous)
PM2,5 35 (Unhealthy for Sensitive Groups)
O3 0 (Good)
NO2 0 (Good)
SO2 0 (Good)
Data on air pollution from recent days in Lingzhao
| index | 2022-05-27 |
|---|---|
| pm10 | 56 Unhealthy for Sensitive Groups |
| pm25 | 56 Unhealthy |
| o3 | 0 Good |
| no2 | 0 Good |
| so2 | 0 Good |
| index | 2020-05 | 2020-04 | 2020-03 | 2020-02 | 2020-01 | 2019-12 | 2019-11 | 2019-10 | 2019-09 | 2019-08 | 2019-07 | 2019-06 | 2019-05 | 2019-04 | 2019-03 | 2019-02 | 2019-01 | 2018-12 | 2018-11 | 2018-10 |
|---|---|---|---|---|---|---|---|---|---|---|---|---|---|---|---|---|---|---|---|---|
| pm25 | 28 (Moderate) | 34 (Moderate) | 42 (Unhealthy for Sensitive Groups) | 69 (Unhealthy) | 130 (Very bad Hazardous) | 106 (Very Unhealthy) | 70 (Unhealthy) | 38 (Unhealthy for Sensitive Groups) | 29 (Moderate) | 26 (Moderate) | 24 (Moderate) | 27 (Moderate) | 42 (Unhealthy for Sensitive Groups) | 45 (Unhealthy for Sensitive Groups) | 53 (Unhealthy for Sensitive Groups) | 126 (Very bad Hazardous) | 149 (Very bad Hazardous) | 94 (Very Unhealthy) | 89 (Very Unhealthy) | 48 (Unhealthy for Sensitive Groups) |
| co | 495 (Good) | 529 (Good) | 579 (Good) | 959 (Good) | 1 (Good) | 1 (Good) | 867 (Good) | 783 (Good) | 741 (Good) | 730 (Good) | 698 (Good) | 585 (Good) | 494 (Good) | 747 (Good) | 588 (Good) | 1 (Good) | 1 (Good) | 1 (Good) | 1 (Good) | 907 (Good) |
| no2 | 32 (Good) | 48 (Moderate) | 43 (Moderate) | 26 (Good) | 46 (Moderate) | 58 (Moderate) | 54 (Moderate) | 46 (Moderate) | 44 (Moderate) | 34 (Good) | 33 (Good) | 37 (Good) | 39 (Good) | 42 (Moderate) | 55 (Moderate) | 40 (Good) | 68 (Moderate) | 65 (Moderate) | 62 (Moderate) | 58 (Moderate) |
| o3 | 149 (Unhealthy for Sensitive Groups) | 131 (Unhealthy for Sensitive Groups) | 105 (Moderate) | 106 (Moderate) | 66 (Good) | 55 (Good) | 54 (Good) | 76 (Moderate) | 135 (Unhealthy for Sensitive Groups) | 164 (Unhealthy) | 172 (Unhealthy) | 165 (Unhealthy) | 140 (Unhealthy for Sensitive Groups) | 129 (Unhealthy for Sensitive Groups) | 113 (Moderate) | 93 (Moderate) | 65 (Good) | 41 (Good) | 60 (Good) | 98 (Moderate) |
| pm10 | 76 (Unhealthy for Sensitive Groups) | 86 (Unhealthy) | 112 (Very Unhealthy) | 101 (Unhealthy) | 146 (Very Unhealthy) | 138 (Very Unhealthy) | 116 (Very Unhealthy) | 79 (Unhealthy for Sensitive Groups) | 56 (Unhealthy for Sensitive Groups) | 53 (Unhealthy for Sensitive Groups) | 54 (Unhealthy for Sensitive Groups) | 58 (Unhealthy for Sensitive Groups) | 110 (Very Unhealthy) | 109 (Unhealthy) | 115 (Very Unhealthy) | 168 (Very bad Hazardous) | 189 (Very bad Hazardous) | 180 (Very bad Hazardous) | 162 (Very bad Hazardous) | 94 (Unhealthy) |
| so2 | 8.4 (Good) | 10 (Good) | 8.8 (Good) | 10 (Good) | 12 (Good) | 12 (Good) | 9.3 (Good) | 6 (Good) | 5.7 (Good) | 5.5 (Good) | 4.9 (Good) | 6.7 (Good) | 8.3 (Good) | 8.1 (Good) | 8.9 (Good) | 11 (Good) | 16 (Good) | 22 (Good) | 14 (Good) | 10 (Good) |
PM10 179 (Very bad Hazardous)
particulate matter (PM10) suspended dustPM2,5 35 (Unhealthy for Sensitive Groups)
particulate matter (PM2.5) dustO3 0.04 (Good)
ozone (O3)NO2 0 (Good)
nitrogen dioxide (NO2)SO2 0 (Good)
sulfur dioxide (SO2)气象站(对照点)
| index | 2022-05-27 |
|---|---|
| pm10 | 56 |
| pm25 | 56 |
| o3 | 0.03 |
| no2 | 0 |
| so2 | 0 |
气象站(对照点)
| index | 2020-05 | 2020-04 | 2020-03 | 2020-02 | 2020-01 | 2019-12 | 2019-11 | 2019-10 | 2019-09 | 2019-08 | 2019-07 | 2019-06 | 2019-05 | 2019-04 | 2019-03 | 2019-02 | 2019-01 | 2018-12 | 2018-11 | 2018-10 |
|---|---|---|---|---|---|---|---|---|---|---|---|---|---|---|---|---|---|---|---|---|
| pm25 | 28 | 34 | 42 | 69 | 130 | 106 | 70 | 38 | 29 | 26 | 24 | 27 | 42 | 45 | 53 | 126 | 149 | 94 | 89 | 48 |
| co | 495 | 529 | 579 | 959 | 1 | 1 | 867 | 783 | 741 | 730 | 698 | 585 | 494 | 747 | 588 | 1 | 1 | 1 | 1 | 907 |
| no2 | 32 | 48 | 43 | 26 | 46 | 58 | 54 | 46 | 44 | 34 | 33 | 37 | 39 | 42 | 55 | 40 | 68 | 65 | 62 | 58 |
| o3 | 149 | 131 | 105 | 106 | 66 | 55 | 54 | 76 | 135 | 164 | 172 | 165 | 140 | 129 | 113 | 93 | 65 | 41 | 60 | 98 |
| pm10 | 76 | 86 | 112 | 101 | 146 | 138 | 116 | 79 | 56 | 53 | 54 | 58 | 110 | 109 | 115 | 168 | 189 | 180 | 162 | 94 |
| so2 | 8.4 | 10 | 8.8 | 10 | 12 | 12 | 9.3 | 6 | 5.7 | 5.5 | 4.9 | 6.7 | 8.3 | 8.1 | 8.9 | 11 | 16 | 22 | 14 | 10 |